Abstract
Background
Although it is frequently observed that aligning short reads to genomes becomes harder if they contain complex repeat patterns, there has not been much effort to quantify the relationship between complexity of genomes and difficulty of short-read alignment. Existing measures of sequence complexity seem unsuitable for the understanding and quantification of this relationship.
Results
We investigated several measures of complexity and found that length-sensitive measures of complexity had the highest correlation to accuracy of alignment. In particular, the rate of distinct substrings of length k, where k is similar to the read length, correlated very highly to alignment performance in terms of precision and recall. We showed how to compute this measure efficiently in linear time, making it useful in practice to estimate quickly the difficulty of alignment for new genomes without having to align reads to them first. We showed how the length-sensitive measures could provide additional information for choosing aligners that would align consistently accurately on new genomes.
Conclusions
We formally established a connection between genome complexity and the accuracy of short-read aligners. The relationship between genome complexity and alignment accuracy provides additional useful information for selecting suitable aligners for new genomes. Further, this work suggests that the complexity of genomes sometimes should be thought of in terms of specific computational problems, such as the alignment of short reads to genomes.
Keywords: short-read alignment, genome complexity, next-generation sequencing
Background
Advances in next-generation sequencing technologies have driven the development of computational approaches to address the problem of aligning short reads to reference genomes [1-10]. Even so, the alignment problem remains challenging due to the presence of genomic repeats that are much longer than reads. Yu et al. [11] evaluated alignment performance of several aligners on repetitive regions selected from CpG islands and concluded that long repeats seriously degraded alignment performance.
Researchers generally believe that the difficulty of aligning short reads is very much related to the complexity of genomes; it is easier to misalign short reads when the genomes of interest have long and complicated repeat patterns. While there has been an interest in measuring complexity of strings, recent attention has been focused on complexity of DNA sequences [12-15]. Whiteford et al. [15] utilized k-mer frequencies as a way to visualize and understand the complexity of genomes. Kurtz et al. [14], similarly, annotated plant genomes with k-mer frequencies so that repeat structures and characteristics can be easily visualized. With the same approach to understanding genome complexity, Chor et al. [13] analyzed k-mer spectra of over 100 species and observed multimodal spectra for regions with specific CG content characteristics. Unfortunately, these measures cannot be easily quantified and immediately adopted to study how complexity affects the difficulty of short-read alignment.
In a recent study, Becher et al. [12] introduced a measure known as the I-complexity, which seems most promising as a tool to correlate sequence complexity to difficulty of short-read alignment. The authors showed several interesting properties of this measure, including its closeness to the Lempel-Ziv complexity and its efficient computation in linear time. The I-complexity can be easily adopted for our purpose and will be used among others to understand how genome complexity affects the difficulty of short-read alignment.
In this paper, we propose measures of complexity that are best suited for the analysis and understanding of the difficulty of short-read alignment and how such measures might be helpful in selecting appropriate aligners for new genomes. The inspiration for this work lies in the observation that complex repeat structures in DNA that affect the performance of computational tasks are length specific. For instance, in finding regulatory motifs in DNA sequences, repeated structures of interest are around 8-25 characters long. On the other hand, in aligning reads to genomes, such repeats probably have little effect on the performance of aligners. This means that measures such as the I-complexity that are general and not length-specific might not be best.
Methods
I-complexity and D-complexity
Becher et al. [12] introduced the I-complexity as a measure of complexity of strings. It is proportional to the number of distinct substrings of the input string. Specifically, the I-complexity of a DNA sequence g is defined to be:
where LCP [i] is the length of the longest common prefix of the suffixes of g starting at positions S[i] and at S[i - 1], and S is the suffix array of g. The suffix array S of g stores implicitly lexicographically sorted suffixes of g; i.e. for i < j, gS[i]···|g| (the suffix starting at index S[i]) is lexicographically smaller than gS[j]···|g| (the suffix starting at index S[j]).
The somewhat non-intuitive definition of the I-complexity has some advantages. The authors established upper and lower bounds for I(g), and showed that it was close to the Lempel-Ziv complexity of g. Further, it can be computed in linear time because the suffix and LCP arrays can be constructed in linear time [16,17].
Although the I-complexity will be used in our attempt to explore the relationship between complexity and difficulty of alignment, we introduce a similar measure, D(g), counts directly the rate of distinct substrings:
where f(x) denotes the number of occurrences of x in g. To be precise, D(g) is equal to the total number of distinct substrings divided by the total number of substrings of g. D(g) can be computed in linear time, due to the following lemma.
Lemma 1
Proof Suppose that a substring s of g occurs exactly k times. Then, there will be a block of size k in the suffix array that corresponds to k suffixes that have s as the common prefix. More specifically, assume that s is the common prefix of the suffixes of g starting at positions . We will call the occurrence of s at position S[i] its representative occurrence, and its occurrences at its repeat occurrences.
Each repeat occurrence of s is a prefix of the longest common prefix of the suffixes starting at . This means, each repeat occurrence of s is accounted for uniquely by the values of .
If we focus on a position, for example i + 1, we can see that the longest common prefix between S[i + 1] and S[i] (let's call it ) accounts uniquely for j repeat occurrences, namely . One of these is s; the rest are repeat occurrences of other substrings. Thus, each repeat occurrence is accounted for uniquely in some entry of LCP and each entry of LCP accounts uniquely for some repeat occurrences. That implies that accounts for the total repeat occurrences of all substrings of g.
Further, is the total number of substrings of g, since there are exactly i substrings starting at position i. Thus, if we remove all repeat occurrences from the total number of substrings, we will get precisely the total number of representative occurrences. This means .
Length-sensitive measures of complexity
In addition to the I and D, we introduce two notions of length-sensitive measures of genome complexity. The motivation is that, depending on which computational tasks that are affected by the complexity of genomes, only a narrow range of repeat lengths play an important role; for instance, one would expect repeats that affect the finding of regulatory motifs to be much shorter than those that affect the alignment reads to genomes. Given a number k, we define Dk and Rk as follows:
where f (x) is the number of occurrences of x in g. Dk and Rk measure the rates of distinct substrings and repeats, respectively, of length k. Rk and Dk are not exact "opposites" because Rk does not account for non-repeats, whereas Dk does. Rk is related to the function C(k, r) proposed by Whiteford et al. [15]. C(k, r) is the count of k-mers repeating exactly r times. Therefore, . Dk and Rk can be computed in linear time and space using suffix and LCP arrays.
Lemma 2
Proof A k-substring of g must start at an index between 1 and |g|-k +1. Further, if LCP [j] <k, the k-prefix of the suffix starting at S[j] is different from the k-prefix of the suffix starting at S[j - 1]. Thus, each j for which S[j] ≤ |g| - k + 1 and LCP [j] <k represents exactly one distinct k-substring.
On the other hand, if S[j] > |g|-k+1 or LCP [j] ≥ k, then the k-substring starting at S[j] does not exist or is not distinct. Since LCP runs through all positions of g, all distinct k-substrings are uniquely accounted for.
Lemma 3 , where Ik is the set of intervals [i, j]'s, where i ≤ j, such that
1 LCP [u] ≥ k for i ≤ u ≤ j
2 LCP [i - 1] <k unless i = 1
3 LCP [j + 1] <k unless j = |g|
Proof A k-repeat is a substring x of length k, with f (x) >1. Since the suffix array S is sorted lexicographically, S forms consecutive runs of k-repeats, which are k-prefixes of the suffixes stored implicitly by S. More specifically, each interval [i, j] ∈ Ik corresponds to all occurrences of exactly one k-repeat. The number of occurrences for each k-repeat is exactly j - i + 2.
Ik can be computed in linear time by scanning the LCP array once. Note that the index of LCP runs from 1 to |g|, and LCP [1] = 0.
Relating genome complexity to difficulty of aligning short reads to genomes
I, D, Dk , and Rk provide quantitative measures of complexity for each genome. Intuitively, the more distinct substrings a reference genome has (i.e. high values of I, D, and Dk), the easier to align reads to the reference genome. Conversely, the more long repeats the genome has, the more difficult to align reads to it correctly (since the probability of mismatching of a read with a wrong substring is higher.)
We measure the performance of an alignment algorithm using precision and recall, where precision is defined as the fraction of aligned reads that are correct (i.e. number of correctly aligned reads divided by the total number of aligned reads); and recall is defined as the fraction of reads that are correctly aligned (i.e. number of correctly aligned reads divided by the total number of reads). These definitions were also used by Liu et al. [8].
To correlate complexity values to difficulty of alignment, for each measure of complexity, we computed the linear correlation between the complexity values of sequences in a diverse data set including 100 genomic sequences, and the actual performance for each of 10 popular aligners. A good measure of complexity will correlate highly with alignment performance.
Results
Aligners and genomic data
We selected from NCBI and EMBL-EBI databases a total of 100 genomic sequences from bacteria, plants, and eukaryotes (including human chromosomes) with diverse complexity. Detail information of these sequences is described in Tables 1, 2, and 3. "N" bases were removed from these genomic sequences because they were not real contents and constituted false long repeats that inappropriately affected the true complexity of the genomes.
Table 1.
Information on the selected 100 genomic sequences [Part 1].
| ID | Genome size | Description | Lineage | Source |
|---|---|---|---|---|
| AE017198 | 1992676 | Lactobacillus johnsonii NCC 533, | Bacteria, Firmicutes | EBI |
| AJ270060 | 14497843 | Arabidopsis thaliana DNA chr. 4, long arm | Eukaryota, Viridiplantae | EBI |
| AM055943 | 2013089 | Toxoplasma gondii RH, genomic DNA chr. Ib | Eukaryota, Alveolata | EBI |
| AM263198 | 2814130 | Listeria welshimeri serovar 6b str. SLCC5334 | Bacteria, Firmicutes | EBI |
| AM269894 | 1347714 | Eimeria tenella chr. 1, ordered contigs | Eukaryota, Alveolata | EBI |
| BA000004 | 4202352 | Bacillus halodurans C-125 DNA, | Bacteria, Firmicutes | EBI |
| BN001302 | 4011161 | TPA: Aspergillus nidulans FGSC A4 chr. II | Eukaryota, Fungi | EBI |
| BX284601 | 15072434 | Caenorhabditis elegans Bristol N2 genomic chr., I | Eukaryota, Metazoa | EBI |
| CAID01000012 | 521582 | Ostreococcus tauri WGS project CAID00000000 data, contig chr. 12 | Eukaryota, Viridiplantae | EBI |
| CM000001 | 122678785 | Canis lupus familiaris chr. 1 | Eukaryota, Metazoa | EBI |
| CM000038 | 23914537 | Canis lupus familiaris chr. 38 | Eukaryota, Metazoa | EBI |
| CM000043 | 1786351 | Cryptococcus neoformans var. neoformans B-3501A chr. 4 | Eukaryota, Fungi | EBI |
| CM000071 | 19787792 | Drosophila pseudoobscura pseudoobscura strain MV2-25 chr. 3 | Eukaryota, Metazoa | EBI |
| CM000091 | 57791882 | Rattus norvegicus strain BN/SsNHsdMCW chr. 20 | Eukaryota, Metazoa | EBI |
| CM000110 | 11219875 | Gallus gallus chr. 18 | Eukaryota, Metazoa | EBI |
| CM000134 | 21712932 | Oryza sativa (indica cultivar-group) chr. 9 | Eukaryota, Viridiplantae | EBI |
| CM000152 | 6357299 | Dictyostelium discoideum AX4 chr. 3 | Eukaryota, Amoebozoa | EBI |
| CM000157 | 22324452 | Drosophila yakuba strain Tai18E2 chr. 2L | Eukaryota, Metazoa | EBI |
| CM000158 | 21139217 | Drosophila yakuba strain Tai18E2 chr. 2R | Eukaryota, Metazoa | EBI |
| CM000169 | 4918979 | Aspergillus fumigatus Af293 chr. 1 | Eukaryota, Fungi | EBI |
| CM000177 | 161428367 | Bos taurus chr. 1 | Eukaryota, Metazoa | EBI |
| CM000201 | 44081797 | Bos taurus chr. 25 | Eukaryota, Metazoa | EBI |
| CM000208 | 4054025 | Trypanosoma brucei brucei strain 927/4 GUTat10.1 chr. 10 | Eukaryota, Euglenozoa | EBI |
| CM000209 | 199526509 | Mus musculus chr. 1 | Eukaryota, Metazoa | EBI |
| CM000302 | 78773432 | Macaca mulatta chr. 16 | Eukaryota, Metazoa | EBI |
| CM000377 | 185838109 | Equus caballus chr. 1 | Eukaryota, Metazoa | EBI |
| CM000452 | 2067354 | Plasmodium vivax chr. 11 | Eukaryota, Alveolata | EBI |
| CM000515 | 118548696 | Taeniopygia guttata chr. 1 | Eukaryota, Metazoa | EBI |
| CM000530 | 16962381 | Taeniopygia guttata chr. 13 | Eukaryota, Metazoa | EBI |
| CM000572 | 46535552 | Pongo abelii chr. 22 | Eukaryota, Metazoa | EBI |
| CM000575 | 8914601 | Fusarium graminearum PH-1 chr. 2 | Eukaryota, Fungi | EBI |
| CM000580 | 4643527 | Gibberella moniliformis 7600 chr. 3 | Eukaryota, Fungi | EBI |
| CM000592 | 5212762 | Fusarium oxysporum f. sp. Lycopersici 4287 chr. 4 |
Eukaryota, Fungi | EBI |
Table 2.
Information on the selected 100 genomic sequences [Part 2].
| ID | Genome size | Description | Lineage | Source |
|---|---|---|---|---|
| CM000612 | 1002813 | Phaeodactylum tricornutum CCAP 1055/1 chr. 9 |
Eukaryota, Stramenopiles | EBI |
| CM000638 | 3042585 | Thalassiosira pseudonana CCMP1335 chr. 1 |
Eukaryota, Stramenopiles | EBI |
| CM000692 | 1385275 | Saccharomyces kluyveri NRRL Y-12651 chr. F |
Eukaryota, Fungi | EBI |
| CM000767 | 55460251 | Sorghum bicolor chr. 8 | Eukaryota, Viridiplantae | EBI |
| CM000769 | 60981646 | Sorghum bicolor chr. 10 | Eukaryota, Viridiplantae | EBI |
| CM000777 | 301354135 | Zea mays chr. 1. | Eukaryota, Viridiplantae | EBI |
| CM000799 | 47997241 | Oryctolagus cuniculus chr. 10 | Eukaryota, Metazoa | EBI |
| CM000829 | 61220071 | Sus scrofa chr. 18. | Eukaryota, Metazoa | EBI |
| CM000831 | 1255352 | Drosophila virilis strain 15010-1051.88 chr. 6. |
Eukaryota, Metazoa | EBI |
| CM000850 | 41906774 | Glycine max chr. 17 | Eukaryota, Viridiplantae | EBI |
| CM000875 | 44557958 | Callithrix jacchus chr. 20 | Eukaryota, Metazoa | EBI |
| CM000906 | 55886266 | Ovis aries chr. 22 | Eukaryota, Metazoa | EBI |
| CM000907 | 66770968 | Ovis aries chr. 23 | Eukaryota, Metazoa | EBI |
| CM000917 | 27037145 | Nasonia vitripennis chr. 3 | Eukaryota, Metazoa | EBI |
| CM001221 | 42630297 | Medicago truncatula chr. 5. | Eukaryota, Viridiplantae | EBI |
| CM001222 | 23282162 | Medicago truncatula chr. 6. | Eukaryota, Viridiplantae | EBI |
| CM001276 | 232296185 | Macaca fascicularis chr. 1 | Eukaryota, Metazoa | EBI |
| CM001294 | 65364038 | Macaca fascicularis chr. 19 | Eukaryota, Metazoa | EBI |
| CP000048 | 922307 | Borrelia hermsii DAH, | Bacteria, Spirochaetes | EBI |
| CP000496 | 2740984 | Scheffersomyces stipitis CBS 6054 chr. 2, complete sequence. | Eukaryota, Fungi | EBI |
| CP000828 | 6503724 | Acaryochloris marina MBIC11017, | Bacteria, Cyanobacteria | EBI |
| CP001037 | 8234322 | Nostoc punctiforme PCC 73102, | Bacteria, Cyanobacteria | EBI |
| CP001141 | 945026 | Phaeodactylum tricornutum CCAP 1055/1 chr. 11, complete sequence. |
Eukaryota, Stramenopiles | EBI |
| CP001681 | 5167383 | Pedobacter heparinus DSM 2366, | Bacteria, Bacteroidetes | EBI |
| CP001699 | 9127347 | Chitinophaga pinensis DSM 2588, | Bacteria, Bacteroidetes | EBI |
| CP001982 | 5097447 | Bacillus megaterium DSM319, | Bacteria, Firmicutes | EBI |
| CP002287 | 7013095 | Achromobacter xylosoxidans A8, | Bacteria, Proteobacteria | EBI |
| CP002987 | 4044777 | Acetobacterium woodii DSM 1030, | Bacteria, Firmicutes | EBI |
| CP003170 | 9239851 | Actinoplanes sp. SE50/110, | Bacteria, Actinobacteria | EBI |
| CP003348 | 4321753 | Desulfitobacterium dehalogenans ATCC 51507, | Bacteria, Firmicutes | EBI |
| CP003872 | 5196935 | Acidovorax sp. KKS102, | Bacteria, Proteobacteria | EBI |
| CR380954 | 1050361 | Candida glabrata strain CBS138 chr. H complete sequence. | Eukaryota, Fungi | EBI |
| CU234118 | 7456587 | Bradyrhizobium sp. ORS278,complete sequence. | Bacteria, Proteobacteria | EBI |
| CU329672 | 2452883 | Schizosaccharomyces pombe chr. III, complete sequence | Eukaryota, Fungi | EBI |
Table 3.
Information on the selected 100 genomic sequences [Part 3].
| ID | Genome size | Description | Lineage | Source |
|---|---|---|---|---|
| CU928173 | 1114666 | Zygosaccharomyces rouxii strain CBS732 chr. A complete sequence. | Eukaryota, Fungi | EBI |
| DG000010 | 27390870 | Oryzias latipes DNA, chr.10, strain: HdrR. | Eukaryota, Metazoa | EBI |
| FA000001 | 10049037 | Drosophila melanogaster unordered unlocalized genomic scaffolds (chrUn) | Eukaryota, Metazoa | EBI |
| FM178379 | 3325165 | Aliivibrio salmonicida LFI1238 chr. 1 | Bacteria, Proteobacteria | EBI |
| FN543502 | 5346659 | Citrobacter rodentium ICC168, | Bacteria, Proteobacteria | EBI |
| FN554974 | 4531609 | Trypanosoma brucei gambiense DAL972 chr. 11, complete sequence | Eukaryota, Euglenozoa | EBI |
| FO082874 | 3568623 | Babesia microti strain RI chr. III, complete sequence. | Eukaryota, Alveolata | EBI |
| FP929060 | 3108859 | Clostridiales sp. SM4/1 draft genome. | Bacteria, Firmicutes | EBI |
| FR798980 | 512965 | Leishmania braziliensis MHOM/BR/75/M2904, chr. 6 | Eukaryota, Euglenozoa | EBI |
| GCA 000002035.2 | 60348388 | Danio rerio genome assembly, chr1 | Eukaryota, Metazoa | EBI |
| GCA 000151905.1 | 229507203 | Gorilla gorGor3.1 chr. 1 | Eukaryota | Ensembl |
| HE601630 | 9743550 | Schistosoma mansoni strain Puerto Rico chr. 7, | Eukaryota, Metazoa | EBI |
| HE616744 | 1292049 | Torulaspora delbrueckii CBS 1146 chr. 3, | Eukaryota, Fungi | EBI |
| HE616749 | 833973 | Torulaspora delbrueckii CBS 1146 chr. 8, | Eukaryota, Fungi | EBI |
| HE806319 | 1449145 | Tetrapisispora blattae CBS 6284 chr. 4, | Eukaryota, Fungi | EBI |
| HE978314 | 1290777 | Kazachstania naganishii CBS 8797 chr. 1, | Eukaryota, Fungi | EBI |
| NC 003070.9 | 30427671 | Arabidopsis thaliana chr. 1, complete sequence. | Eukaryota, Viridiplantae | NCBI |
| NC 007605 | 171823 | Human herpesvirus 4 complete wild type genome. | Viruses, dsDNA viruses | NCBI |
| NC 008394.4 | 45064769 | Oryza sativa Japonica Group DNA, chr. 1, complete sequence, cultivar: Nipponbare | Eukaryota, Viridiplantae | NCBI |
| NC 008397.2 | 30039014 | Oryza sativa Japonica Group DNA, chr. 4, complete sequence, cultivar: Nipponbare | Eukaryota, Viridiplantae | NCBI |
| NC 008398.2 | 32124789 | Oryza sativa Japonica Group DNA, chr. 5, complete sequence, cultivar: Nipponbare | Eukaryota, Viridiplantae | NCBI |
| NC 008399.2 | 30357780 | Oryza sativa Japonica Group DNA, chr. 6, complete sequence, cultivar: Nippon bare | Eukaryota, Viridiplantae | NCBI |
| NC 008400.2 | 28530027 | Oryza sativa Japonica Group DNA, chr. 7, complete sequence, cultivar: Nipponbare | Eukaryota, Viridiplantae | NCBI |
| NC 008401.2 | 23661561 | Oryza sativa Japonica Group DNA, chr. 8, complete sequence, cultivar: Nipponbare | Eukaryota, Viridiplantae | NCBI |
| NC 008403.2 | 35571569 | Oryza sativa Japonica Group DNA, chr. 10, complete sequence, cultivar: Nipponbare | Eukaryota, Viridiplantae | NCBI |
| NC 008467.1 | 35863200 | Populus trichocarpa linkage group I, whole genome shotgun sequence | Eukaryota, Viridiplantae | NCBI |
| NT 024477.14 | 1034903 | Homo sapiens chr. 12 genomic contig, GRCh37.p13 Primary Assembly | Eukaryota, Metazoa | NCBI |
| NT 024498.12 | 369930 | Homo sapiens chr. 13 genomic contig, | Eukaryota, Metazoa | NCBI |
| GRCh37.p13 Primary Assembly | ||||
| NT 029928.13 | 3915179 | Homo sapiens chr. 3 genomic contig, GRCh37.p13 Primary Assembly | Eukaryota, Metazoa | NCBI |
| NT 077528.2 | 556644 | Homo sapiens chr. 7 genomic contig, GRCh37.p13 Primary Assembly | Eukaryota, Metazoa | NCBI |
| NT 078094.2 | 868660 | Homo sapiens chr. 15 genomic contig, GRCh37.p13 Primary Assembly | Eukaryota, Metazoa | NCBI |
| NT 167185.1 | 3353625 | Homo sapiens chr. 1 genomic contig, GRCh37.p13 Primary Assembly | Eukaryota, Metazoa | NCBI |
| NT 167196.1 | 754004 | Homo sapiens chr. × genomic contig, GRCh37.p13 Primary Assembly | Eukaryota, Metazoa | NCBI |
We selected 10 popular short-read aligners that employ different algorithmic techniques and indexing structures: SHRiMP2 [1], mrFAST [2], SeqAlto [3], GASSST [4], Bowtie2 [5], BWA-SW [6], SOAP2 [7], CUSHAW2 [8], Masai [9], and Smalt [10].
We used default parameters to run these programs because these aligners appeared to perform well and consistent over the 100 genomes at such settings.
It is not possible to compute the number of correctly aligned reads for real reads because positions of real reads in reference genomes are not known. Consequently, precision and recall cannot be computed using real reads. For this reason, we simulated reads for each genome, 2x coverage of reads at lengths 50, 75, and 100 using the wgsim program [18]. Reads were generated with default parameters; sequencing error rates equal to 0.5%, 1%, 2%, and mutation rates between 0.1% and 1%, of which 15% are indels. These parameters should be sufficiently realistic for the current sequencing technologies and a large range of organisms.
Overview performance of aligners
Figure 1 compares the running times of the aligners as a function of genome size (with 2x coverage). To take advantage of multiple CPU cores, one could manually partition reads into separate sets and run multiple instances across the number of cores. But since some of the aligners were not designed for multiple cores, it made more sense to compare them in single-threaded mode. We found that SHRiMP2 was roughly a magnitude slower than the fastest aligners for larger genomes. Therefore, it was therefore excluded from the figure. Based on running time, Masai, SOAP2 and SeqAlto were among the fastest.
Figure 1.
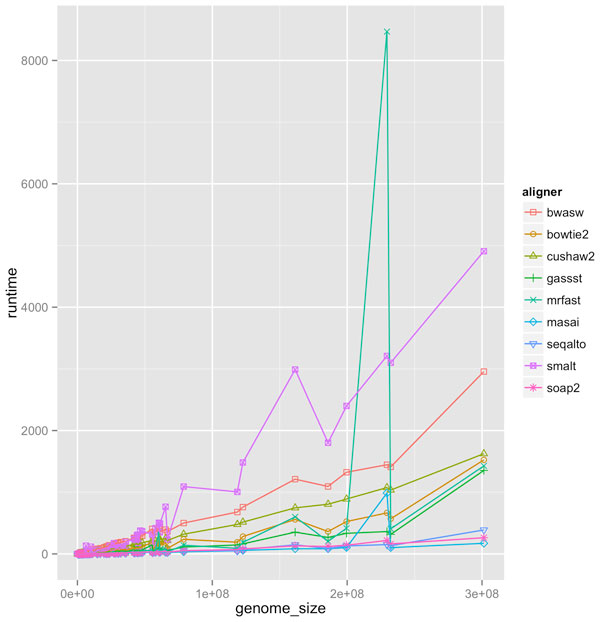
Running time (in seconds) of aligners as function of genome size with 2x coverage, read length equal to 100, sequencing error at 2%, mutation rate at 0.1%.
In terms of precision and recall, the average performance over 100 genomic sequences for read lengths 50, 75 and 100 is summarized in Table 4. All aligners were generally very accurate and increasingly so at longer read lengths. On average, CUSHAW2, Masai, and Smalt performed consistently well across read lengths 50-100, whereas Bowtie2, BWA-SW and SeqAlto performed equally well at read lengths 75-100, but were slightly inferior at read length 50. Strictly based on numbers, SHRiMP2 had very good accuracy (in terms of precision and recall), but for larger genomes, it ran very slow. Performance of GASSST seemed peculiar with some recall values larger than 1. This is possible if a read is aligned to multiple locations by the aligner and counted as correct more than once by the SAMtool evaluation package, which allows a gap (default value of 20) between predicted and actual read positions.
Table 4.
Precision and recall averaged across 100 genomes at read lengths 50, 75, 100.
| Prec-50 | Rec-50 | Prec-75 | Rec-75 | Prec-100 | Rec-100 | |
|---|---|---|---|---|---|---|
| Bowtie2 | 0.9871 | 0.9062 | 0.9943 | 0.9721 | 0.9965 | 0.9891 |
| BWA-SW | 0.9886 | 0.8983 | 0.9952 | 0.9831 | 0.9972 | 0.9951 |
| CUSHAW2 | 0.9882 | 0.9868 | 0.9956 | 0.9956 | 0.9975 | 0.9975 |
| GASSST | 0.9836 | 1.1109 | 0.9897 | 1.0339 | 0.9914 | 0.9757 |
| Masai | 0.9889 | 0.9861 | 0.9958 | 0.9903 | 0.9976 | 0.9790 |
| mrFAST | 0.9408 | 0.5700 | 0.9862 | 0.9166 | 0.9833 | 0.9268 |
| SeqAlto | 0.9875 | 0.8851 | 0.9956 | 0.9748 | 0.9976 | 0.9925 |
| SHRiMP2 | 0.9892 | 0.9798 | 0.9958 | 0.9905 | 0.9975 | 0.9974 |
| Smalt | 0.9858 | 0.9714 | 0.9954 | 0.9944 | 0.9974 | 0.9974 |
| SOAP2 | 0.9893 | 0.9025 | 0.9959 | 0.7904 | 0.9976 | 0.6526 |
In brief, many of these aligners (e.g. Bowtie2, CUSHAW2, SeqAlto) performed similarly accurately on the tested 100 genomes. Without additional information, it can be difficult to decide between these high-performing aligners. It would be useful if we could predict how accurately they perform on new genomes. To explore the aligners' performance on new genomes, we will examine the correlation between various measures of genome complexity and alignment accuracy.
Correlation between genome complexity and alignment performance
Our experiments showed that an appropriate choice of length-sensitive measure of complexity correlated highly with short-read performance of most aligners across read lengths, rates of mutation and sequencing error. Figures 2, 3, and 4 show the correlation between complexity measures Dk, Rk, D, I and alignment performance (precision and recall) at read lengths 50, 75, and 100, respectively, for the 100 genomes. We see that the D-complexity surprisingly had no correlation to performance across all aligners. The I-complexity (Becher et al. [12]) had better but still very low correlation, with correlation coefficients between 0 and -0.3.
Figure 2.
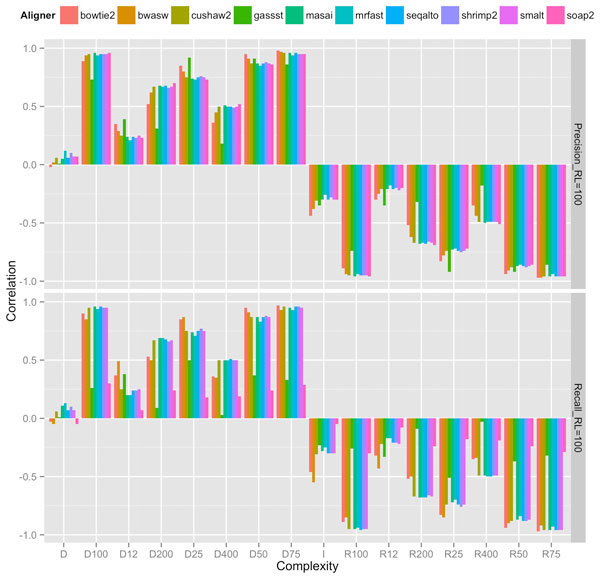
Correlation coefficients between different measures of complexity and aligners' performance (precision and recall) at read length 100.
Figure 3.
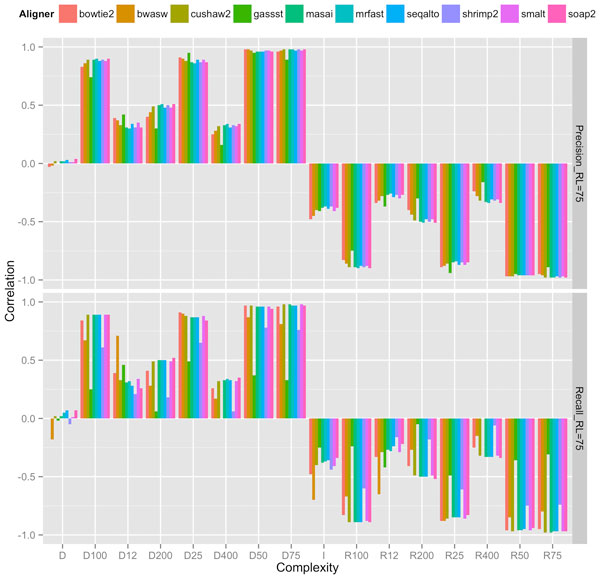
Correlation coefficients between different measures of complexity and aligners' performance (precision and recall) at read length 75.
Figure 4.
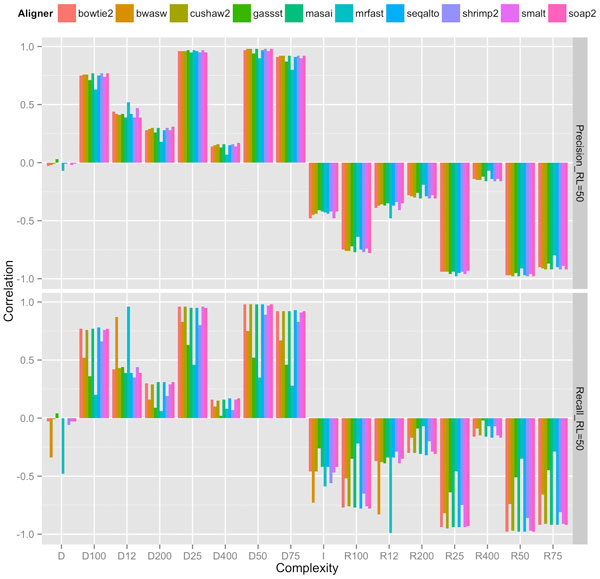
Correlation coefficients between different measures of complexity and aligners' performance (precision and recall) at read length 50.
We can see that there is a value of k for which Dk that correlated highly with performance for both precision and recall, across all read lengths of 50, 75, and 100. For most aligners, the correlation coefficients were approximately 0.95. The only noticeable exception is for GASSST whose correlation coefficients were comparatively lower than those of the others. We think the explanation for this is in GASSST's peculiar performance as we reported earlier, whereby its recalls were above 1 for many of the 100 genomes. Additionally, we could see that when recalls were comparative lower for mrFAST and BWA-SW at read length 50, their correlations were also comparative lower than the other aligners'. It is important to note that some aligners were designed to work optimally with longer reads and consequently do not work very well with shorter reads. One can conclude that if aligners perform predictably in their comfort zones, Dk (or Rk), is a good complexity measure that correlates highly to the accuracy of aligning reads to genomes.
A close examination of the results shows that the value of k for which Dk correlated highest with performance was very close to the read length. For example, at read length 100, D100 had the highest correlations across aligners; at both read lengths 50 and 75, D50 had the highest correlations, although D25 also had very high correlations at read length 50. Thus, the most accurate measure of complexity to understand the difficulty of short-read alignment is length sensitive. Intuitively, this is because repeats of length close to 75, for example, influence the accuracy of the alignment of reads of length 75.
The fact that the best value of k is less than or equal to read length, and not larger than it implies that Dk accounts for approximate repeats. To see this, observe that a 75-mer repeat might not be part of a 100-mer, but surely contains several 50-mer repeats (26 of them, to be precise). This means that D100 neglects to account for several 50-mers, whereas D50 accounts for all of these, and these 50-mer repeats directly have an influence of the accuracy of aligning reads of length 75. This is probably why D50 had a better correlation profile to complexity than D100 did. The fact that Dk accounts for approximate repeats longer than k can be explained formally by the so-called q-gram lemma, which states that two sequences of length k with edit distance e share at least n - q + 1 - qe q-grams. An estimate of complexity involving counting approximate repeats might give better correlation. However, the computing of approximate repeats is computational expensive compared to linear time computation of Dk. The best computation of approximate repeats we know of using a lossless filter [19] has an average running time of O(n2). For long genomes, this running time is not desirable. Since Dk and Rk already correlated quite highly (approximately 0.95) for many aligners, a more efficient running time (linear instead of quadratic) seemed to be a better trade-off than a potentially better correlation.
At different rates of sequencing error and mutation, respectively, we observed similarly high correlation between performance of the aligners and length-sensitive measures of complexity. To study the correlation at different rates of sequencing error and mutation rates, respectively, we chose to correlate D100 and alignment performance on reads of length 100. This case is representative for the correlation between the most appropriate length-sensitive measure and aligners' performance at a given read length. Figure 5 and 6 show the correlation between D100 and aligners' performance of aligning reads of length 100 at different sequencing error rates and different mutation rates, respectively. Across all rates of sequencing error and mutation, the correlation between precision of all aligners and D100 ranged from high to very high. The lowest correlation was obtained for GASSST at about 0.75. Correlations for the other aligners were around 0.95. Similarly, the correlation between recall and D100 was also high for almost all aligners. Overall, compared to precision, recall was, however, not as highly correlated. This might be explained by some aligners' conservative strategies, which aim to make few false positive alignments at the expense of making more false negatives. Further, as expected, at higher rates of sequencing error and mutation, respectively, correlation between performance and complexity decreased. Although, this decrease in correlation is affected more by increasing sequencing errors and by increasing mutations.
Figure 5.
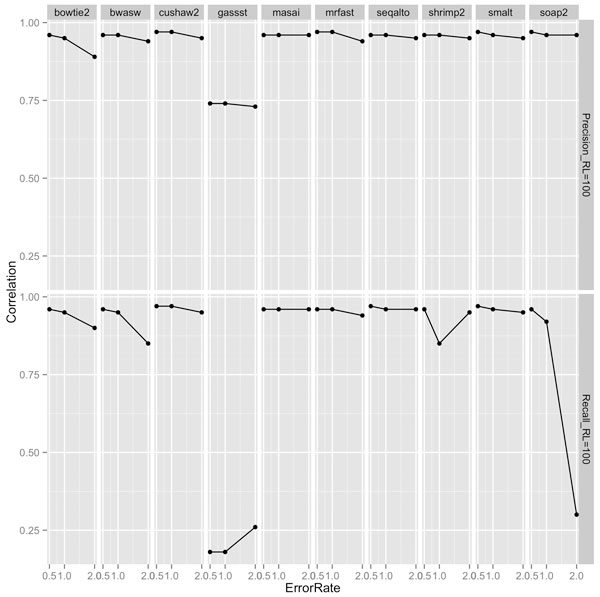
Correlation coefficients between D100 and aligners' performance (precision and recall) of aligning reads of length 100 at sequencing error rates of 0.5%, 1%, and 2%.
Figure 6.
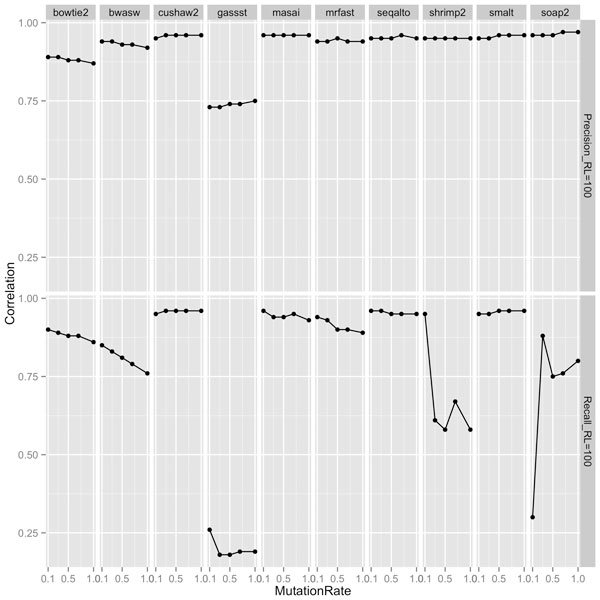
Correlation coefficients between D100 and aligners' performance (precision and recall) of aligning reads of length 100 at mutation rates between 0.1% and 1%.
Predicting aligner performance for unknown genomes
The existence of many short-read aligners makes it challenging for researchers to pick the best one for their genomes of interest. Surveys such as [20] compared popular software packages on a few known genomes and served as a good starting point. But when it comes to adopt a particular software package, the decision seems to be a mixture of many factors including the authors' reputation, past familiarity with the software, its alignment accuracy, its quality and ease of use, its resource usage (running time and RAM), and recommendations of fellow researchers. Our focus is on accuracy, defined in terms of precision and recall.
To predict accuracy of a particular aligner on unknown genomes, researchers currently rely on its accuracy on known genomes. Such prediction can be based on summary statistics such as the top figure in Figure 7. This figure shows precisions and recalls of the aligners across 100 genomes in a boxplot figure, which shows medians, interquartile ranges among other statistics. Considering both statistics on precision and recall, we can see that with the exception of MrFast and SOAP2 (and maybe GASSST), the rest of the aligners had similar precisions and recalls across the 100 genomes. While the aligners' performance appeared similar on known genomes, what remains uncertain is, however, how well they perform on new genomes.
Figure 7.
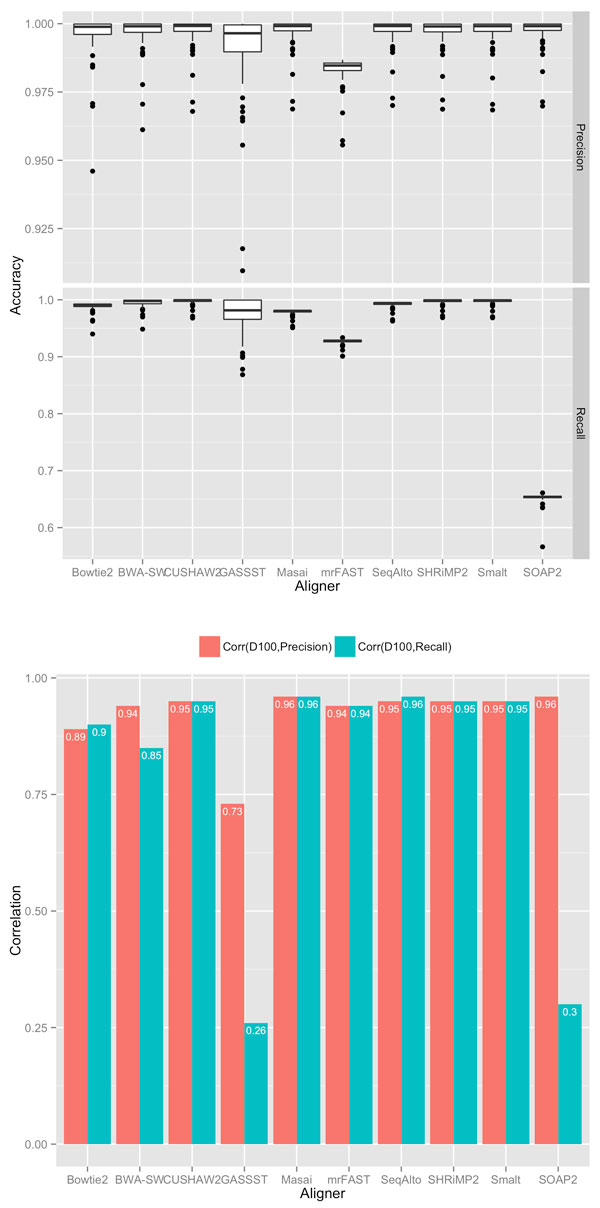
Top Figure: box plots of accuracy (precision and recall) of aligners across 100 genomes; read length equal to 100. Bottom Figure: correlation between performance and D100.
To remove this uncertainty and make more informed decisions, we might additionally incorporate correlation between genome complexity and accuracy. To illustrate this strategy, consider the bottom figure in Figure 7 shows the correlation between D100 (since it is the best at read length 100) of the aligners' precision and recall across the 100 genomes. Comparing the performance of the high-performing aligners identified in the previous step (those other than MrFast and SOAP2), we can see that they have different levels of correlations. For instance, Bowtie2 had noticeably lower correlations (0.89 for precision and 0.90 for recall) than CUSHAW2 for both precision and recall). Thus, although Bowtie2 and CUSHAW2 had similar accuracies for the 100 genomes, we expect that CUSHAW2 will more likely have similar accuracies for unknown genomes.
The effect of k on Dk and Rk
Measures Dk and Rk are length specific and may have different characteristics for different values of k. Figure 8 shows the cumulative distributions of Dk and Rk with k = 12, 25, 50, 100. We can see that the distributions of Dk and Rk are similar, but in an opposite fashion. For D12 or R12, the distribution of complexity of the 100 genomes is quite uniform across the range from 0 to 1. With k > 12, however, the distribution is quite non-uniform. As k becomes larger, the distribution of Dk (or Rk) becomes much more concentrated toward 1 (or 0).
Figure 8.
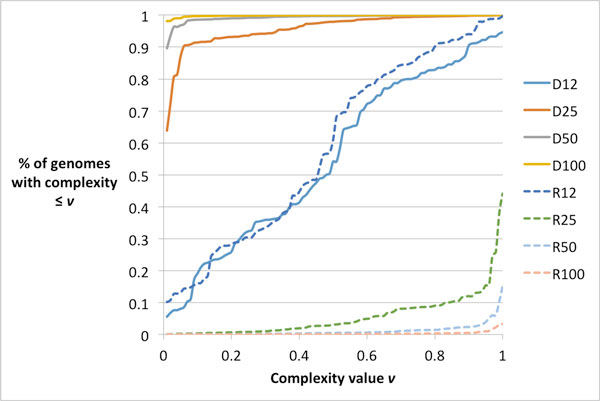
Cumulative distributions of Dk and Rk (k = 12, 25, 50, 100) for 100 genomes.
The transition from near-uniform distributions of D12 (and R12) to very skewed distributions of Dk (and Rk), for k ≥ 50, might explain for the low correlation of D12 (and R12) to alignment accuracy. Thus, we can stipulate that right choice of k is essential for correlating complexity and alignment accuracy. The right choice of k appears to be similar to read length as we have observed.
Conclusions
We demonstrated that length sensitive measures were suitable for studying how genome complexity affected the of short-read alignment. This work has implications for theoretical studies of genome complexity, as well as for comparing alignment methods, and designing cost-effective experiments to assemble genomes. Beyond short-read alignment, these measures should be useful for problems such as short-read assembly, which are affected by genomic repeats.
This method depends on the simulation of reads with known alignment locations, from which we can compute the number of correctly aligned reads for the calculation of precision and recall. With real reads, we cannot know this information. Better simulation of reads will improve the predictive power of this method.
Competing interests
The authors declare that they have no competing interests.
Authors' contributions
VP designed methods, experiments, evaluations. SG, NSV, QT selected data, aligners and performed experiments.
Acknowledgements
This work is partly supported by NSF grant CCF-1320297.
Declarations
Publication charges for this work were funded by NSF grant CCF-1320297 to VP.
This article has been published as part of BMC Bioinformatics Volume 16 Supplement 17, 2015: Selected articles from the Fourth IEEE International Conference on Computational Advances in Bio and medical Sciences (ICCABS 2014): Bioinformatics. The full contents of the supplement are available online at http://www.biomedcentral.com/bmcbioinformatics/supplements/16/S17.
References
- David M, Dzamba M, Lister D, Ilie L, Brudno M. SHRiMP2: sensitive yet practical short read mapping. Bioinformatics. 2011;27(7):1011–1012. doi: 10.1093/bioinformatics/btr046. [DOI] [PubMed] [Google Scholar]
- Alkan C, Kidd JM, Marques-Bonet T, Aksay G, Antonacci F. et al. Personalized copy number and segmental duplication maps using next-generation sequencing. Nat Genet. 2009;41(10):1061–1067. doi: 10.1038/ng.437. [DOI] [PMC free article] [PubMed] [Google Scholar]
- Mu JC, Jiang H, Kiani A, Mohiyuddin M, Asadi NB, Wong WH. Fast and accurate read alignment for resequencing. Bioinformatics. 2012;28(18):2366–2373. doi: 10.1093/bioinformatics/bts450. [DOI] [PMC free article] [PubMed] [Google Scholar]
- Rizk G, Lavenier D. GASSST: global alignment short sequence search tool. Bioinformatics. 2010;26(20):2534–2540. doi: 10.1093/bioinformatics/btq485. [DOI] [PMC free article] [PubMed] [Google Scholar]
- Langmead B, Salzberg SL. Fast gapped-read alignment with bowtie 2. Nat Methods. 2012;9(4):357–359. doi: 10.1038/nmeth.1923. [DOI] [PMC free article] [PubMed] [Google Scholar]
- Li H, Durbin R. Fast and accurate long-read alignment with burrows-wheeler transform. Bioinformatics. 2010;26(5):589–595. doi: 10.1093/bioinformatics/btp698. [DOI] [PMC free article] [PubMed] [Google Scholar]
- Li R, Li Y, Kristiansen K, Wang J. SOAP: short oligonucleotide alignment program. Bioinformatics. 2008;24(5):713–714. doi: 10.1093/bioinformatics/btn025. [DOI] [PubMed] [Google Scholar]
- Liu Y, Schmidt B. Long read alignment based on maximal exact match seeds. Bioinformatics. 2012;28(18):318–324. doi: 10.1093/bioinformatics/bts414. [DOI] [PMC free article] [PubMed] [Google Scholar]
- Siragusa E, Weese D, Reinert K. Fast and accurate read mapping with approximate seeds and multiple backtracking. Nucleic Acids Res. 2013;41(7):e78. doi: 10.1093/nar/gkt005. [DOI] [PMC free article] [PubMed] [Google Scholar]
- Ponstingl H, Ning Z. SMALT-a new mapper for DNA sequencing reads. F1000 Posters. 2010;1:313. [Google Scholar]
- Yu X, Guda K, Willis J, Veigl M, Wang Z, Markowitz MD. et al. How do alignment programs perform on sequencing data with varying qualities and from repetitive regions? BioData Min. 2012;5(1):6. doi: 10.1186/1756-0381-5-6. [DOI] [PMC free article] [PubMed] [Google Scholar]
- Becher V, Heiber PA. A linearly computable measure of string complexity. Theoretical Computer Science. 2012;438:62–73. [Google Scholar]
- Chor B, Horn D, Goldman N, Levy T, Massingham T. Genomic DNA k-mer spectra: models and modalities. Genome Biology. 2009;10(10):R108. doi: 10.1186/gb-2009-10-10-r108. [DOI] [PMC free article] [PubMed] [Google Scholar]
- Kurtz S, Narechania A, Stein JC, Ware D. A new method to compute k-mer frequencies and its application to annotate large repetitive plant genomes. BMC Genomics. 2008;9:517. doi: 10.1186/1471-2164-9-517. [DOI] [PMC free article] [PubMed] [Google Scholar]
- Whiteford NE, Haslam NJ, Weber G, Prugel-Bennett A, Essex JW, Neylon C. et al. Visualizing the repeat structure of genomic sequences. Complex Systems. 2008;17(4):381–398. [Google Scholar]
- Kärkkäinen J, Sanders P, Burkhardt S. Linear work suffix array construction. J ACM. 2006;53(6):918–936. [Google Scholar]
- Kasai T, Lee G, Arimura H, Arikawa S, Park K. Linear-time longest-common-prefix computation in suffix arrays and its applications. Proceedings of the 12th Annual Symposium on Combinatorial Pattern Matching Lecture Notes in Computer Science. 2001. pp. 181–192.
- Li H, Handsaker B, Wysoker A, Fennell T, Ruan J, Homer N. et al. The sequence alignment/map format and samtools. Bioinformatics. 2009;25(16):2078–2079. doi: 10.1093/bioinformatics/btp352. [DOI] [PMC free article] [PubMed] [Google Scholar]
- Peterlongo P, Sacomoto GA, do Lago AP, Pisanti N, Sagot MF. Lossless filter for multiple repeats with bounded edit distance. Algorithms Mol Biol. 2009;4:3. doi: 10.1186/1748-7188-4-3. [DOI] [PMC free article] [PubMed] [Google Scholar]
- Li H, Homer N. A survey of sequence alignment algorithms for next-generation sequencing. Briefings in Bioinformatics. 2010;11(5):473–483. doi: 10.1093/bib/bbq015. [DOI] [PMC free article] [PubMed] [Google Scholar]


