

Erratum
The original version of this article [1] unfortunately contained several mistakes. The presentation of Table 2 and 3 was incorrect, in the HTML and PDF versions of this article. The corrected Tables 2 and 3 are given below.
Table 2.
Primary antibody information
| Western Blots | ||||
| ANTIBODY | COMPANY | CODE | Dilution | |
| PHF1 | Peter Davies | 1:500 | ||
| Tau13 | Covance | MMS-520R-500 | 1:2000 | |
| GAPDH | Abcam, | Ab8245 | 1:2000 | |
| Beta-actin | Abcam | Ab8226 | 1:2000 | |
| Synaptophysin | Abcam | Ab8049 | 1:5000 | |
| Beta-III-tubulin | Abcam | Ab18207 | 1:1000 | |
| MBP | AbD Serotec | MCA409s | 1:500 | |
| Histone | Abcam | Ab1791 | 1:1000 | |
| VDAC1/Porin | Abcam | Ab34726 | 1:500 | |
| GluN2B | BD Biosciences | 610416 | 1:500 | |
| Synapsin | Millipore | AB1543P | 1:20000 | |
| Neuropathology | ||||
| ANTIBODY | COMPANY | CODE | Dilution | Pre-treatment |
| Beta Amyloid (BA4) | Dako | M087201-2 | 1:100 | 98% formic acid 5 min |
| Alpha Synuclein | Life Technologies | 32-8100 | 1:200 | Pressure cooker/formic acid |
| TDP-43 | 2B Scientific | CAC-TIP-PTD-MO1 | 1:4000 | Pressure cooker/citric acid |
| pTau (AT8) | Thermo | MN1020 | 1:2500 | None |
| Ubiquitin | Dako | Z0458 | 1:500 | Pressure cooker/citric acid |
| GFAP | Dako | Z0334 | 1:800 | None |
| CD68 | Dako | M0876 | 1:100 | Pressure cooker/citric acid |
| Array Tomography | ||||
| ANTIBODY | COMPANY | CODE | Dilution | Secondary Antibody |
| AW7 | Dominic Walsh | 1:1000 | Donkey α Rabbit – AF488 | |
| Synaptophysin | Abcam | Ab8049 | 1:50 | Donkey α Mouse – AF594 |
| ApoE | Abcam | Ab7620 | 1:50 | Donkey α Goat – AF647 |
| PSD95 | Abcam | Ac12093 | 1:50 | Donkey α Goat – AF488 |
Table 3.
Semi-quantitative scoring of neuropathological markers
| LBC | AD | LBC | AD | ||||
|---|---|---|---|---|---|---|---|
| Region | Stain | Score | Region | Stain | Score | ||
| BA9 | TDP43 | - | ++ | BA41/42 | TDP43 | - | + |
| pTAU | - | +++ | pTAU | - | +++ | ||
| BA4 | + | +++ | BA4 | + | +++ | ||
| a-Syn | - | - | a-Syn | - | - | ||
| GFAP | + | +++ | GFAP | ++ | +++ | ||
| CD68 | + | +++ | CD68 | + | + | ||
| UBIQ | + | +++ | UBIQ | + | +++ | ||
| BA44/45 | TDP43 | + | + | EC | TDP43 | + | ++ |
| pTAU | - | +++ | pTAU | + | +++ | ||
| BA4 | - | +++ | BA4 | ++ | +++ | ||
| a-Syn | - | - | a-Syn | - | - | ||
| GFAP | + | ++ | GFAP | + | +++ | ||
| CD68 | ++ | ++ | CD68 | + | ++ | ||
| UBIQ | + | +++ | UBIQ | ++ | +++ | ||
| BA46 | TDP43 | + | ++ | BA17 | TDP43 | + | ++ |
| pTAU | - | +++ | pTAU | - | +++ | ||
| BA4 | - | +++ | BA4 | + | +++ | ||
| a-Syn | - | - | a-Syn | - | - | ||
| GFAP | + | ++ | GFAP | + | +++ | ||
| CD68 | + | ++ | CD68 | + | + | ||
| UBIQ | + | +++ | UBIQ | + | +++ | ||
| BA6/8 | TDP43 | + | ++ | BA24 | TDP43 | + | ++ |
| pTAU | - | +++ | pTAU | - | +++ | ||
| BA4 | + | +++ | BA4 | - | +++ | ||
| a-Syn | - | - | a-Syn | - | - | ||
| GFAP | + | +++ | GFAP | + | ++ | ||
| CD68 | + | +++ | CD68 | + | ++ | ||
| UBIQ | + | +++ | UBIQ | + | +++ | ||
BA9 = Prefrontal cortex, BA44/45 = Broca’s area, BA46 = Dorsolateral Prefrontal cortex, BA6/8 = Premotor cortex, BA41/42 = Superior Temporal cortex, EC = Entorhinal cortex, BA17 = Primary Visual cortex, BA24 = Anterior Cingulate cortex. “-” = no pathology, “+” = mild pathology, “++” = moderate pathology, “+++” = strong pathology. Example images for each score are found in Supplementary Figure 2.
In addition, Fig. 9 was presented incorrectly, in that the label on panel 9D should read “Post-Synapse Volume”. The correct version of Fig. 9 is also provided below.
Fig. 9.
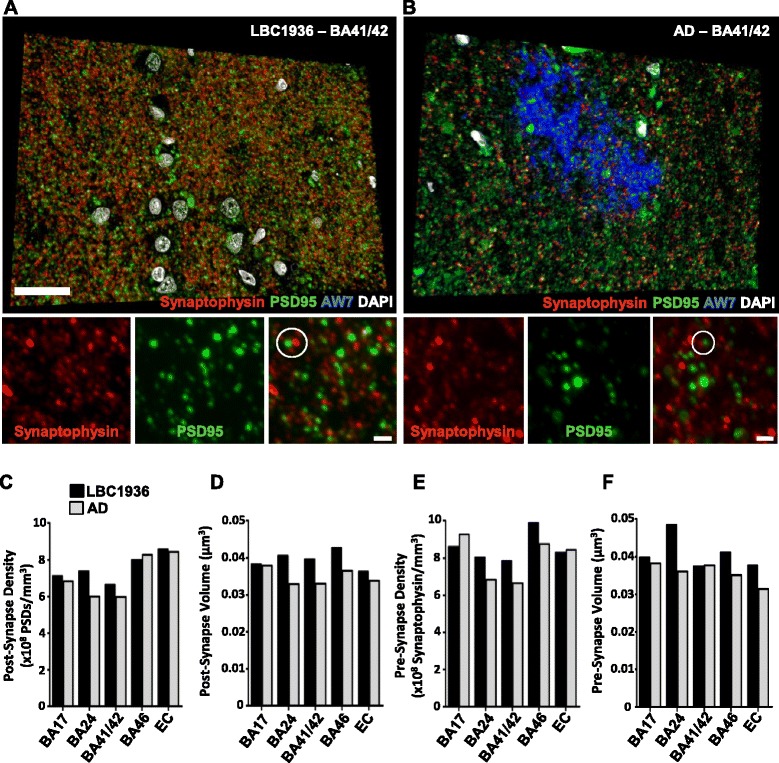
Using array tomography to assess the presence of synaptotoxic proteins. Representative images from a single region of interest (crop) captured within the LBC1936 EC (A+C) or the AD EC (B+D). Each image is a single plane from a 3D stack, which has been thresholded/binarised and single-slice objects removed to eliminate background. Sections were stained for synaptophysin, PSD95, and AW7 (A+B) or ApoE (C+D). Synaptically located staining is highlighted with white circles. C. Scale bar = 2μm.
The Conclusions and Authors Contributions sections also contain a number of typing and spacing errors that have been updated. Please see the corrected text provided below.
Lastly, the reference list has been updated to include all named authors up to the first 30.
The original article has been updated to reflect all the above changes.
Footnotes
Ian J. Deary and Tara L. Spires-Jones contributed equally to this work.
The online version of the original article can be found under doi:10.1186/s40478-015-0232-0.
Contributor Information
Ian J. Deary, Phone: +44(0)131 6503452, Email: I.Deary@ed.ac.uk
Tara L. Spires-Jones, Email: Tara.spires-jones@ed.ac.uk
Reference
- 1.Henstridge CM, Jackson RJ, Kim JSM, Herrmann AG, Wright AK, Harris SE, Bastin ME, Starr JM, Joanna W, Gillingwater TH, Colin S, Chris-Anne MK, Cox SR, Deary IJ, Spires-Jones TL, et al. Post-mortem brain analyses of the Lothian Birth Cohort 1936: extending lifetime cognitive and brain phenotyping to the level of the synapse. Acta Neuropathologica Communications. 2015;3:53. doi: 10.1186/s40478-015-0232-0. [DOI] [PMC free article] [PubMed] [Google Scholar]