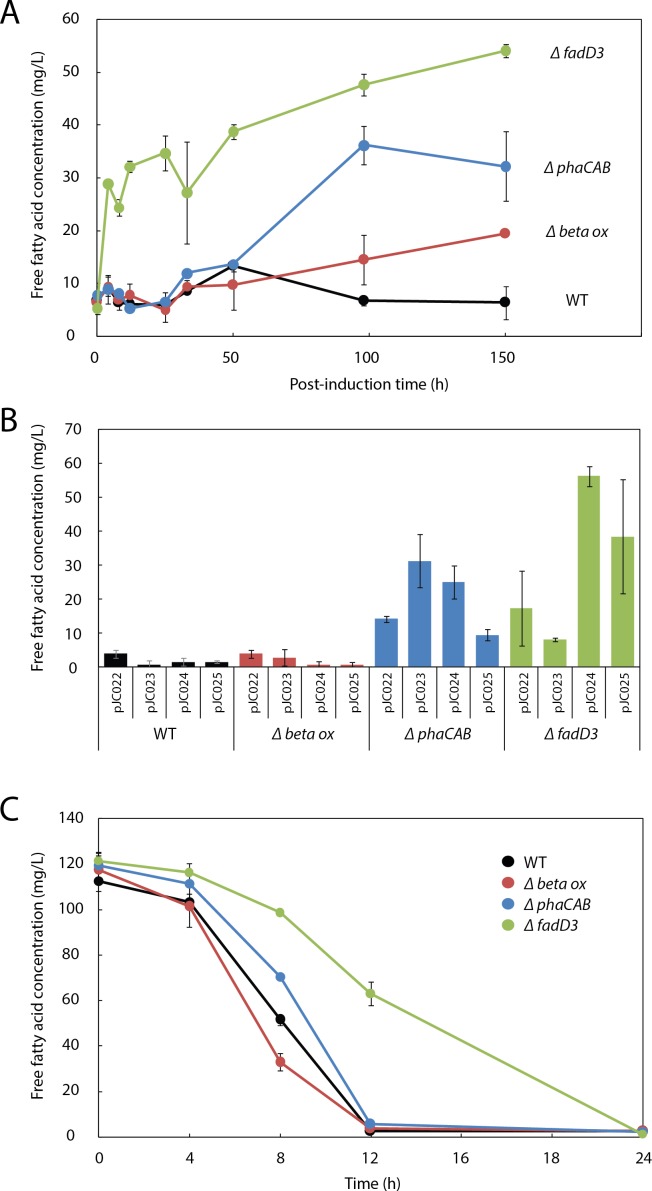
Figure 3. β-oxidation limits fatty acid yield in engineered R. eutropha.
(A) Time course of free fatty acid (FFA) production by different R. eutropha mutants in RB following arabinose induction (0 h time point). (B) Total FFA production at 24 h as a function of genetic background and UcFatB2 expression plasmid; each plasmid has a different RBS and predicted expression strength. (C) Time course of fatty acid uptake by R. eutropha of different genetic backgrounds incubated with 120 mg/L lauric acid in RB. For all experiments in this figure, FFA concentration was measured using the fatty acid half-micro assay (Methods), and error bars represent S.E.M. for N ≥ 3 independent experiments.

