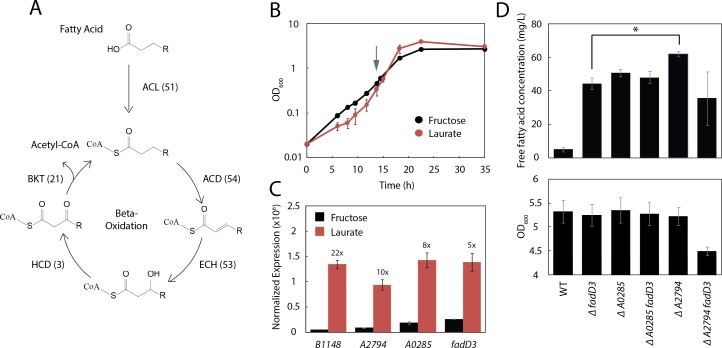
Figure 4. Three additional acyl-CoA ligases limit FFA yield.
(A) Schematic diagram of β-oxidation in R. eutropha. The first enzymatic step of β-oxidation is carried out by an acyl-CoA ligase (ACL) followed by an acyl-CoA dehydrogenase (ACD), enoyl-CoA hydratase (ECH), 3-hydroxyacyl-CoA dehydrogenase (HCD) and β-ketoacyl-CoA thiolase (BKT). Each β-oxidation gene has multiple annotated homologues in the R. eutropha genome (number indicated in parentheses). (B) Time course of Re2061 growth on fructose or laurate minimal medium. Error bars represent S.E.M. from N = 3 independent experiments. The grey arrow indicates the point at which cultures were sampled for RNA-Seq analysis. (C) Expression levels of four acyl-CoA ligases upregulated during growth on laurate, measured by RNA-Seq and normalized by the upper quartile method (Methods). Numbers above bars indicate fold-increase in laurate media as compared to fructose media. Error bars represent S.E.M. of the normalized expression levels for three independent experiments. Differences in expression between fructose and laurate conditions are significant for all four genes after correcting for multiple hypothesis testing (q-value < 0.001). (D) Total FFA production 96 h after arabinose induction by R. eutropha knockout mutants, as measured by the fatty acid half-micro assay (top). OD600 96 h after induction for each mutant. Error bars represent S.E.M. from N = 4 independent experiments in both panels. ∗ indicates a significant difference in mean FFA production with p < 0.05, evaluated using the one-tailed student’s t-test.

