Abstract
Articular cartilage has a limited healing capacity that complicates the treatment of joint injuries and osteoarthritis. Newer repair strategies have focused on the use of cells and biomaterials to promote cartilage regeneration. In the present study, we developed and characterized bioinspired materials designed to mimic the composition of the cartilage extracellular matrix. Chondroitin sulfate (CS) and chitosan (CH) were used to form physically cross-linked macromolecular polyelectrolyte complexes (PEC) without the use of additional crosslinkers. A single-step water-in-oil emulsification process was used to either directly embed mesenchymal stem cells (MSC) in PEC particles created with a various concentrations of CS and CH, or to co-embed MSC with PEC in agarose-based microbeads. Direct embedding of MSC in PEC resulted in high cell viability but irregular and large particles. Co-embedding of PEC particles with MSC in agarose (Ag) resulted in uniform microbeads 80–90 μm in diameter that maintained high cell viability over three weeks in culture. Increased serum content resulted in more uniform PEC distribution within the microbead matrix, and both high and low CS:CH ratios resulted in more homogeneous microbeads than 1:1 formulations. Under chondrogenic conditions, expression of sulfated GAG and collagen type II was increased in 10:1 CS:CH PEC-Ag microbeads compared to pure Ag beads, indicating a chondrogenic influence of the PEC component. Such PEC-Ag microbeads may have utility in the directed differentiation and delivery of progenitor cell populations for cartilage repair.
Introduction
The limited healing capacity of articular cartilage leads to poor outcomes for sufferers of joint injuries or diseases such as osteoarthritis.1 The current standard of care for articular cartilage repair is microfracture, a surgical procedure to create fissures in the bone beneath cartilage defects, allowing blood and marrow cells to fill the defect. However, the resulting neotissue is fibrocartilaginous rather than hyaline, and is prone to degradation after 1.5–2 years.2 As an alternative treatment, autologous chondrocyte implantation has had a clinical impact, but is limited by procedural complexity, long recovery times, donor site morbidity, and the limited numbers of chondrocytes that can be harvested from native cartilage. 2 The lack of a sufficient autologous cell source has led to a focus on the use of culture-expanded progenitor cells, such as mesenchymal stromal cells (MSC), for generating a cell population on the scale required for cartilage defect repair.3
The promotion and maintenance of a chondrogenic phenotype is challenging in vitro, where standard monolayer culture techniques can lead to adhesion-mediated cell dedifferentiation.4 In contrast, a three-dimensional (3D) culture system has been shown to facilitate chondrogenesis in culture, which reflects the key role the extracellular matrix (ECM) plays in regulating chondrocytic differentiation in vivo.5 As the structure and composition of the surrounding ECM is critical for promoting and maintaining the chondrocyte phenotype, the use of biomaterials that mimic key components of the cartilage matrix is important for the fostering of chondrogenesis in a 3D culture system.6
One of the main components of the native cartilage matrix is the proteoglycan aggrecan, which is largely composed of the sulfated glycosaminoglycan (GAG) chondroitin sulfate (CS).7 CS has been shown to directly influence cell homeostasis and can support chondrogenic differentiation of MSC when incorporated into tissue engineering scaffolds.8,9,32 However, CS is water soluble, and methods to gel or otherwise contain it within a scaffold usually require the use of crosslinking reagents with varying degrees of cytotoxicity.10
Chitosan (CH) is a polysaccharide derived from the deacetylation of chitin, a material found in the shells of crustaceans and the cell walls of fungi.11 Its biocompatibility, natural abundance, and lysozymal degradability make CH an attractive material for biomedical applications.12 Often cross-linked using glyoxal or glutaraldehyde, chitosan has been investigated as a bioadhesive, drug delivery vehicle and bone repair matrix.13,14 Moreover, as a linear polysaccharide, its chemical similarity to a GAG 15 makes CH well suited to applications in cartilage repair.6,13
When CS and CH solutions are mixed within an appropriate pH range, a stable polyelectrolyte complex (PEC) forms.16 This process occurs in the interval between the pKa of CH (~6.5) and CS (~2.6), within which the CH amine groups and CS sulfate groups are positively and negatively charged, respectively.17 PEC generation is rapid and does not require additional crosslinkers or initiators.10 Though the PEC forms under acidic conditions, the resulting hydrogel is stable at physiologic pH 16 with a gradual release of CS due to pH-dependent swelling.17 Incorporation into a CS-CH PEC also helps shield CS from degradation by chondroitinases.18
CS-CH PEC has been investigated as a chondrogenic material. Denuziere et al. found that PEC films supported the growth of rabbit chondrocytes.18 Sechriest and coworkers reported that, compared to polystyrene alone, bovine chondrocytes cultured on CS-CH surfaces retained a rounded morphology, exhibited a lowered mitotic rate and produced more collagen type II, indicative of a chondrocytic phenotype.6 Similarly, CS and CH-coated alginate microbeads were found to enhance chondrogenic markers in human MSC in culture.8 In addition, Silva et al. observed that CS-CH scaffolds maintained the phenotype of bovine chondrocytes and differentiated human MSC after culturing in chondrogenic medium.19
In the present study, we sought to harness the biomimetic properties of CS-CH PEC materials to develop a cell-based therapy for cartilage regeneration. Our goal was to create a cell encapsulation and delivery method that required minimal processing, and which produced 3D modular microtissues that maintained cell viability and fostered chondrogenic differentiation of embedded MSC. We used rat bone marrow-derived MSC due to their demonstrated ability to differentiate toward the chondrocyte phenotype in vitro when cultured in biomaterial scaffolds.20 This paper therefore reflects the theme of this special issue of the Journal of Materials Chemistry B on bio-inspired and natural materials, in that it reports on matrices that are self-assembled and biologically active, and which can be applied to biology and medicine. In particular, the CS-CH PEC microbeads described here may have utility in achieving more consistent MSC differentiation, as well as in facilitating minimally-invasive delivery of cells for cartilage repair.
Experimental
Biopolymers and other materials
Chitosan (>90% deacetylated, UP B 90/500, Novamatrix, Sandvika, Norway) was prepared by suspending in distilled water and autoclaving. Acetic acid was then added to the suspension to dissolve the chitosan (final concentrations: 1 wt% chitosan, 0.1 N acetic acid). A 2 wt% stock solution of chondroitin sulfate A (C9819, Sigma-Aldrich, St. Louis, MO) was prepared in distilled water and sterile-filtered. Low melting temperature agarose (BP1360, Fisher Scientific, Pittsburgh, PA) was dissolved in distilled water at 2 wt%, sterile filtered and aliquoted.
Complete medium consisted of αMEM, 10 % fetal bovine serum and 1 % penicillin/streptavidin (Gibco/Life Technologies, Grand Island, NY). Control medium (CON) was made from DMEM (4.5 g/l), 1 % pen-strep, 1 % ITS+ (BD Biosciences, San Jose, CA), 0.35 mM L-proline (Sigma) and 0.2 mM L-ascorbic acid 2-phosphate (Sigma). Chondrogenic medium (CDT) was made by adding 10 nM dexamethasone (Sigma) and 10ng/ml recombinant human TGF-β1 (Peprotech, Rocky Hill, NJ). Microbead production medium consisted of αMEM (Gibco) buffered with 0.35g/L sodium bicarbonate.
Emulsification to produce microbeads was carried out in 100 cSt polydimethylsiloxane (PDMS) silicone oil (Clearco Products Co, Inc. Bensalem, PA).
The reagents for immunohistochemistry were Tris buffered saline (TBS, 0.05 M Tris) and TBS + 0.025 % Triton X-100 (TBS-T). Enyzmatic antigen retrieval was done using chondroitinase (Sigma). The primary antibody was mouse anti-collagen type II (II-II6B3, Developmental Studies Hybidoma Bank, Iowa City, IA). A FITC-conjugated goat anti-mouse antibody served as a secondary (M31001, Life Technologies/Fisher Scientific). Cell nuclei were counterstained using DAPI dilactate (D3571, Life Technologies/Fisher Scientific).
Cell culture
Bone marrow mesenchymal stromal cells (MSC) from 6-month old Fischer rats were harvested and cultured as described previously.14 For long term storage, cells were detached using 0.25 % Trypsin-EDTA (Gibco), resuspended in 40 % FBS, 10 % dimethylsulfoxide and 50 % αMEM, and frozen in liquid nitrogen. When required, MSC were quick-thawed and expanded in complete medium on T-225 flasks. Cells were released with 0.25 % Trypsin-EDTA (Gibco), resuspended in culture medium and counted using an automated cell counter (Multisizer 3, Beckman Coulter, Brea, CA).
Production of PEC particles
Chondroitin sulfate (CS), chitosan (CH) and passage 3 MSC in complete medium were simultaneously combined in 75 ml PDMS at 37 °C and mixed for 30 min with an impeller driven at 1500 rpm (Fig. 1). Mass ratios of 1:2, 1:1 and 2:1 CS:CH were used, with a cell density of 5×10⁵ per ml of liquid components. CS and CH were kept in separate barrels of a dual syringe until mixing was carried out. The result was cell-encapsulating PEC particles several hundred microns in size. After mixing, particles were separated from the oil phase via washing and gentle centrifugation (200g) in PBS followed by complete medium. Particles were then resuspended in complete medium and then aliquoted into vented conical tubes. Media were replaced every 3–4 days.
Figure 1.
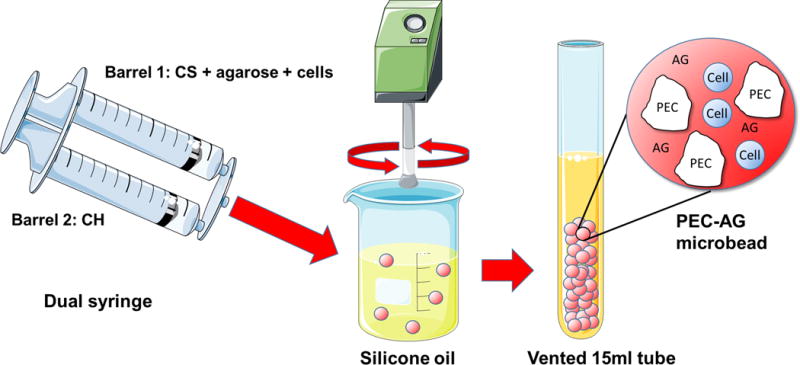
Schematic of one step PEC-Ag bead fabrication, showing CS and CH introduction into a polydimethylsiloxane (PDMS) oil bath using a double-barreled syringe, and subsequent collection of the formed PEC microparticles and PEC-Ag microbeads. Particles or beads are separated from the oil phase via repeated washing and centrifugation in PBS and culture medium. Some images adapted from Servier Medical Arts clipart (www.servier.com).
Production of PEC-Agarose microbeads
PEC-Ag microbeads were prepared by combining CS, CH, melted agarose, microbead production medium, FBS (10–40 % by volume), 0.2 N acetic acid and day 7, P4 MSC (1.7×10⁵ cells/ml of aqueous components) in 75 ml PDMS (Fig.1). Mixing was performed at 800 rpm for 5 min at 37 °C, and then for an additional 25 min on ice to complete agarose gelation. CS and CH solutions were kept in separate barrels of a dual syringe and then injected into the PDMS through a 25 gauge needle. The CS:CH mass ratios were 1:2, 1:1 and 2:1, while a PEC:Ag mass ratio of 35%:65% (10.5 mg:19.5 mg) was used. Pure agarose microbeads were also prepared. These formulations contained 0.2 N acetic acid sufficient to lower pH to 6.0 for the duration of mixing. After mixing and washing in complete medium, the microbead suspensions were aliquoted in vented conical tubes.
Microbead diameter was determined using brightfield images taken at 10× magnification. Image analysis software (ImageJ, National Institutes of Health, Bethesda, MD) was used to bound each microbead with a rectangular region of interest, and the maximum horizontal and vertical dimensions were measured. Microbead diameter was calculated as the mean of these orthogonal dimensions.
Chondrogenesis in PEC-Agarose microbeads
PEC-Ag microbeads were prepared as described above with P3 MSC and a 700 rpm mixing speed (Fig. 1). CS:CH mass ratios were 10:1 and 1:10 (9×10⁵ cells/ml). Pure agarose microbeads were also prepared. Microbeads were cultured in either control or chondrogenic medium for 21 days. Partial medium exchanges were performed every 3–4 days to prevent microbead loss. Cell-only micromasses were used as positive controls and were generated as previously described.21 Briefly, 2.5×10⁵ cells were suspended in medium and pelleted at 600 g for 5 min. Spherical micromasses were apparent within 24–48 hours.
Assessment of cell viability
Viability was assessed using a fluorescent Live/Dead® assay (L-3224, Life Technologies), in which live and dead cells were stained with 4μM calcein-AM and 4μM ethidium bromide in PBS, respectively. After staining, the microbead suspension was imaged using a Fluoview 500 laser scanning confocal microscope with a 20 μm z-resolution (Olympus America, Center Valley, PA). Live and dead cells were visualized using 490 nm excitation/520 nm emission and 530nm/615nm filter sets, respectively. Cell numbers were determined using the particle counter function within ImageJ software. Cells positive for both stains were considered to have been alive at the beginning of the assay.
Quantification of collagen type II protein expression
Collagen type II content of PEC-only particles was measured using a commercial ELISA kit (MD Bioproducts, St. Paul, MN) as per the manufacturer’s instructions. Briefly, PEC particles were digested in 10 mg/ml pepsin (Sigma) in 0.05 M acetic acid for 2 days, then in 1 mg/ml elastin in TBS (Worthington, Biochemical Corp., Lakewood, NJ) for 1 day. All sample were diluted 1:2 in assay buffer and measured in duplicate.
Histology and immunohistochemistry
Samples were washed in PBS, fixed for 1 h in buffered zinc formalin (Z-Fix, Anatech Ltd, Battle Creek, MI) and embedded in gel disks (0.4 wt% final collagen I concentration). Disks were then fixed in zinc formalin for 2 h, embedded in paraffin, and 5 μm sections taken. Sulfated and neutral mucins were visualized using an Alcian-Periodic Acid Schiff staining kit (Poly Scientific R&D Corp, Bay Shore, NY) as per the manufacturer’s instructions.
For collagen type II immunohistochemistry, sections were dewaxed in xylene and gradually hydrated in ethanol and water. Permeabilization was performed with two immersions in TBS-T for 5 min each. Next, enzymatic antigen retrieval was carried out by exposing the sections to 0.05 U/ml chondroitinase in PBS for 30 min at 37 °C. After blocking for 1.5 h in TBS containing 10 % FBS and 1 % BSA, sections were incubated in the primary antibody (2 μg/ml in TBS with 1 % BSA) for 1 h at room temperature with a subsequent incubation in the secondary antibody (2.5 μg/ml in TBS with 1 % BSA) for the same duration. Negative control slides received the secondary antibody only. To counterstain cell nuclei, sections were stained in DAPI dilactate (300 nm in PBS) for 2 min.
Statistical analysis
One-way ANOVA with Dunnett’s T3 post-hoc test was performed using SPSS software (IBM, Armonk, NY). Assays were performed in triplicate, with multiple measurements taken for each replicate.
Results and Discussion
Fabrication of PEC particles and their effect on chondrogenesis
In the first phase of this study, cell-encapsulating CS-CH PEC particles were generated and cultured in both control (CON) and control + dexamethasone + TGF-β1 (CDT) media. The resulting particles are shown in Fig. 2A over time in culture. The emulsification of CS, CH, cells, and medium in PDMS resulted in the rapid formation of irregularly-shaped particles of PEC ranging from approximately 100 to 1000 μm in diameter. Cells embedded directly inside the PEC matrix maintained a rounded morphology in all formulations and media types over the three-week culture period, a prerequisite for chondrocytic differentiation.6 Cell viability, shown in Fig. 2B, was above 75% in all treatments and time points, but was considerably lower in the 1:1 CS:CH formulations, compared to the 1:2 and 2:1 formulations. Over time in culture, the 1:2 and 2:1 CS:CH formulations exhibited over 90 % cell viability, whereas by day 21 the viability in the 1:1 formulation had dropped to below 80 %. There was no statistically significant effect of medium type on cell viability in any of the formulations or time points.
Figure 2.
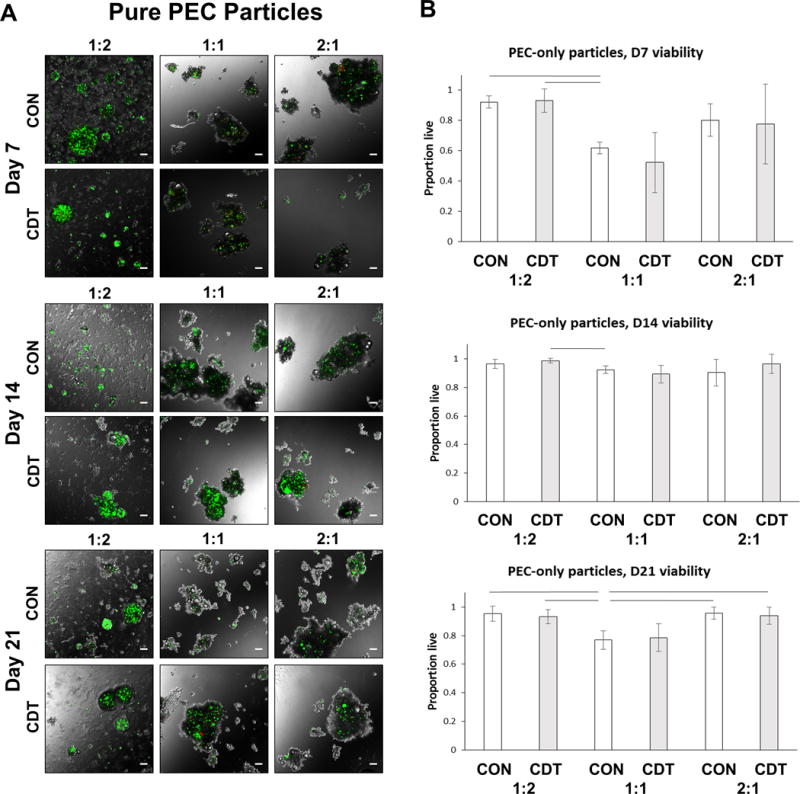
A) Overlays of fluorescence and phase contrast images of pure PEC particles containing MSC at 7, 14 and 21 days in control (CON) or chondrogenic (CDT) media. Cell-containing particles were several hundred microns in length and non-spherical. Cells retained a rounded morphology. Green=live cells, red=dead cells. Scale bar = 100 μm. B) Quantitation of MSC viability in PEC particles. Viability was greater than 75% in all groups by Day 14, but generally lower in the 1:1 CS:CH mass ratio formulation. Lines indicate p<=0.05.
Collagen type II is a marker of chondrogenic differentiation and was assessed in day 21 samples, as shown in Figure 3. Digestion of the PEC particles and measurement using ELISA (Fig. 3A) showed statistically significantly greater collagen type II deposition in 1:2 CS:CH particles cultured in CON and CDT media compared to the other formulations (p<0.05), except the 1:1 CDT group. Van Gieson’s Acid Fuchsin staining was used to visualize total collagen content (Fig. 3B), and was found to qualitatively correspond to the ELISA results. Neither collagen type II expression nor total collagen content were altered significantly with the use of CDT medium.
Figure 3.
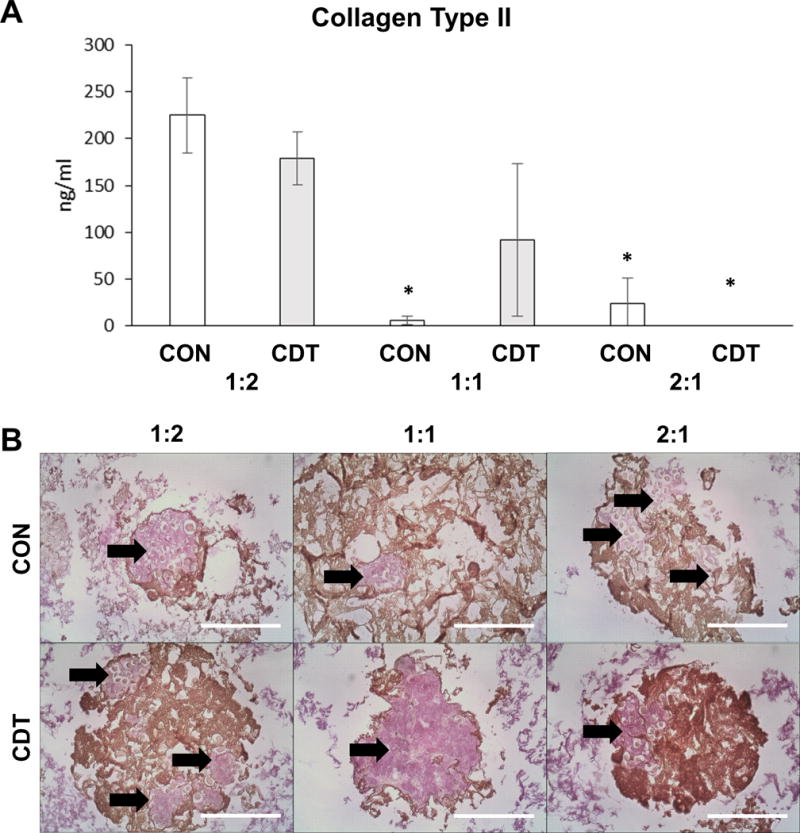
Chondrogenic differentiation of MSC embedded in pure PEC particles at 21 days. (A) Collagen type II detected by ELISA assay. Collagen type II was detected in both the 1:2 and 1:1 formulations. Medium supplementation did not make a significant different in Collagen type II production in the 1:2 and 2:1 formulations. * for p<=0.05 compared to 1:2 with either treatment. (B) Total collagen content visualized via Van Gieson’s Acid Fuchsin (arrows). The extent of Acid Fuchsin staining qualitatively corresponded to the results of the Collagen type II ELISA. Brown regions are PEC. Scale bar = 200 μm.
Our initial approach using CS-CH PEC particles to encapsulate cells served as a proof of concept for these materials to support cell viability, maintain a rounded morphology, and allow chondrogenesis. These results are in agreement with previous studies demonstrating that harvested chondrocytes stay spherical when cultured on CS-CH PEC surfaces.6 However, the rapid formation of the PEC during mixing produced a suspension rather than a true water-in-oil emulsion, resulting in PEC particles of inconsistent shape and size. PEC made with a 1:2 CS:CH mass ratio yielded a considerable number of smaller particles, probably composed of unbound chitosan, in which cells could not be encapsulated. The consistently lower MSC viability in 1:1 CS:CH PEC could have been a result of the lower mixing pH (compared to the 2:1) and larger particle size (compared to the 1:2) that may have limited diffusion.
Fabrication of PEC-Agarose microbeads
The PEC-only particles were generally large and inconsistent in size, and exhibited a negative effect on cell viability in the 1:1 CS:CH formulation. Previous work has demonstrated that the polysaccharide agarose can be used to form uniform microbeads via water-in-oil emulsification24 and can maintain cell viability and chondrocytic differentiation.25 Therefore, in the second phase of this study, CS-CH PEC particles were co-embedded with MSC in agarose (Ag) microbeads in a single-step mixing and emulsification process. As with the pure PEC particles, CS:CH mass ratios of 1:2, 1:1 and 2:1 were used, and the mixing pH was set to 6.0 for all formulations, below the pKa of chitosan (~6.5). A PEC:Ag mass ratio of 35:65% was chosen based on previous work on the fabrication of collagen-agarose microbeads.24 Pure agarose microbeads were produced as controls.
The PEC-Ag microbeads that were produced were spherical and generally uniform in composition (Fig. 4A). Cells were successfully encapsulated, though some larger PEC particles remained unincorporated in microbeads. As with pure PEC particles, cell morphology in PEC-Ag and Ag-only microbeads remained highly rounded. The average microbead diameter was 70–80 μm (Fig. 4B), and microbeads generally ranged in size from 40–120 μm in diameter. Microbead diameter and size distributions are inversely proportional to the mixing speed used during emulsification. A low mixing speed (700rpm) was used to produce a mean bead diameter large enough for cell and PEC encapsulation. Cell viability (Fig. 4C) was greater than 80 % in all groups at all time points, and was greater than 90% in all groups by day 14, with no significant differences across formulations at any time point.
Figure 4.
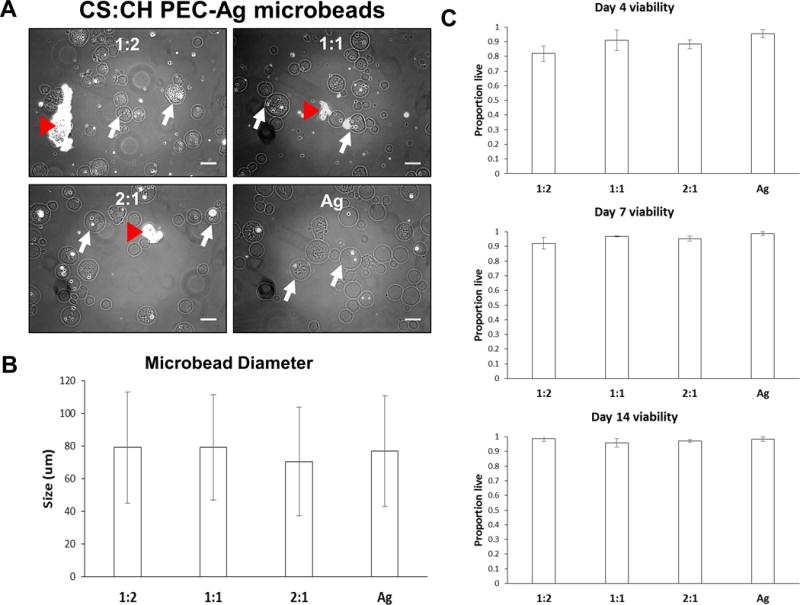
Spherical PEC-Ag microbeads made with 1:2, 1:1 and 2:1 CS:CH mass ratios. Pure agarose microbeads were also produced for comparison. A) Brightfield images of microbeads taken at day 10. Representative microbeads indicated with white arrow. Substantial incorporation of cells and small PEC particles was observed, though some larger PEC particles were not encapsulated. As with PEC-only particles, cells encapsulated in PEC-Ag microbeads retained a rounded morphology due to a lack of cell adhesion sites in the constituent materials. B) Mean microbead diameters were 70–80μm and did not vary significantly across formulations. Microbead diameter and size distributions are inversely proportional to the mixing speed used during emulsification. A low mixing speed (700rpm) was used to produce a mean bead diameter large enough for cell and PEC encapsulation. C) Quantification of viability of MSC embedded in microbeads. Cell viability within PEC-Ag microbeads was improved compared to PEC particles alone (see Fig.2). Scale bar = 100 μm.
The use of agarose allowed the incorporation of CS-CH PEC particles into non-aggregating spherical microbeads of smaller size and of a narrower size distribution compared to the pure PEC particles. The PEC-agarose material also resulted in improved cell viability, while maintaining the rounded cell morphology that is associated with chondrogenesis. Therefore the use of PEC-Ag microbeads demonstrated promise in creating a modular chondrogenic microenvironment.
Optimization of PEC-Agarose microbead formulations
In order to improve the efficiency and uniformity of PEC incorporation into agarose-based microbeads, the next phase of this study examined the effect of FBS concentration and CS:CH ratio on the resultant PEC-Ag materials. FBS was included during bead production to sustain cell viability14, and also because it has surfactant properties that promote emulsification. The CS:CH ratio was varied beyond the initial range in an effort to produce a more a homogenous distribution of matrix within the microbeads.
The effect of FBS on PEC incorporation was examined by preparing 2:1 CS:CH PEC-Ag microbeads using FBS volumes from 10 to 40 % of the total initial microbead mixture volume. As shown in Figure 5A, higher proportions of FBS resulted in smaller PEC particles that were more uniformly incorporated into agarose-based microbeads. As a complex protein mixture, FBS can also act as a surfactant, with surface wetting and concomitant micelle stabilizing capacities.26 These surfactant properties allowed the formation of finer PEC particles, which could be more homogenously distributed in the agarose matrix. We initially attributed the surfactant properties of FBS to its albumen content, which comprises approximately 60% of serum protein mass.27 However, addition of equivalent concentrations of bovine serum albumin alone did not result in a similar degree of PEC incorporation into agarose microbeads (Supplemental Fig.1). Use of serum to produce microbeads increases production cost, however we have demonstrated that FBS can substitute for chemical surfactants that may compromise cell viability, and in previous work with encapsulation of MSC we have shown that FBS sustains cell viability during microbead production.14
Figure 5.
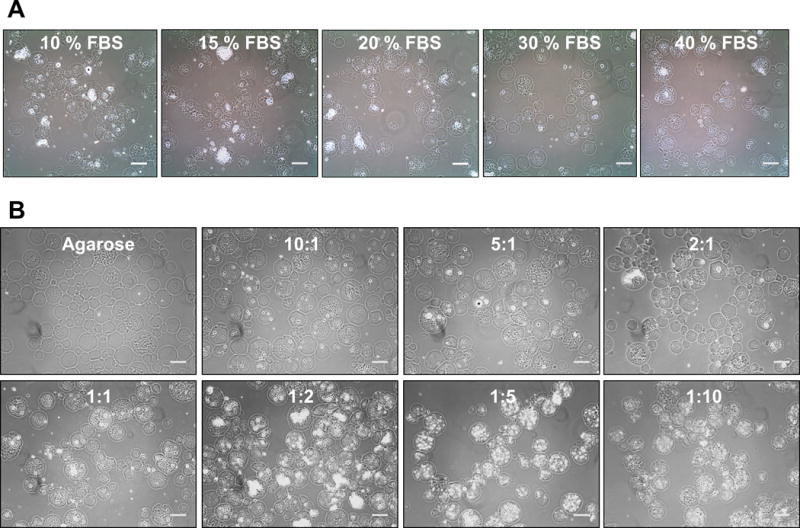
A) Effect of increasing the volume percentage of FBS in the matrix formulation on PEC incorporation. Greater proportions of FBS lead to increased encapsulation of PEC particles within the microbeads, likely due to the emulsifying effects of the serum. B) Effect of CS:CH mass ratio on PEC distribution. CS:CH mass ratios on the outer range of those examined (10:1, 5:1, 1:5 and 1:10) lead to more homogenous PEC distribution. Phase contrast images. Scale bar =100μm.
The effect of CS:CH mass ratio on PEC particle size and distribution in PEC-Ag microbeads was also examined, as shown in Figure 5B. In general, more homogenous distribution of smaller PEC particles was observed in CS:CH mass ratios at the outside range of those examined (10:1, 5:1, 1:5 and 1:10) formulations, while large and unevenly distributed PEC particles were observed in intermediate CS:CH mass ratios (1:2 to 2:1). It is possible that electrostatic interactions between the cationic CH, the anionic CS, and negatively-charged serum components such as albumin28 affect PEC size and distribution during the microbead fabrication process. At intermediate CS:CH mass ratios, the existence of unmatched cationic amine groups on CH 10 could permit the formation of CS-CH-protein complexes with altered swelling and aggregation properties, leading to larger and less suspendible particles.
Chondrogenesis in PEC-Agarose microbeads
Because of the homogenous distribution of fine PEC particles in the agarose microbead matrix using the 10:1 CS:CH and 1:10 CS:CH mass ratios, these materials were employed to further investigate the effects of “high” and “low” chondroitin sulfate formulations on MSC function and differentiation. Microbeads were again created using a single-step mixing and emulsification process. Pure agarose microbeads were used as controls, and all formulations were cultured for 21 days in CON or CDT media. The resulting microbeads are shown in Figure 6A. Encapsulation of both MSC and PEC was efficient, with little cellular or matrix material remaining unincorporated. Mean microbead diameters (Fig. 6B) were approximately 80–90 μm, with no significant differences between formulations.
Figure 6.
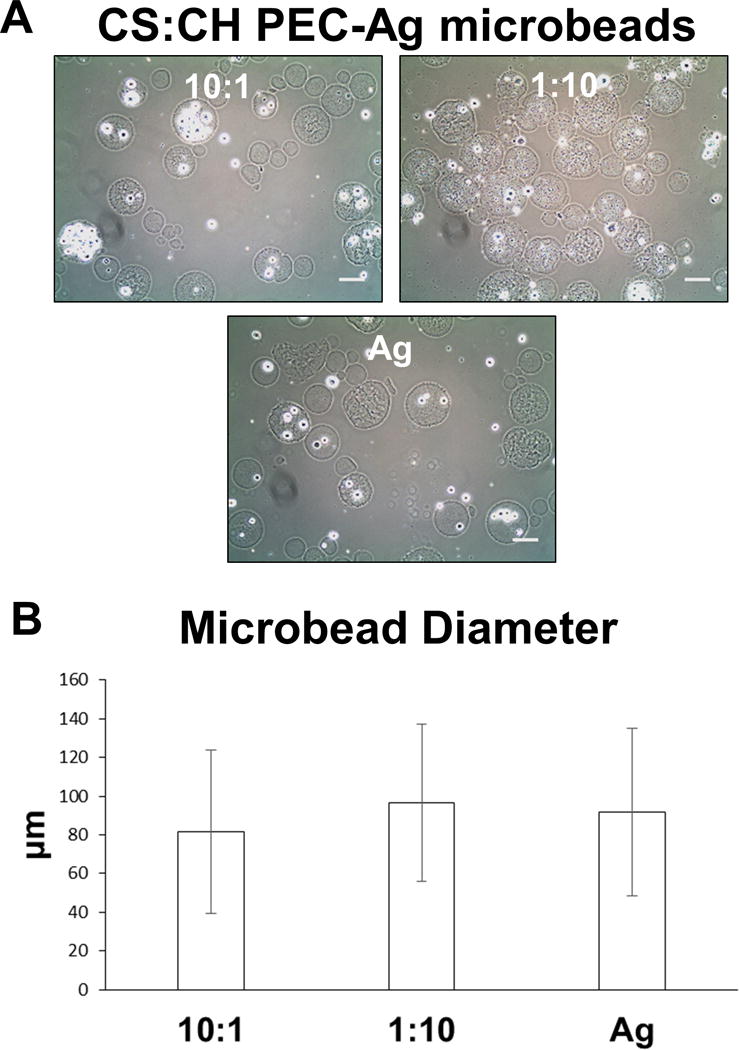
A) Phase contrast images of PEC-Ag and pure Ag microbeads at day 0, showing cell and PEC incorporation. Scale bar = 100μm. B) Mean diameters microbeads made with 10:1 and 1:10 CS:CH, as well as pure agarose formulations were in the 80–100μm range and did not vary significantly with formulation.
Vital staining of encapsulated MSC, shown in Figure 7A, indicated that the cells were evenly distributed in the microbead matrix and retained a rounded morphology over three weeks in culture. Quantification of live and dead cells (Fig. 7B) revealed that initial cell viability was very high (>90 %) in all formulations. Over time in culture, cell viability in the 1:10 CS:CH formulations declined to approximately 75–85 % by day 21, while viability in the 10:1 CS:CH and pure agarose formulations remained above 90%. There was only a modest effect of medium type, which was statistically significant only in the 1:10 CS:CH formulations. Overall, the PEC-Ag and pure Ag microbeads were shown to support cell encapsulation, viability, and maintenance of a rounded cell phenotype.
Figure 7.
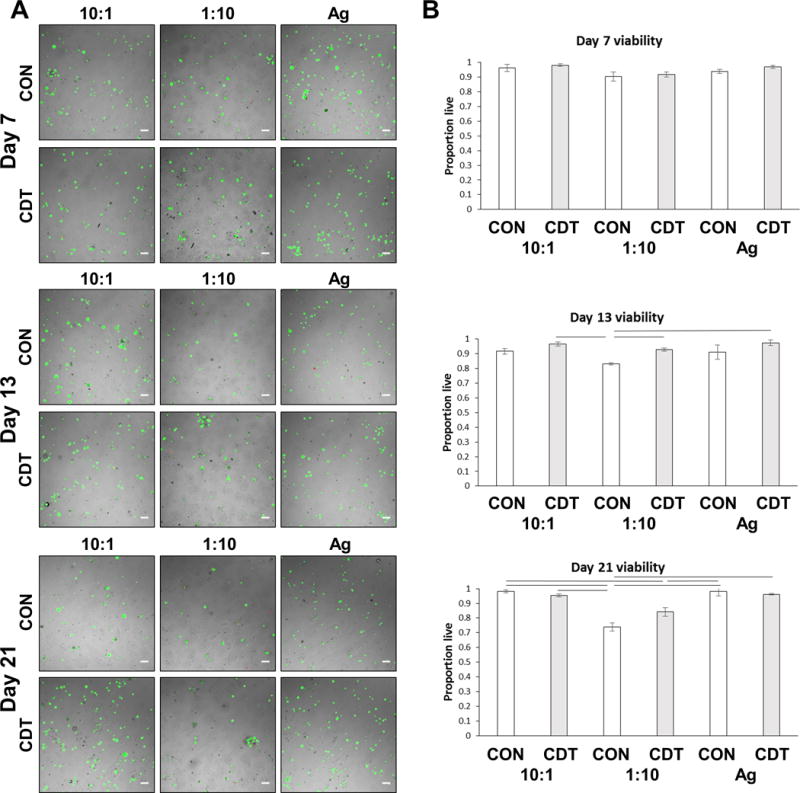
A) Overlay images of fluorescence and brightfield images of PEC-Ag microbeads containing MSC at 7, 13 and 21 days in control (CON) or chondrogenic (CDT) media. Cells under both conditions retained a rounded morphology, displaying little to no spreading over the time course. Green=live cells, red=dead cells. Scale bar = 100 μm. B) Quantitation of MSC viability in PEC-Ag microbeads shows the proportion of live cells in the 10:1 and Ag-only microbeads exceeded 90% at all time point. Lines indicate p<=0.05.
Sulfated GAG deposition was assessed histologically using Alcian Blue and Periodic Acid Schiff stain, as shown in Figure 8. Numerous deposits composed of sulfated and neutral GAG were observed within both PEC-Ag and Ag-only microbeads cultured in CDT medium, but not in those cultured in control medium. In the case of the 10:1 CS:CH PEC-Ag microbeads, agglomerations of these GAG deposits exceeded the size of the microbeads themselves.
Figure 8.
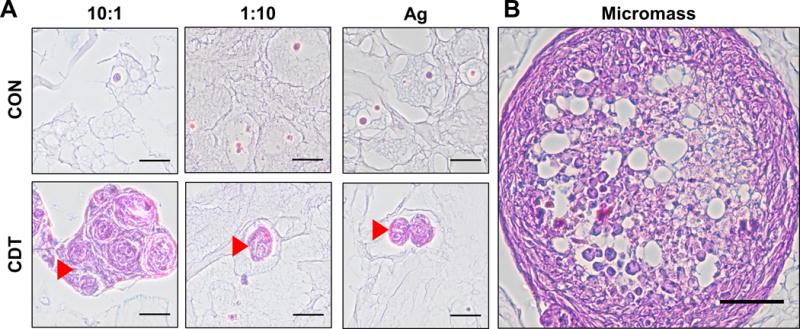
A) Histology of PEC-Ag microbeads at day 21 and B) chondrogenic micromasses. Alcian Blue-PAS staining shows the presence of sulfated and neutral glycosaminoglycans (blue for sulfated, light purple for neutral, magenta for both). Arrowheads show GAG-positive masses in microbeads cultured in chondrogenic (CDT) medium. Large agglomerations of GAG were found in the 10:1 formulation. 50 μm scale bar (100 μm scale bar for chondrogenic micromass positive control).
Chondrogenic differentiation was further verified by immunohistochemical staining for collagen type II (Figure 9). This marker co-localized in the observed GAG deposits, and was more prominent in samples cultured in CDT medium, particularly the 10:1 CS:CH PEC-Ag microbead formulation.
Figure 9.
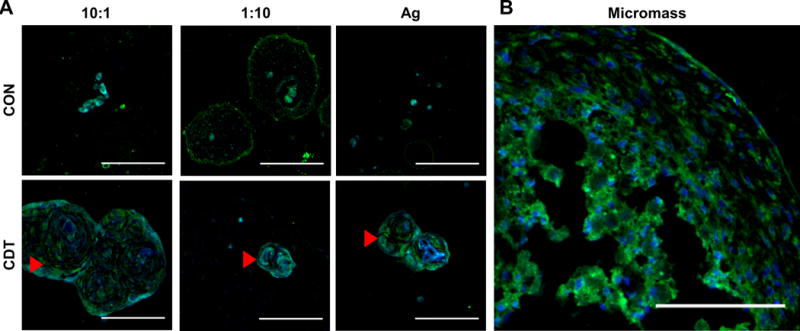
Collagen type II labeling of PEC-Ag microbeads cultured in control (CON) or chondrogenic (CDT) medium. Green = Collagen type II (FITC secondary antibody). Blue = DAPI stain. Arrows show masses of ECM containing Collagen type II. As with the Alcian Blue-PAS histology (see Fig.8), large agglomerations of extracellular matrix were found in the 10:1 microbeads. Scale bar = 100 μm.
The formation of clear ECM deposits rich in sGAG and collagen type II in 10:1 CS:CH microbeads suggests that the incorporation of chondroitin sulfate in a PEC can enhance chondrogenic differentiation of MSC. This is in accordance with previous work showing that chondroitin sulfate supports chondrogenesis,8,9 and also that release of CS from a CS-CH PEC can bolster chondrogenesis of MSC.17
Conclusion
The modular tissue engineering approach is attractive because it harnesses small tissue units that can subsequently be assembled into larger structures that recapitulate biomimetic features at both the micro- and macro-scales.29 Our goal in the present study was to create bioinspired materials for use in fabricating cell-encapsulating modular microtissues that require minimal production processing, retain cell viability, and foster chondrogenic differentiation of MSC. The PEC-Ag composite material presented here mimics components of the native cartilage extracellular matrix, and exploits the electrostatic interactions between chondroitin sulfate and chitosan to form a stable macromolecular complex without the use of additional crosslinking agents. Microbeads formed from PEC-Ag supported high MSC viability while preserving a rounded cell morphology. Chondrogenic differentiation was supported, as evidenced by the deposition of sGAG and collagen type II, particularly in the 10:1 CS-CH PEC-Ag microbead formulation.
From a therapeutic standpoint, populations of chondrogenic microbeads would have utility in developing next-generation cell-based therapies for cartilage repair. This modular strategy enables the controlled in vitro pre-conditioning of encapsulated cells in a defined microenvironment, either for delivery to the wound site as an injectable material 31 or for use in fabricating larger solid implantable constructs to maintain microbead localization.31 The properties of the extracellular microenvironment are critical for determining cell behavior, and therefore the use of bioinspired materials to promote the desired differentiation of progenitor cells can be an important tool in developing cell therapies.
Supplementary Material
Supplemental Figure 1: Relative emulsification effects of FBS and BSA alone on a mass/volume equivalent basis. A 15% volume of FBS results in a total BSA concentration of 5mg/ml in our formulations. Use of BSA resulted in increased formation of large unincorporated masses (arrowheads) that persisted even at concentrations of 10mg/ml BSA (equivalent to 30% FBS). These results indicate that serum components apart from albumin contribute to PEC emulsification. Scale bar =500μm.
Acknowledgments
Research reported in this publication was supported in part by the National Institute of Arthritis and Musculoskeletal and Skin Diseases of the National Institutes of Health under award numbers R21AR062709 and R01AR062636. The content is solely the responsibility of the authors and does not necessarily represent the official views of the National Institutes of Health. The authors wish to thank Dr. Ariella Shikanov (University of Michigan) for her contributions to protocol development. The collagen type II antibody was developed by T.F. Linsenmayer and was obtained from the Developmental Studies Hybridoma Bank, created by the NICHD of the NIH and maintained at The University of Iowa, Department of Biology, Iowa City, IA.
References
- 1.Hunziker EB. Osteoarthritis and Cartilage. 1999;7:15–28. doi: 10.1053/joca.1998.0159. [DOI] [PubMed] [Google Scholar]
- 2.Makris EA, Gomoll AH, Malizos KN, Hu JC, Athanasiou KA. Nature Rev. 2015;11:21–34. doi: 10.1038/nrrheum.2014.157. [DOI] [PMC free article] [PubMed] [Google Scholar]
- 3.Johnstone B, Alini M, Cucchiarini M, Dodge GR, Eglin D, Guilak F, Madry H, Mata A, Mauck RL, Semino CE, Stoddart MJ. Euro Cells and Mater. 2013;25:248–267. doi: 10.22203/ecm.v025a18. [DOI] [PubMed] [Google Scholar]
- 4.Connelly JT, Garcia AJ, Levenston ME. J Cell Phys. 2008;217:145–154. doi: 10.1002/jcp.21484. [DOI] [PubMed] [Google Scholar]
- 5.Bosnakovski D, Mizuno M, Kim G, Takagi S, Okumura M, Fujinaga T. Biotechnology and Bioengineering. 2006;93:1152–1163. doi: 10.1002/bit.20828. [DOI] [PubMed] [Google Scholar]
- 6.Sechriest VF, Miao YJ, Niyibizi C, Westerhausen–Larson A, Matthew HW, Evans CH, Fu FH, Suh JK. J Biomed Mater Res. 2000;49:534–541. doi: 10.1002/(sici)1097-4636(20000315)49:4<534::aid-jbm12>3.0.co;2-#. [DOI] [PubMed] [Google Scholar]
- 7.Mackie EJ, Tatarczuch L, Mirams M. J Endo. 2011;211:109–121. doi: 10.1530/JOE-11-0048. [DOI] [PubMed] [Google Scholar]
- 8.Wu YN, Yanga Z, Huia JHP, Ouyangb HW, Lee EH. Biomaterials. 2007;28:4056–4067. doi: 10.1016/j.biomaterials.2007.05.039. [DOI] [PubMed] [Google Scholar]
- 9.Varghese S, Hwang NS, Canver AC, Theprungsirikul P, Lin DW, Elisseeff J. Matrix Bio. 2007;27:12–21. doi: 10.1016/j.matbio.2007.07.002. [DOI] [PubMed] [Google Scholar]
- 10.Fajardo AR, Lopes LC, Valente AJM, Rubira AF, Muniz EC. Colloid Polym Sci. 2011;289:1739–1748. [Google Scholar]
- 11.Wan ACA, Tai BCU. Biotechnology Advances. 2013;31:1776–1785. doi: 10.1016/j.biotechadv.2013.09.007. [DOI] [PubMed] [Google Scholar]
- 12.Berger J, Reist M, Mayer JM, Felt O, Gurny R. Euro J of Pharmaceutics and Biopharmaceutics. 2004;57:35–52. doi: 10.1016/s0939-6411(03)00160-7. [DOI] [PubMed] [Google Scholar]
- 13.Malafaya PB, Silva GA, Reis RL. Advanced Drug Delivery Reviews. 2007;59:207–233. doi: 10.1016/j.addr.2007.03.012. [DOI] [PubMed] [Google Scholar]
- 14.Wise JK, Alford AI, Goldstein SA, Stegemann JP. Tissue Engineering: Part A. 2014;20:210–224. doi: 10.1089/ten.tea.2013.0151. [DOI] [PMC free article] [PubMed] [Google Scholar]
- 15.Drury JL, Mooney DJ. Biomaterials. 2003;24:4337–4351. doi: 10.1016/s0142-9612(03)00340-5. [DOI] [PubMed] [Google Scholar]
- 16.Denuziere A, Ferrief D, Domard A. Carbohydrate Polym. 1996;29:317–323. [Google Scholar]
- 17.Piai JF, Rubira AF, Muniz EC. Acta Biomaterialia. 2009;5:2601–2609. doi: 10.1016/j.actbio.2009.03.035. [DOI] [PubMed] [Google Scholar]
- 18.Denuziere A, Ferrier D, Damour O, Domard A. Biomaterials. 1998;19:1275–1285. doi: 10.1016/s0142-9612(98)00036-2. [DOI] [PubMed] [Google Scholar]
- 19.Silva JM, Georgi N, Costa R, Sher P, Reis RL, Van Blitterswijk CA, Karperien M, Mano JF. PLoSOne. 2013;8:e55451. doi: 10.1371/journal.pone.0055451. [DOI] [PMC free article] [PubMed] [Google Scholar]
- 20.Farrell E, O’Brien FJ, Doyle P, Fischer J, Yannas I, Harley BA, O’Connell B, Prendergast PJ, Campbell VA. Tissue Engineering. 2006;12:459–468. doi: 10.1089/ten.2006.12.459. [DOI] [PubMed] [Google Scholar]
- 21.Mackay AM, Beck SC, Murphy JM, Barry FP, Chichester CO, Pittenger MF. Tissue Engineering. 1998;4:415–428. doi: 10.1089/ten.1998.4.415. [DOI] [PubMed] [Google Scholar]
- 22.Farndale RW, Buttle DJ, Barrett AJ. Biochimica et Biophysica Acta. 1986;883:173–177. doi: 10.1016/0304-4165(86)90306-5. [DOI] [PubMed] [Google Scholar]
- 23.Coleman RM, Schwartz Z, Boyan BD, Guldberg RE. Tissue Engineering: Part A. 2013;19:475–483. doi: 10.1089/ten.TEA.2012.0125. [DOI] [PubMed] [Google Scholar]
- 24.Batorsky A, Liao J, Lund AW, Plopper GE, Stegemann JP. Biotechnology and Bioengineering. 2005;92:492–500. doi: 10.1002/bit.20614. [DOI] [PubMed] [Google Scholar]
- 25.Coleman RM, Case ND, Guldberg RE. Biomaterials. 2007;28:2077–2086. doi: 10.1016/j.biomaterials.2007.01.010. [DOI] [PubMed] [Google Scholar]
- 26.Volger EA. Colloids and Surfaces. 1989;42:233–254. [Google Scholar]
- 27.Price PJ, Gregory EA. In Vitro. 1982;18:576–584. doi: 10.1007/BF02810081. [DOI] [PubMed] [Google Scholar]
- 28.Santo VE, Gomes ME, Mano JF, Reis RL. J Tissue Engineering and Regenerative Medicine. 2012;6:s47–s59. doi: 10.1002/term.1519. [DOI] [PubMed] [Google Scholar]
- 29.Nichol JW, Khademhosseini A. Soft Matter. 2009;5:1312–1319. doi: 10.1039/b814285h. [DOI] [PMC free article] [PubMed] [Google Scholar]
- 30.Wang L, Rao RR, Stegemann JP. Cells Tissues Organs. 2013;197:333–343. doi: 10.1159/000348359. [DOI] [PMC free article] [PubMed] [Google Scholar]
- 31.Caldwell DJ, Rao RR, Stegemann JP. Advanced Healthcare Materials. 2013;2:673–677. doi: 10.1002/adhm.201200346. [DOI] [PMC free article] [PubMed] [Google Scholar]
- 32.Lee P, Tran K, Chang W, Shelke NB, Kumbar SG, Yu X. J Biomed Nanotechnol. 2014;10:1469–1479. doi: 10.1166/jbn.2014.1831. [DOI] [PubMed] [Google Scholar]
Associated Data
This section collects any data citations, data availability statements, or supplementary materials included in this article.
Supplementary Materials
Supplemental Figure 1: Relative emulsification effects of FBS and BSA alone on a mass/volume equivalent basis. A 15% volume of FBS results in a total BSA concentration of 5mg/ml in our formulations. Use of BSA resulted in increased formation of large unincorporated masses (arrowheads) that persisted even at concentrations of 10mg/ml BSA (equivalent to 30% FBS). These results indicate that serum components apart from albumin contribute to PEC emulsification. Scale bar =500μm.


