Abstract
Purpose
To characterize optic nerve head (ONH) connective tissue change within 21 monkey experimental glaucoma (EG) eyes, so as to identify its principal components.
Methods
Animals were imaged three to five times at baseline then every 2 weeks following chronic unilateral IOP elevation, and euthanized early through end-stage confocal scanning laser tomographic change. Optic nerve heads were serial-sectioned, three-dimensionally (3D) reconstructed, delineated, and quantified. Overall EG versus control eye differences were assessed by general estimating equations (GEE). Significant, animal-specific, EG eye change was required to exceed the maximum physiologic intereye differences in six healthy animals.
Results
Overall EG eye change was significant (P < 0.0026) and animal-specific EG eye change most frequent, for five phenomena (number of EG eyes and range of animal-specific change): posterior laminar deformation (21, −29 to −437 μm), laminar thickening (11, 20–73 μm) and thinning (3, −23 to −31 μm), scleral canal expansion (17, 20–139 μm), outward anterior (16, −16 to −124 μm) and posterior (17, −22 to −279 μm) laminar insertion migration, and peripapillary scleral bowing (11, 21–77 μm). Experimental glaucoma versus control eye laminar thickness differences were bimodal in behavior, being thickened in most EG eyes demonstrating the least deformation and less thickened or thinned in most EG eyes demonstrating the greatest deformation.
Conclusions
Our postmortem studies retrospectively identify five connective tissue components of ONH “cupping” in monkey EG which serve as targets for longitudinally staging and phenotyping ONH connective tissue alteration within all forms of monkey and human optic neuropathy.
Keywords: glaucoma, optic nerve head, neural canal, lamina cribrosa position and thickness, peripapillary scleral position and thickness, post-BMO total prelaminar volume
The connective tissue components of glaucomatous cupping in the monkey and human eye have been classically described to include laminar deformation, scleral canal expansion, and progressive laminar thinning.1–4 In an early review article,5 we hypothesized that focal mechanical failure of the anterior laminar beams at their insertion into the sclera, followed by circumferential (radial) and posterior (outward) extension of this failure could explain these phenomena. However, in a series of subsequent publications characterizing early optic nerve head (ONH) connective tissue change in monkeys with unilateral experimental glaucoma (EG), we described posterior deformation and thickening of the lamina,6,7 accompanied by scleral canal expansion,8 outward bowing of the peripapillary sclera,6,7 and outward migration of the laminar insertion into the retrobulbar pial sheath.9 These phenomena, together suggested that the lamina was not just deforming in response to chronic IOP elevation but was “remodeling” itself into a new shape in response to its altered biomechanical environment.9–13 One aspect of the increase in laminar thickness appeared to be the addition of new beams,11 which, combined with evidence for laminar insertion migration,9 suggested that recruitment of the longitudinally oriented retrolaminar optic nerve septa into more transversely oriented structures may be part of the lamina's initial remodeling response in early monkey EG.11
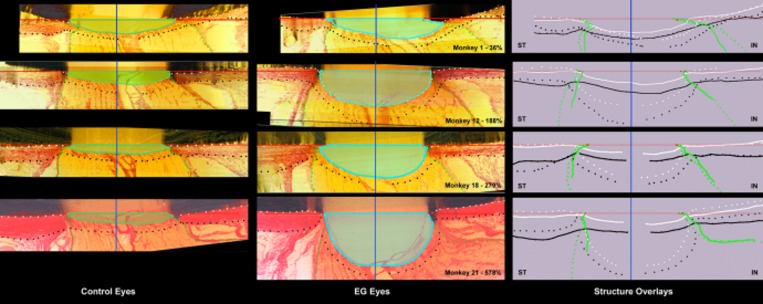
In the present report, we extend our previous studies of ONH connective tissue change in monkey EG from nine animals euthanized at the onset of confocal scanning laser tomographic (CSLT) change in the EG eye,14 to include 12 additional animals in which the EG eye was followed to variable amounts of progressive CSLT-detected ONH surface change beyond the detection of onset. We thus report EG versus control eye differences in a total of 21 monkeys spanning from early through endstage CSLT change (see Methods). We assess overall (experiment-wide) EG versus control eye differences using general estimating equations (GEE) but emphasize the range of significant, animal-specific, EG eye change, which we require to exceed the maximum physiologic intereye differences (PIDmax) previously reported in six healthy animals.14 Animals are ordered by the magnitude of EG eye change in our parameter post-Bruch's membrane opening (BMO) total prelaminar volume (Fig. 1), which quantifies the volume of space above the lamina, below BMO and within the neural canal wall and serves as a surrogate measure of overall laminar/scleral connective tissue deformation.
Figure 1.
Five connective tissue phenomena underlie ONH cupping in monkey EG: (1) laminar deformation, (2) scleral canal expansion, (3) laminar insertion migration, (4) laminar thickness change, and (5) posterior bowing of the peripapillary sclera. Our parameter post-BMO total prelaminar volume (light green in left column and light blue in middle column) captures three of these phenomena and serves as a surrogate measure of overall ONH laminar/scleral canal deformation within a given EG eye. The following landmarks are delineated within representative superior temporal (ST) to inferior nasal (IN) digital sections from the control (left) and EG (middle) eye of four representative animals (monkeys 1, 12, 18, and 21, respectively) that span the full range of EG versus control eye post-BMO total prelaminar volume difference (36%–578%): anterior scleral/laminar surface (white dots), posterior scleral/laminar surface (black dots), neural boundary (green dots), BMO reference plane (red line), and BMO centroid (vertical blue line). Delineated points for the control (solid lines) and EG (dotted) eye of each animal are overlaid relative to the BMO centroid in the schematic diagrams on the right. For each animal, post-BMO total prelaminar volume is outlined in both the control (light green, left) and EG (light blue, middle) eye for qualitative comparison. The overlaid delineations for both eyes of each animal in the right column make it clear that EG eye post-BMO total prelaminar volume expansion is due to the combination of posterior laminar deformation, scleral canal expansion and outward migration of the anterior laminar insertion. Post-BMO total prelaminar volume expansion is present within monkey 1 and progresses through more advanced stages of connective tissue deformation and remodeling (monkeys 12, 18, and 21; Fig. 3). The phenomena that underlie post-BMO total prelaminar volume expansion are accompanied by laminar thickening in the EG eyes with the least post-BMO total prelaminar volume change (monkeys 1 and 12), thickening that is progressively diminished in magnitude in eyes with moderate post-BMO total prelaminar volume change (monkey 18) and laminar thinning in the eyes with the largest post-BMO total prelaminar volume change (monkey 21; see Fig. 4 for more details). Outward migration of the laminar insertions is apparent in monkeys 12, 18, and 21 (also see Fig. 4). Outward bowing of the peripapillary sclera is present in the majority of EG eyes (Fig. 5). Here it is evident in the right column schematic overlays for monkeys 12 and 21 by the fact that the EG eye anterior sclera (white dotted line delineations) are anterior to the control eye anterior sclera (white solid line delineations). Reprinted with permission from Burgoyne C. The morphological difference between glaucoma and other optic neuropathies. J Neuroophthalmol. 2015 Sep;(35 suppl 1):S8–S21. © 2015 by the North American Neuro-Ophthalmology Society.
Because “cupping” in glaucoma consists of neural and connective tissue components and involves both deformation and remodeling of the ONH tissues, three concepts are important to clarify. First, deformation can be fixed (permanent) or reversible depending upon the compliance of the tissues and the transition from reversible to fixed deformation involves connective tissue remodeling.5 Second, we define laminar/scleral deformation to be the result of anterior or posterior laminar deformation, scleral canal expansion or contraction, and anterior or posterior migration of the anterior laminar insertion. While each phenomenon is measured individually, our parameter post-BMO total prelaminar volume7,9 captures all three. Third, connective tissue remodeling11,12,15 not only contributes to the stiffening processes whereby reversible deformations become permanent, it separately underlies the phenomena of laminar insertion migration,9,16,17 laminar thickness change,11 and retrolaminar septal recruitment.11
The purpose of this report is to identify the principal components of ONH connective tissue deformation and remodeling in monkey experimental glaucoma. To do so we ask the question, “As the lamina and scleral canal progressively deform and remodel, what are the components of connective tissue alteration that accompany and/or contribute to this process?” Within 21 EG eyes, we identify five principal connective tissue components of glaucomatous cupping in the monkey eye (Fig. 1): (1) posterior (outward) laminar deformation, (2) scleral canal expansion, (3) anterior (inward) and posterior migration of the anterior and posterior laminar insertions, (4) laminar thickness change (being mostly thickened in EG eyes demonstrating the least deformation and less thickened or thinned in EG eyes demonstrating the greatest deformation), and (5) posterior bowing of the peripapillary sclera.
We propose that the connective tissue components of ONH cupping are important because they are defining features of a “glaucomatous” optic neuropathy (i.e., they determine its phenotype [the depth and extent of cupping and excavation] regardless of the mechanism of primary insult or the level of IOP at which the neuropathy occurs).18–20 The connective tissue components of cupping are also important because the cellular mechanisms of each will likely contribute to the cellular mechanisms of glaucomatous retinal ganglion cell (RGC) axon insult within the ONH.10,21 The use of these connective tissue components to stage and phenotype the optic neuropathy of glaucoma and study its mechanisms of insult are not the focus of this study but will be the subject of future reports.
Materials and Methods
Animals
All animals were treated in accordance with the ARVO Statement for the Use of Animals in Ophthalmic and Vision Research. Table 1 provides a list of acronyms and their definitions. Twenty-one young adult and adult rhesus macaque (n = 16) and cynomolgus (n = 5) monkeys, ranging in age from 5 to 21 years old, (Table 2), were studied between 1999 and 2010 as part of several primary study protocols.
Table 1.
Commonly Used Acronyms/Terms and Their Description
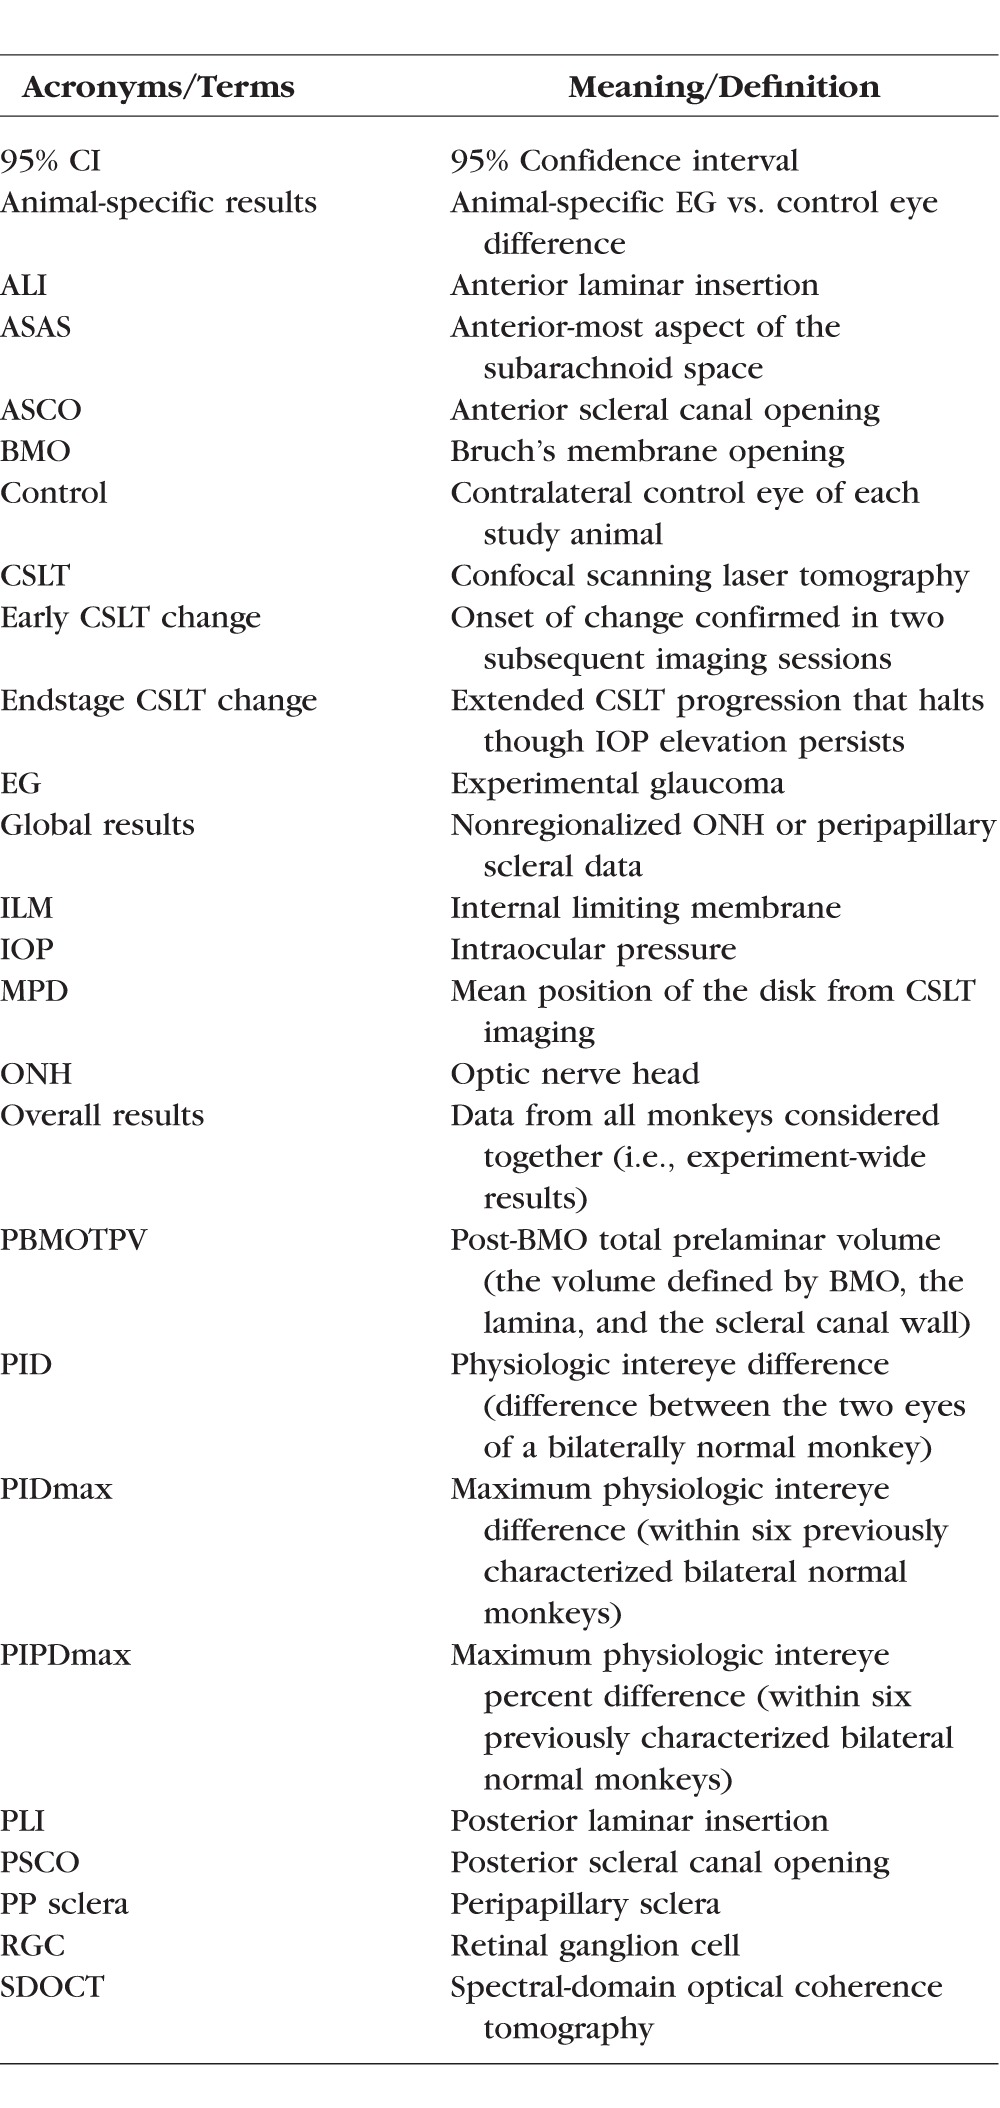
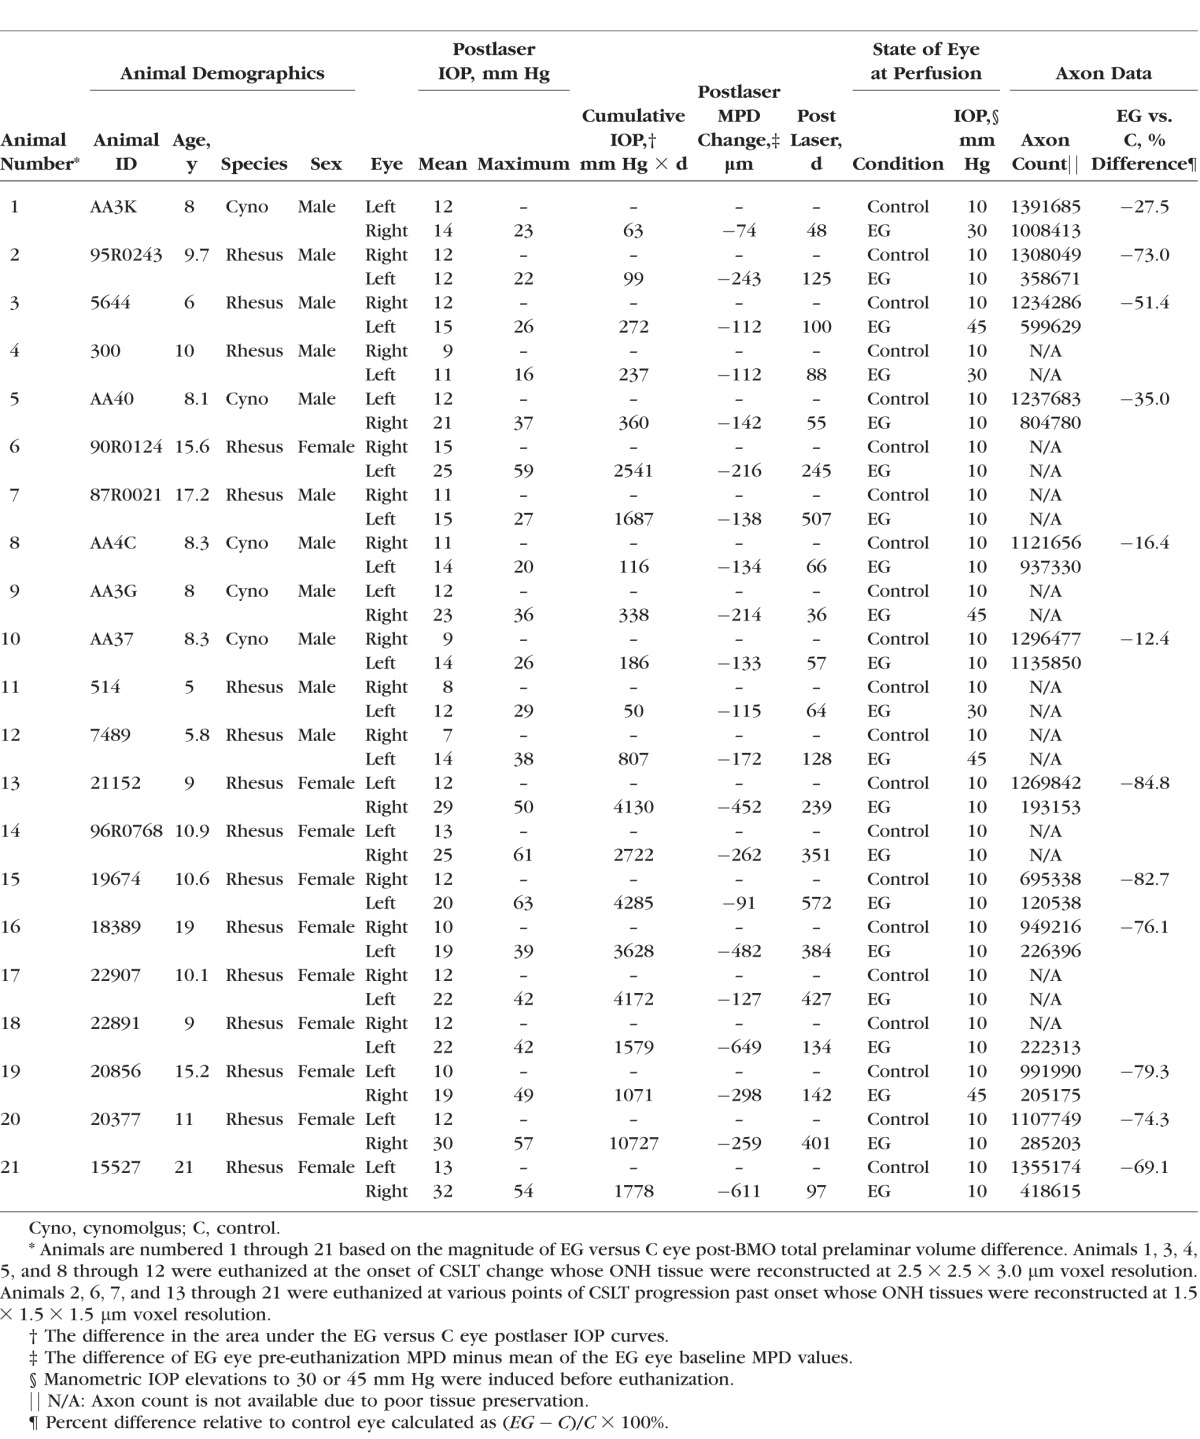
Table 2.
Animal Data by Animal and Eye
ONH CSLT Imaging
We have previously described our ONH surface imaging strategy using the CSLT parameter mean position of the disc (MPD).22–24 Confocal scanning laser tomographic imaging was performed 30 minutes after IOP was manometrically lowered to 10 mm Hg in both eyes in an initial group of nine animals14,24 using a Laser Diagnostic Technologies TopSS (San Diego, CA, USA) device, and in a later group of 12 animals using a Heidelberg Retinal Tomograph II, (HRT II, Heidelberg Engineering GmbH, Heidelberg, Germany). These studies preceded our implementation of spectral-domain optical coherence tomography (SDOCT),25,26 thus OCT ONH rim and retinal nerve fiber layer thickness (RFNLT) measurements were not obtained. After three to eight baseline testing sessions, one eye of each monkey was given laser-induced, chronic experimental IOP elevation,27 and IOP 10 mm Hg imaging of both eyes of each animal was repeated at 2-week intervals until euthanization occurred. Animals were euthanized at varying levels of CSLT progression extending from early (onset confirmed twice) through endstage (progression that halted in the face of prolonged IOP elevation) CSLT MPD change from baseline. Mean position of the disc data was available for both eyes of all 21 animals. Rim area data could only be generated from the 12 animals imaged with the Heidelberg Retinal Tomograph.
Perfusion Fixation at Prescribed IOP
Under deep pentobarbital anesthesia, IOP in both eyes was set to 10 mm Hg by anterior chamber manometer for a minimum of 30 minutes to reduce the reversible component of connective tissue deformation present in both the control and EG eyes.14,23 Fourteen of 21 animals were then perfusion fixed via the descending aorta with 1 L 4% buffered hypertonic paraformaldehyde solution followed by 6 L 5% buffered hypertonic glutaraldehyde solution. However, in seven animals, IOP in the EG eye was then manometrically elevated to either 30 (n = 3) or 45 (n = 4) mm Hg for 15 minutes prior to perfusion fixation as part of their primary study protocols.24 Following perfusion, IOP was maintained for 1 hour, and then each eye was enucleated, all extraocular tissues were removed, and the intact anterior chamber was excised 2 to 3 mm posterior to the limbus. By gross inspection, perfusion was excellent in all 42 eyes. The posterior scleral shell with intact ONH, choroid, and retina were then placed in 5% glutaraldehyde solution for storage.
3D Histomorphometric Reconstruction
These steps have been described in detail in our previous reports.6–9,27 For this study, both eyes of 12 animals were reconstructed at a voxel resolution of 1.5 × 1.5 × 1.5 μm. Briefly, the ONH and peripapillary sclera were trephined (6-mm diameter), embedded in paraffin, and mounted on a microtome with the ONH surface facing out. The fresh block surface was stained with a 1:1 (vol/vol) mixture of ponceau S and acid fuchsin stains, imaged at a transverse resolution of 1.5 × 1.5 μm per pixel and serial sectioned at 1.5-μm increments. Nine animals were reconstructed at a voxel resolution of 2.5 × 2.5 × 3.0-μm resolution, (monkeys 1, 3–5, and 8–12, respectively) using an earlier technique.6–8 Imaging of the stained embedded tissue block surface started at the vitreoretinal interface and ended 200 μm into the retrolaminar orbital optic nerve. The position of the tissue block and camera were recorded by laser displacement sensors (Keyence Corp., Woodcliff Lake, NJ, USA) at each serial section. All acquired images were then stacked and aligned using the laser position data into a digital 3D reconstruction.
3D Delineation of ONH and Peripapillary Scleral Landmark Points (Supplementary Figs. S1, S2)6–9
Within 40 radial digital section images (4.5° apart), the delineator marked seven structures and six pairs of neural canal landmarks (Supplementary Figs. S1, S2). Two experienced delineators performed all of the delineations in this study. Both eyes of an animal were delineated by a single delineator. Delineators were not masked to the treatment status of each eye, however, they were effectively unaware because the delineation software did not contain that information. Upon completion of delineation, the marks were checked for accuracy by two experienced observers (HY and CFB).
BMO Reference Plane and Parameterization (Supplementary Figs. S2, S3)
For each 3D ONH reconstruction, a plane satisfying a least square error restraint was fit to the 80 BMO points (2 per digital section image)8,28 creating a BMO reference plane (Supplementary Fig. S2C).8,28 All BMO points were projected onto the fitted plane, an ellipse was fit (BMO ellipse) to the projected points and its centroid (BMO centroid) was used as the center point for a series of subsequent measurements. Global values for 19 standard 3D histomorphometric reconstruction parameters (listed in Table 3 and depicted in Supplementary Figs. S2, S3) were quantified as previously described.6–9,14 Regional change in each 3D histomorphometric parameter, (characterized relative to the foveal–BMO axis),29 as well as global and regional laminar microarchitectural change,29 will be the subject of future reports.
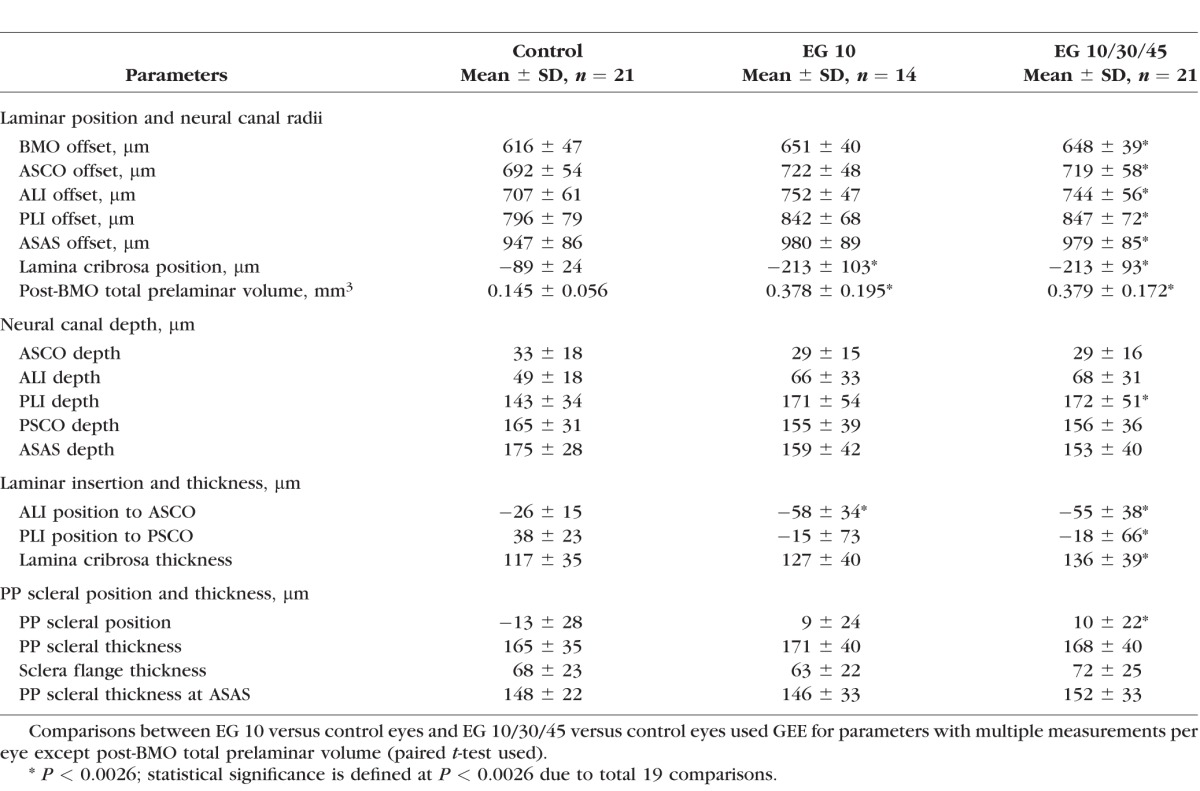
Table 3.
Overall Mean Values for Each Parameter Within the Control and Treated Eyes Grouped by Fixation IOP
Interdelineator Reproducibility
Five operators delineated the landmark points of both eyes of three monkeys (animals 5, 8, and 10). The intraclass-correlation coefficient (ICC) for all reported parameters were calculated within a one-way ANOVA.30 Reproducibility was fair to good (0.4–0.75) or excellent (>0.75) for all parameters included in this report (Supplementary Table S1).
IOP Characterization
Cumulative IOP difference estimates the total postlaser ‘IOP insult' sustained by each EG eye compared with its control eye and was calculated as the IOP difference between the EG and the control eye at each measurement, multiplied by the number of days from the last to the current IOP measurement, and summed over the period of postlaser follow-up (mm Hg × day).31 EG eye maximum IOP was defined to be the maximum, postlaser IOP recorded for each EG eye. Mean postlaser IOP was the mean of all postlaser IOP measurements for a given eye.
Optic Nerve Axon Counts
Post mortem, optic nerve axon counts for both eyes of 12 of 21 animals were performed using a previously-described, automated segmentation algorithm that samples 100% of the optic nerve cross-section and counts 100% of the detected axons.32 Optic nerve tissues in the remaining animals did not support axon counts of any form due to poor tissue preservation. CSLT MPD and post-BMO total prelaminar volume values were available for both eyes of all 12 animals with axon counts. Confocal scanning laser tomographic rim area was available for only 7 of 12 animals with axon counts (see above).
Statistical Analyses
Overall EG versus control eye differences were evaluated for each of the 19 parameters within a GEE in which the required level of significance was set at P less than 0.0026 to adjust for 19 comparisons. Experimental glaucoma versus control eye differences in the parameter post-BMO total prelaminar volume were evaluated using a paired t-test with the same P value required for significance. To assess the effect of including all 21 EG eyes (perfusion fixed at IOP 10, 30, or 45, n = 21) compared to just the 14 IOP 10 EG eyes, the overall analysis was rerun, to assess the magnitude and significance of EG 10 (n = 14) versus control (n = 21) eye differences in each parameter.
Animal-specific EG versus control eye differences were determined to be significant for each parameter for each EG eye by comparing them to the maximum between eye difference (maximum physiologic intereye difference or PIDmax value) for that parameter among six previously studied, bilaterally healthy animals.14 For the parameter post-BMO total prelaminar volume, percent difference was calculated and compared with physiologic intereye percent difference (PIPD) maximum data from the same report.14 We thus defined significant EG eye parameter change for each animal to have occurred when EG versus control eye differences exceeded the PID or PIPD max value for that parameter.14
The 21 animals were ordered by the magnitude of EG versus control eye difference in post-BMO total prelaminar volume as a surrogate for overall ONH connective tissue deformation. Three groups of selected correlations were then sought using either Pearson correlations or GEE. Because the comparisons in each group were predetermined and deliberate we did not adjust the P value required for significance (P < 0.05), however comparisons achieving P values adjusted for the number of comparisons in each group, were emphasized.
Correlations to Predict EG Eye Connective Tissue Change
Pearson correlations were assessed between the six IOP and control eye connective tissue parameters: control eye anterior scleral canal opening (ASCO) offset, lamina cribrosa position, lamina cribrosa thickness, and peripapillary scleral thickness, EG eye postlaser IOP maximum, and EG eye cumulative IOP insult; and each of the connective tissue parameters that demonstrated significant overall EG versus control eye differences, including anterior scleral canal opening offset, lamina cribrosa position, lamina cribrosa thickness and post-BMO total prelaminar volume, and the CSLT parameter EG eye MPD change from baseline. Correlations achieving P less than 0.0017 were emphasized to account for 30 comparisons.
Correlations Between CSLT MPD, CSLT Rim Area, and Post-BMO Total Prelaminar Volume
Correlations between the CSLT parameters MPD (21 animals) and rim area (n = 12 animals) with post-BMO total prelaminar volume were sought within the n = 21 and n = 12 animals, respectively, that had both measurements using GEE. Pearson correlations between the CSLT parameters EG eye MPD change from baseline and rim area change from baseline with EG versus control eye differences in post-BMO total prelaminar volume were then sought, in the same animals. Correlations achieving P less than 0.0125 were emphasized to account for four comparisons.
Correlations With Optic Nerve Axon Counts
Correlations with optic nerve axon counts were sought for the following parameters, in the animals that had both measurements, by GEE: CSLT MPD (n = 12 animals), CSLT rim area (n = 7 animals), post-BMO total prelaminar volume (n = 12 animals), and lamina cribrosa position (n = 12 animals). Correlations with EG versus control eye axon count differences were also sought for the following parameters: CSLT EG eye MPD change from baseline (n = 12 animals), CSLT EG eye rim area change from baseline (n = 7 animals), EG versus control eye post-BMO total prelaminar volume difference (n = 12 animals), and EG versus control eye laminar position difference (n = 12 animals) using Pearson correlations. Correlations achieving P less than 0.0063 were emphasized to account for eight comparisons.
Analysis was carried out either in R (the R Foundation for Statistical Computing, Vienna, Austria) or Microsoft Excel (Microsoft, Redmond, WA, USA).
Results
Animals
Animal demographic, IOP, and axon count data are reported in Table 2. Animals were euthanized 36 to 572 days after the onset of lasering. Mean postlaser IOP in the EG and control eyes ranged from 11 to 32 mm Hg and from 7 to 15 mm Hg, respectively. Experimental glaucoma eye maximum postlaser IOP ranged from 16 to 63 mm Hg. Experimental glaucoma eye cumulative IOP difference ranged from 50 to 10,727 (mm Hg × days) at euthanization. Experimental glaucoma eye percent axon difference (relative to its control eye) ranged from 12.4% to 84.8% in the 12 monkeys for which axon counts were available. Experimental glaucoma eye CSLT MPD change from baseline ranged from −74 to −649 μm in all 21 animals.
Five Connective Tissue Components Underlie ONH Cupping in Monkey EG
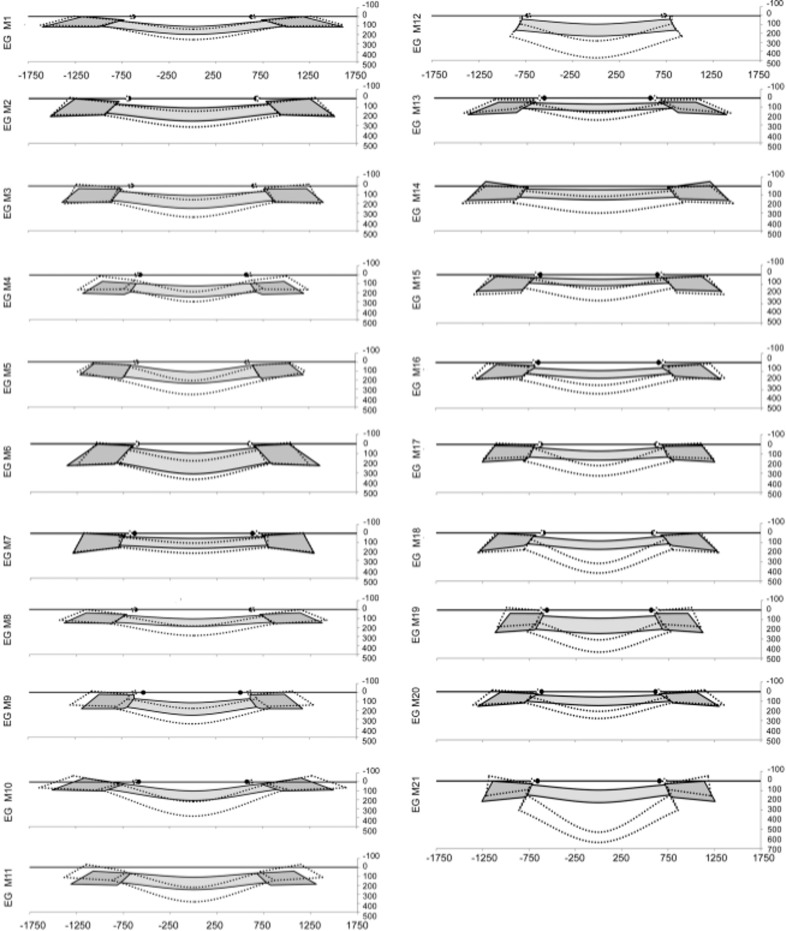
Figure 1 displays matched digital cross-section images from the control and EG eyes of monkeys 1, 12, 18, and 21, which span the full range of EG versus control eye post-BMO total prelaminar volume difference present within the 21 EG eyes of this report (36%–578%). Taken together these images depict the most consistent components of ONH connective tissue alteration in monkey EG: (1) posterior (outward) laminar deformation, (2) scleral canal expansion, (3) posterior (outward) migration of the anterior and posterior laminar insertions (from the sclera into the pial sheath), (4) laminar thickness change (increased in most eyes demonstrating the least deformation and less thickened or thinned in most eyes demonstrating the greatest deformation), and (5) posterior (outward) bowing of the peripapillary sclera; and their range. Data supporting each of these phenomena are described in the sections that follow. Schematic plots of the global control and EG eye 3D histomorphometric data for each animal are shown in Figure 2. These plots allow the differences among the 21 control eyes and the full range of EG versus control eye differences among the 21 study animals to be appreciated.
Figure 2.
Schematic depiction of the global data for the control (solid gray colors) and EG (dotted lines) ONH of each animal. Animals are ordered (1–21) by increasing overall ONH connective tissue deformation as characterized by the parameter post-BMO total prelaminar volume (see Figs. 1, 3). The lamina is consistently thickened in the eyes with the least deformation and consistently thinned in the most profoundly deformed eyes. These changes are accompanied by anterior and posterior laminar insertion migration, scleral canal expansion, and peripapillary scleral bowing (Figs. 1, 3, 4, 5). The relationship between overall deformation and these related phenomena can be better appreciated within the data plots of Figures 3 through 5.
Posterior (Outward) Laminar Deformation and Scleral Canal Expansion
Within the overall analysis (n = 21 animals, Table 3), outward displacement of lamina cribrosa position, and expansions of post-BMO total prelaminar volume, Bruch's membrane opening offset, anterior scleral canal opening offset, anterior laminar insertion offset, posterior laminar insertion offset and anterior most subarachnoid space offset each achieved significance (GEE analysis, P < 0.0026 to adjust for 19 comparisons).
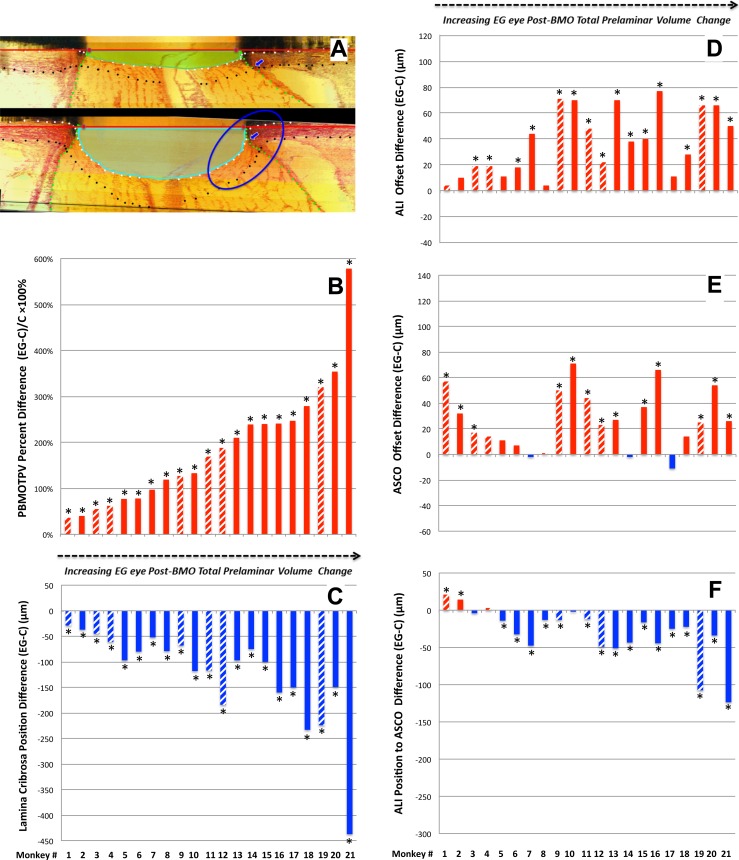
Table 4 reports the frequency and range of significant (by PID and PIPDmax criteria, see Methods) animal-specific EG versus control eye differences for each parameter. Figure 3B depicts the range of animal-specific, post-BMO total prelaminar volume change within all 21 EG eyes (21 of 21 significant). Laminar position change (21 of 21 significant, Fig. 3C), anterior scleral canal opening expansion (13 of 21 significant, Fig. 3D), anterior laminar insertion expansion (16 of 21, Fig. 3E) and anterior laminar insertion migration (18 of 21 significant, 2 anterior [inward] and 16 posterior [outward], Fig. 3F), are plotted relative to it. These data together illustrate how EG versus control eye post-BMO total prelaminar volume difference incorporates each of these phenomena and in so doing serves as a surrogate of overall connective tissue deformation. These data also suggest that while EG eye post-BMO total prelaminar volume expansion (Fig. 3B), posterior laminar deformation (Fig. 3C), and outward anterior laminar insertion migration (Fig. 3F) are progressive through the full range of deformation, scleral canal expansion (at both the anterior scleral canal opening and the anterior laminar insertion) reached its maximum at modest levels of overall deformation (EG eye post-BMO total prelaminar volume difference of approximately 125%) and did not progress further.
Table 4.
Frequency, Direction, and Range of Significant, Animal-Specific, EG Versus Control Eye Differences for Each Parameter Within 21 Study Animals
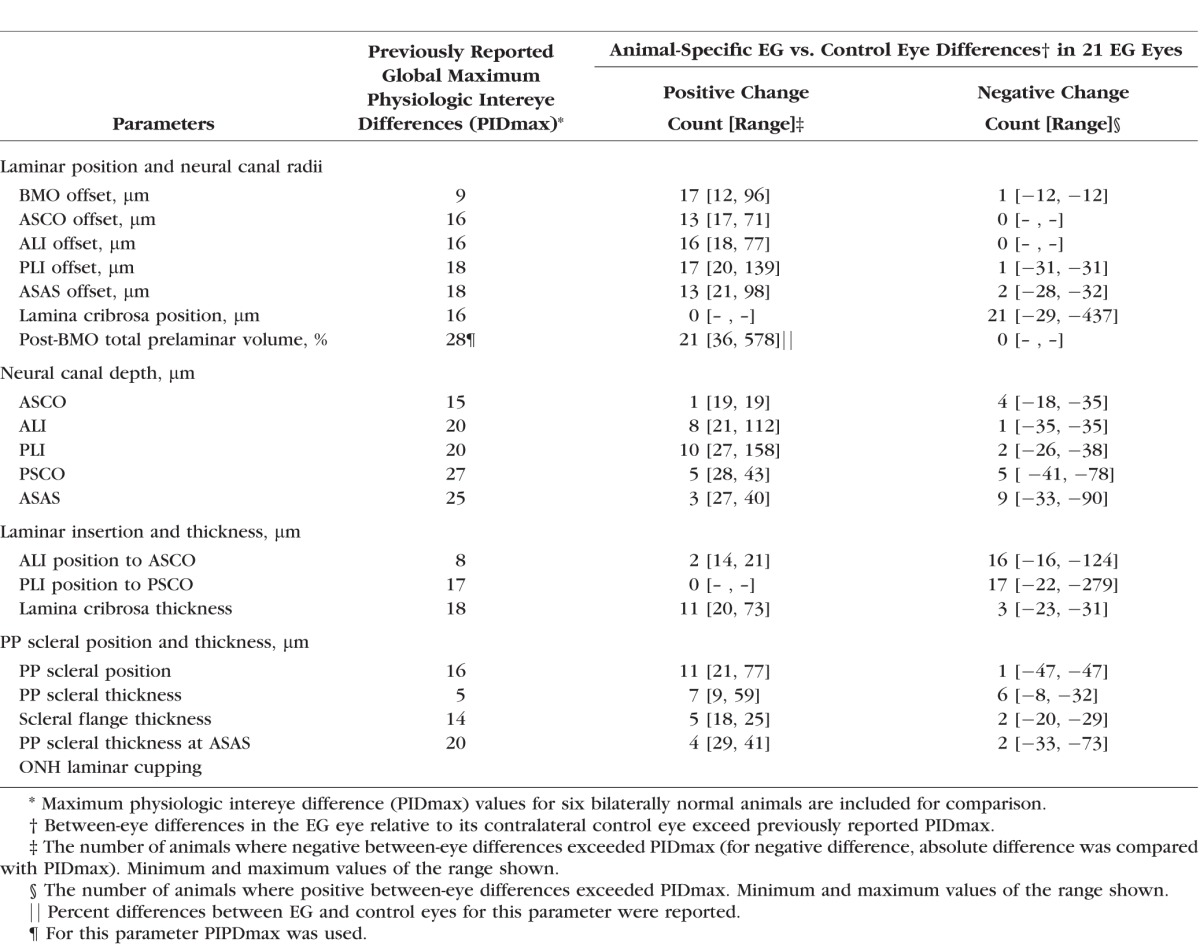
Figure 3.
Experimental glaucoma eye post-BMO total prelaminar volume expansion (A, B) captures three components of ONH connective tissue change in monkey EG in a single parameter: (1) posterior laminar deformation (C), (2) scleral canal expansion (D, E), and (3) posterior (outward) migration of the anterior laminar insertion (F). Animal order (1–21) for this study was determined by the magnitude of the EG versus control eye post-BMO total prelaminar volume percent difference. Post-BMO total prelaminar volume percent difference progressively increases through all 21 EG eyes. While posterior laminar deformation (C) and anterior laminar insertion migration (F) also appear progressive through this range of post- BMO total prelaminar volume expansion, scleral canal expansion at the level of the anterior scleral canal opening (E), and anterior laminar insertion (D) appear to achieve their maximum values by the magnitude of post-BMO total prelaminar volume expansion present in Animal 12 (∼127%, [B]). *The EG versus control eye difference exceeds the PIDmax or PIPDmax value for this parameter in this animal. Data are hatched for the 7 animals in which the EG eye was perfusion-fixed at IOP 30 or 45 mm Hg and are solid for the 14 animals in which the EG eye was perfusion-fixed at IOP 10 mm Hg. Positive EG versus control eye differences are red, negative are blue.
Anterior (Inward) and Posterior (Outward) Migration of the Anterior and Posterior Laminar Insertions
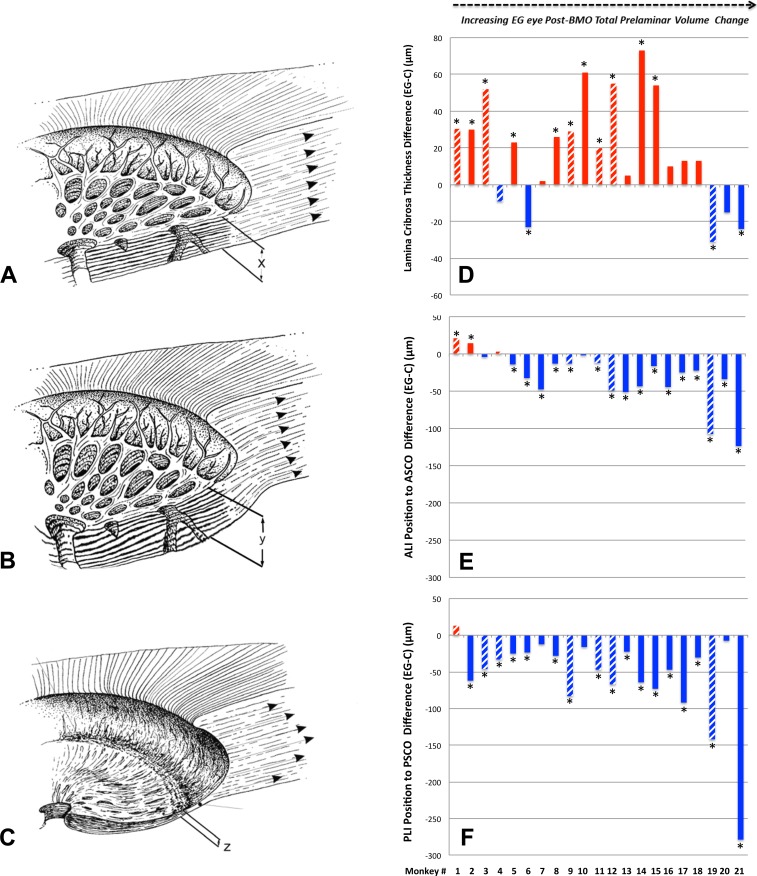
Within the overall analysis (n = 21 animals, Table 3), increases in anterior laminar insertion position (relative to the anterior scleral canal opening), and posterior laminar insertion position (relative to the posterior scleral canal opening) each achieved significance. Significant animal-specific anterior migration of the anterior laminar insertion (Table 4; Figs. 3F, 4E) was present in the 2 EG eyes with the least global deformation (post-BMO total prelaminar volume change). Progressively larger posterior migration of the anterior laminar insertion was detected in the 16 EG eyes demonstrating the largest global deformation. Posterior laminar insertion migration (Fig. 4F) was detected in 17 of 21 EG eyes and was progressively outward, though this occurred in an early diminishing (monkeys 1–6) and later increasing (monkeys 7–21) manner.
Figure 4.
Lamina cribrosa thickness alteration in monkey EG (A–C). Experimental glaucoma versus control eye difference in lamina cribrosa thickness (D), anterior laminar insertion (ALI) position (E), and Posterior laminar insertion position (F) are also shown. While laminar thickness was increased in most EG eyes with early deformation, it was either less thickened or thinned in the most deformed eyes. Anterior (inward) migration of the anterior laminar insertion (E) was present in the two EG eyes with the least deformation. Progressive posterior (outward) migration of the ALI was detected in the 17 EG eyes demonstrating the largest deformation. Posterior laminar insertion migration (F) was outward in early deformation though its magnitude diminished in moderate deformation then progressively increased in the EG eyes with the greatest deformation. Hatched color bars in (D–F) represent EG eyes perfusion fixed at 30 or 45 mm Hg and solid color bars represent EG eyes perfusion fixed at 10 mm Hg. *The EG versus control eye difference exceeds the PIDmax for this parameter in this animal. Positive EG versus control eye differences are red, negative are blue.
Laminar Thickness Change
While laminar thickness was increased within the overall analysis (n = 21 animals, Table 3), Figure 4F demonstrates that animal-specific changes in laminar thickness were bimodal, being: (1) significantly thickened in 11 of the 15 EG eyes demonstrating 36% to 240% EG eye expansions in post-BMO total prelaminar volume (animals 1–15); (2) less thickened (0 of 3 achieving significance) in animals demonstrating from 241% to 279% EG eye expansions in post-BMO total prelaminar volume (animals 16–18); and (3) significantly thinned in 2 of 3 animals demonstrating the greatest overall deformations (animals 19 and 21 demonstrating 320% and 578% EG eye expansions in post-BMO total prelaminar volume, respectively). These data suggest that while the lamina was thickened in most eyes with minimal and moderate deformation, it was less thickened and then thinned in the most deformed eyes. It also suggests that the transition from (mostly) thickened to less thickened and then thinned in the 21 monkeys of this report appears to have occurred at or around overall deformations yielding EG eye post-BMO total prelaminar volume expansions of 240%.
Posterior Bowing and Thickness Change Within the Peripapillary Sclera
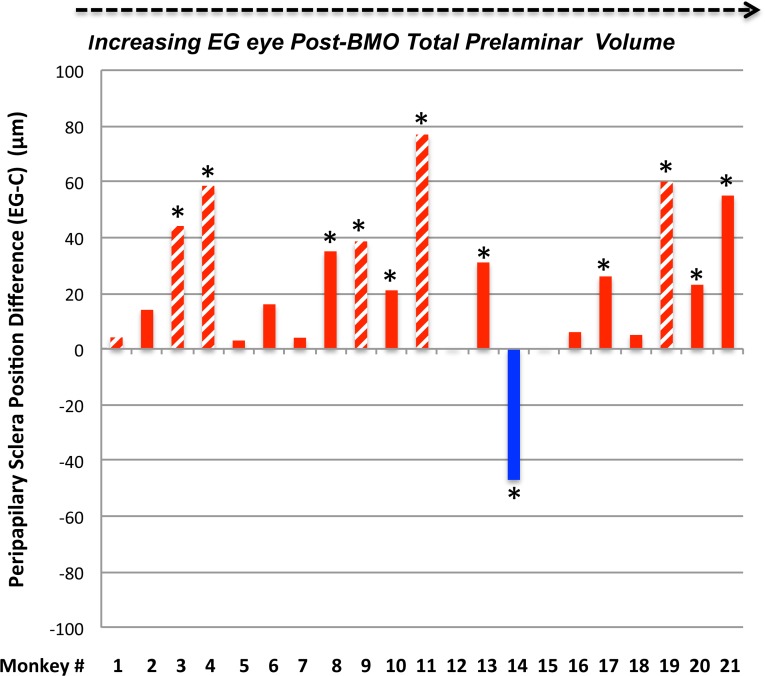
Within the overall analysis, while an increase in the parameter peripapillary scleral position compatible with outward bowing of the peripapillary achieved significance (n = 21 animals, Table 3), EG versus control eye differences in peripapillary scleral thickness, scleral flange thickness, and peripapillary scleral thickness at the anterior most subarachnoid space did not. Table 4 and Figure 5 demonstrate that significant animal-specific increases in peripapillary scleral position were present in 11 EG eyes, with a 12th eye demonstrating a significant decrease. Similar to scleral canal expansion, outward bowing of the peripapillary sclera was not progressive through the full range of overall deformation, achieving its maximum value in eyes with early levels of post-BMO total prelaminar volume expansion. Animal-specific changes in the remaining parameters were less frequent and less consistent in direction.
Figure 5.
Experimental glaucoma eye peripapillary scleral posterior bowing achieves its maximum value at moderate levels of post-BMO total prelaminar volume expansion and is not progressive beyond this point. Hatched color bars in (D–G) represent EG eyes perfusion fixed at 30 or 45 mm Hg and solid color bars represent EG eyes perfusion fixed at 10 mm Hg. *The EG versus control eye difference exceeds the PIDmax for this parameter in this animal. By convention, a positive EG versus control eye difference (red bars) is present when the EG eye peripapillary sclera is more anterior relative to the BMO reference plane of the EG eye than in the control eye (see EG 11 and EG 21 data of Fig. 2). This finding is indirect evidence of posterior peripapillary scleral bowing in the EG eye because as the sclera bows outward BMO and its reference plane assume a position that is “more posterior to” the peripapillary scleral. By convention, a negative EG versus control eye difference (blue bar) is present when the EG eye peripapillary sclera is more posterior relative to the BMO reference plane of the EG eye than in the control eye. Only one animal demonstrates this change (monkey 14). Finally, of all of the connective tissue parameters, peripapillary scleral position may have been most influenced by the level of IOP at the time of fixation. If the hatched bars are removed, the number of eyes demonstrating EG versus control eye differences exceeding 40 μm is reduced from 4 to 1 (monkey 21, only). While the large values among the IOP 30 and 45 mm Hg may also represent fixed deformation (i.e., we cannot be certain they would be smaller at IOP 10 mm Hg), they are compatible with the concept that the range of peripapillary scleral deformation we report may include a reversible component.
Correlations With and Among Connective Tissue Parameters
Correlations With EG Eye Connective Tissue Change (Fig. 6)
Figure 6.
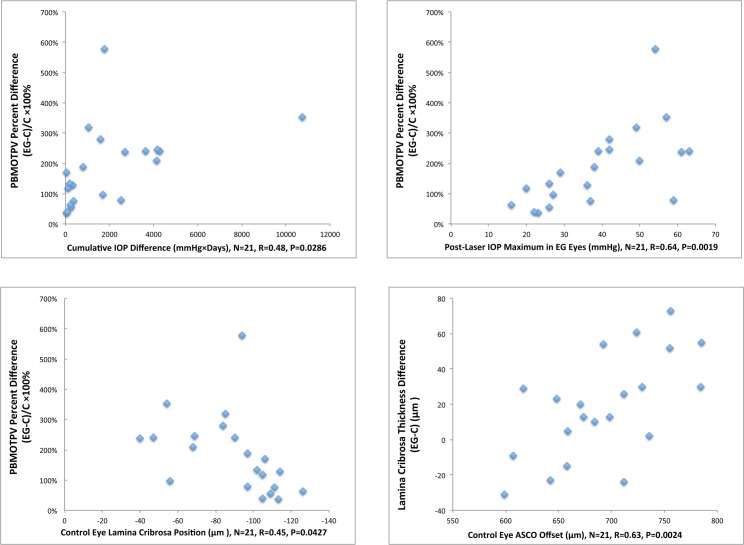
Correlations to predict EG eye connective tissue change. The significant correlations (P < 0.05) among 30 comparisons (see Methods) are shown. Animal-specific values are shown as blue diamonds. None of these correlations achieved the level of significance (P < 0.0017) required to most conservatively account for multiple comparisons (n = 30). PBMOTPV, post-BMO total prelaminar volume; ASCO Offset, an estimate of anterior scleral canal opening size based on its mean radius; C, Control.
. Among the tested correlations, (see Methods), control eye lamina cribrosa position correlated to EG eye post-BMO total prelaminar volume percent change (R = 0.45, P = 0.0427) with a shallow control eye lamina cribrosa position predicting greater EG eye change. Control eye anterior scleral canal opening offset positively correlated to EG eye laminar thickness difference (R = 0.63, P = 0.0024). Finally, EG eye cumulative IOP insult and EG eye maximum IOP correlated to EG eye post-BMO total prelaminar volume percent change (R = 0.48, P = 0.0286, and R = 0.64, P = 0.0019, respectively) with a greater cumulative IOP insult or maximum IOP predicting greater EG eye post-BMO total prelaminar volume change. However, none of these correlations achieved the level of significance (P < 0.0017) required to most conservatively account for multiple comparisons (n = 30).
Correlations Between CSLT MPD, CSLT Rim Area, and Post-BMO Total Prelaminar Volume (Fig. 7)
Figure 7.
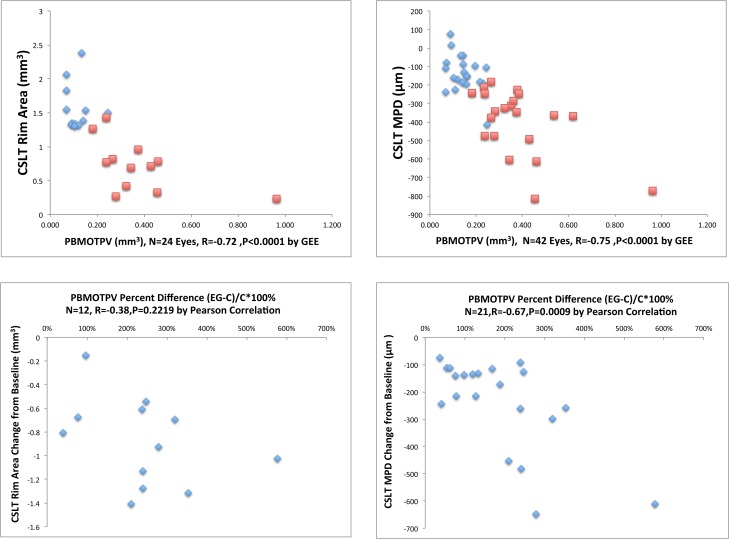
Correlations between CSLT MPD, CSLT rim area and post-BMO total prelaminar volume. Data for all four explored correlations are shown. In the upper left and right data plots, blue diamonds are control eye data points and red squares are EG eye data points. In the lower left and right data plots, blue diamonds are animal-specific data points. All of the significant correlations (P < 0.05) achieved the level of significance (P < 0.0125) required to most conservatively account for multiple comparisons (n = 4).
. Confocal scanning laser tomographic rim area correlated with post-BMO total prelaminar volume within the 12 control and 12 EG eyes for which measurements were available (n = 24 eyes, R = −0.72, P < 0.0001), as did CSLT MPD (n = 42 eyes, R = −0.75, P < 0.0001). Experimental glaucoma eye MPD change from baseline correlated with EG versus control eye post-BMO total prelaminar volume percent difference (n = 21 EG eyes, R = −0.67, P = 0.0009). However EG eye rim area change from baseline did not correlate with EG versus control eye post-BMO total prelaminar volume difference (n = 12 eyes, R = −0.38, P = 0.2219). All of the significant correlations achieved the level of significance (P < 0.0125) required to most conservatively account for multiple comparisons (n = 4).
Correlations With Optic Nerve Axon Counts (Fig. 8)
Figure 8.
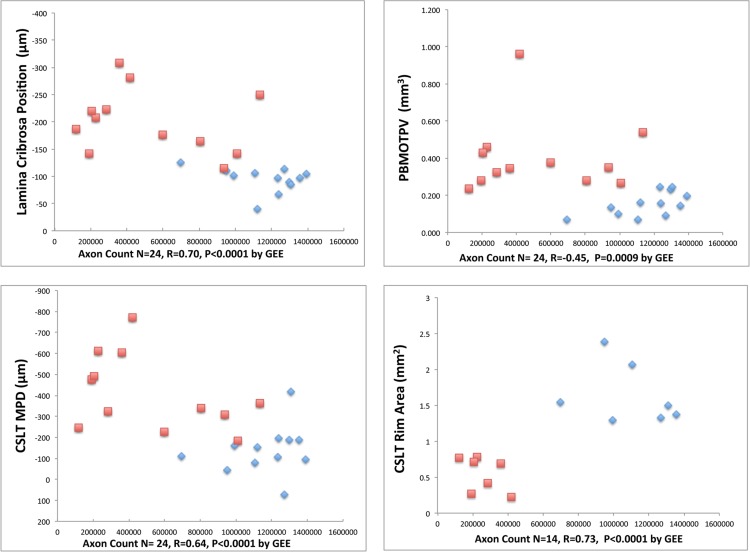
Correlations between CSLT parameters, connective tissue parameters, and axon counts. Data for four of eight explored correlations are shown. Blue diamonds are control eye data points and red squares are EG eye data points. Each of these correlations achieved the level of significance (P < 0.0063) required to most conservatively account for multiple comparisons (n = 8). All correlations between EG eye change from baseline or EG versus control eye differences with EG versus control eye axon count differences were not significant (P < 0.05; see Methods).
. Correlations with optic nerve axon counts were significant for: CSLT MPD (n = 24 eyes, R = 0.64, P < 0.0001), CSLT rim area (n = 14 eyes, R = 0.73, P = 0.0001), post-BMO total prelaminar volume (n = 24 eyes, R = −0.45, P = 0.0009), and laminar position (n = 12 animals, R = 0.70, P < 0.0001). Each of these correlations achieved the level of significance (P < 0.0063) required to most conservatively account for multiple comparisons (n = 8). All correlations between EG eye change from baseline or EG versus control eye differences with EG versus control eye axon count differences were not significant.
Discussion
We have identified five connective tissue components of ONH cupping in monkey EG: (1) laminar deformation, (2) scleral canal expansion, (3) laminar insertion migration, (4) laminar thickness change, and (5) posterior bowing of the peripapillary sclera using data from 21 unilateral EG monkeys ordered by a surrogate of global EG eye ONH connective tissue deformation, our parameter post-BMO total prelaminar volume. Our findings suggest that the parameter post-BMO total prelaminar volume7 is important in glaucoma because it quantifies overall laminar/scleral deformation by capturing three of these components (laminar deformation, anterior scleral canal expansion, and anterior laminar insertion migration) in a single parameter that may eventually be measurable using SDOCT.16,17,27
Experimental glaucoma versus control eye differences in post-BMO total prelaminar volume ranged from 36% to 578% in the 21 EG eyes and were progressive, by which we mean there was no evidence that a maximum value was achieved. While posterior laminar deformation and laminar insertion migration were also progressive, scleral canal expansion and posterior peripapillary scleral deformation achieved their maxima within EG eyes that had achieved moderate levels of post-BMO total prelaminar volume expansion (approximately 130%, for scleral canal expansion, monkeys 9 and 10, Fig. 3; and 169% for posterior peripapillary scleral deformation, monkey 11, Fig. 5). While the lamina cribrosa was thickened within 11 of the first 15 EG eyes (monkeys 1–15, 36%–24% post-BMO total prelaminar volume expansion), it was less thickened in the next three EG eyes (monkeys 16–18, 241%–279% post-BMO total prelaminar volume expansion) and was significantly thinned in two of the final three EG eyes (monkeys 19–21, 320%–578% post-BMO total prelaminar volume expansion).
The cross-sectional findings of this report are important for two reasons. First, they suggest that a single volumetric parameter like post-BMO total prelaminar volume may, by itself, or by its change over time, provides a measure that “orders” overall laminar/scleral connective tissue deformation and remodeling, and in so doing allows for its staging and phenotyping in glaucoma. Second, they identify the principal components of connective tissue alteration which allows for their respective mechanisms and respective links to RGC axonal insult to be the subject of future studies.
Regarding the mechanistic implications of our findings, we have previously proposed that laminar thickness change as well as anterior and posterior laminar insertion migration are separate manifestations of glaucomatous ONH connective tissue remodeling, failed remodeling, and/or mechanical failure.9,10 Previous finite element modeling33 has predicted that the lamina should thicken in response to elevated IOP, and that its anterior insertion should migrate anteriorly and its posterior insertion should migrate posteriorly as part of this process. The fact that the two EG eyes with the least amount of overall deformation (monkeys 1 and 2) demonstrate inward anterior laminar insertion migration, suggests that inward migration of the anterior laminar insertion represents an initial stage of connective tissue remodeling.33 Our cross-sectional data also suggest, but do not prove, that as global ONH connective tissue deformation increases, inward anterior laminar insertion migration transitions to outward migration, which is subsequently progressive. The longitudinal detection of anterior laminar insertion migration17 is therefore important for two reasons. First, using current OCT imaging, it may be linked to nerve fiber layer (NFL) hemorrhages,16 NFL defects,34 visual field progression,35 and the development of acquired optic disc pits.36 Second, it may confirm the relative timing of its direction (i.e., inward during initial deformation, outward as deformation progresses) suggested by our cross-sectional findings.
Regarding posterior laminar insertion migration, we propose that outward posterior laminar insertion migration is a prominent component of laminar remodeling in response to chronic IOP elevation in the monkey eye. While it is possible that anterior and posterior laminar insertion migrations are completely independent, it is also possible that outward anterior laminar insertion migration contributes to the mechanisms driving outward posterior laminar insertion remodeling. In this regard, the suggestion in our data (Fig. 4F) that outward migration of the posterior laminar insertion occurs in an initial phase that diminishes and is followed by a phase which progressively increases, may reflect a transition from anterior and posterior laminar insertion remodeling that stabilizes the insertions to posterior laminar insertion remodeling which is driven by outward migration of the anterior laminar insertion.
Regarding the implications for phenotyping, our data suggest that all “cupping,” regardless of etiology and the level of IOP at which it occurs, should be evaluated for the presence or progression of posterior laminar and peripapillary scleral deformation, scleral canal expansion, laminar insertion migration, and lamina thickness change.20 Shallow forms of cupping can be due to neuroretinal rim loss alone, and can confound the clinical interpretation of all forms of optic neuropathy.19,20 While the mechanistic, predictive and treatment implications of their detection are not yet certain, we propose that in any optic neuropathy, the presence or progression of the connective tissue phenomena we describe suggest that an IOP-related mechanism may be present whether or not an IOP-related insult is the primary cause of the neuropathy and without regard for the level of IOP at which the primary insult or progression has occurred. In these regards, while our own longitudinal study detected progressive laminar deformation using SDOCT early in monkey EG,25 two subsequent studies have failed to demonstrate SDOCT-detected laminar deformation in the monkey experimental optic neuropathies of surgical CSF lowering37 and surgical optic nerve transection (Ing E, et al. IOVS 2015;56:ARVO E-Abstract 999).
Regarding risk prediction, while it is not surprising that cumulative IOP insult and maximum IOP both correlated to the magnitude of EG eye ONH connective tissue deformation, the fact that the correlation was stronger for maximum IOP than for cumulative IOP insult bears comment. We have previously reported that maximum IOP was the most important predictor of the rate of CSLT-detected ONH surface change and SDOCT RNFLT change in 59 unilateral EG animals (in which the current group of 21 EG eyes were included).31 While the data in this report are from postmortem tissues and therefore cross-sectional, they suggest that the ONH connective tissue alterations which underlie both ONH surface and RNFLT change, may themselves be influenced by the maximum level of IOP experienced by the tissue with the duration of IOP exposure less significant. This observation will be more powerfully studied when telemetric IOP measurements in the monkey EG model38 allow for a more accurate characterization of what duration of exposure at what level of IOP is most important.
However, our data should not only reflect the magnitude and duration of hydrostatic insult, they should also reflect ONH and peripapillary structural stiffness and viscoelasticity, neither of which was directly characterized in this study. While age has been shown to “stiffen” the monkey ONH and scleral connective tissues,19,39–43 it cannot be assumed that individual aged eyes are stiff or that aged and young eyes remodel in the same manner.10,18 Monkey 5 was 8.1 years of age, experienced a maximum IOP of 37 mm Hg during 55 postlaser days of IOP elevation before euthanization and demonstrated a 77% EG eye expansion in post-BMO total prelaminar volume. Monkey 6 was 15.6 years of age and experienced a max IOP of 59 mm Hg, over 245 postlaser days of IOP elevation before euthanization and achieved the same magnitude of connective tissue deformation (77%). These data suggest that the ONH connective tissues of monkey 6 were stiffer than monkey 5, as we would expect given their difference in age.
However, monkey 21 was 21 years of age (the oldest animal in the study) and experienced a max IOP of 54 mm Hg, which is not as high as Monkey 6, for only 97 postlaser days, yet demonstrated the largest amount of overall deformation—a 578% increase in post-BMO total prelaminar volume. These data suggest that monkey 21's tissues were much more compliant than monkey 6, despite its advanced age. While in vivo measures of laminar and peripapillary scleral stiffness and viscoelasticity are necessary to predict reversible, eye-specific connective tissue deformation, the propensity of an individual ONH to remodel should be influenced not just by deformation but also separately by age and other factors. Studies addressing these issues are ongoing in our laboratory.
The fact that the control eye anterior scleral canal opening offset (size) directly correlated with the magnitude of EG eye laminar thickening also bears comment. In glaucoma, we assume “disc size” to be a risk factor that contributes to ONH susceptibility without articulating the separate mechanisms by which this may be true. The smallest opening through which the axons pass, which may be BMO or the anterior scleral canal opening or some combination of both (when the disc is tilted), may determine the number of axons that can pass through it and/or otherwise influence the distribution of rim and cup (requiring correction [or normalization] of both for it). However, separate from these considerations, from a biomechanical standpoint, it is the size and shape of the scleral canal that likely determines the distribution of IOP-related load within the laminar connective tissues.5,44,45
Thus, it makes sense that the size and shape of the scleral canal might have direct effects on how the ONH connective tissues deform and remodel under the influence of chronic IOP elevation. These direct effects of “disc size” on the connective tissues might also translate to direct and indirect effects on RGC axon susceptibility that are separate from the “effect” of “disc size” on rim tissue distribution in healthy eyes. However, previous finite element modeling results differ on the relative importance of scleral canal dimensions on ONH biomechanics. Bellezza et al.46 reported larger scleral canal diameter, elongation of the canal, and thinning of the sclera increased IOP-related stress (force/cross-sectional area or the distribution of load) for a given level of IOP. For all models, maximum IOP-related stress ranged from 6 × IOP (posterior sclera) to 122 × IOP (laminar trabecula) using theoretical geometries with the highest values achieved by large elliptical scleral canals within thin peripapillary sclera. Sigal et al.44 reported that the geometry of the ONH had only modest effects on the median and peak levels of three components of strain (local, microscopic tissue stretch, compression, or bending) within eye-specific models of 10 human cadaver eyes. In a companion paper,45 they found that material properties had a much larger effect than geometry on ONH connective tissue strain, which may be the engineering effect that most influences astrocyte and RGC axon mechanobiology.10,12,47 The influence of anterior scleral canal opening size and shape on connective tissue change in glaucoma will need to be assessed within prospective longitudinal studies in which this aspect of ONH geometry is assessed using OCT or other vivo techniques.26,48–50
Finally, while laminar thickness change does not directly contribute to clinical phenotype, a large effort is underway to measure laminar thickness using OCT.51 Our cross-sectional findings suggest that the lamina initially deforms and thickens in response to chronic IOP elevation in most monkey eyes. If EG eye IOP is left untreated, the lamina eventually thins from this thickened state which, in the most deformed eyes, leaves it thinner than the lamina of its contralateral control eye. This transition from laminar thickening, through thinning of a thickened lamina, to the point of being thinner than the contralateral control eye, can only be inferred from our cross-sectional data. Longitudinal SDOCT studies to confirm these cross-sectional findings are now underway in monkey and human glaucoma.
With regard to the need for longitudinal studies, two additional concerns are important to articulate. By choosing to order the animals in this study by the magnitude of change in overall connective tissue deformation we have made the assumption that the process of connective tissue deformation and remodeling goes through similar stages in all eyes. The assumption that the phenomena we identify (within cross-sectional postmortem data) will occur longitudinally when all of the same ONH anatomy is manually delineated within SDOCT ONH and RNFL data sets performed every 2 weeks over the full extent of postlaser change requires confirmation. This hypothesis is at present unproven and will need to be established within ongoing studies in our own and others' laboratories.
Separate from this concern, our concept of staging the neuropathy of glaucoma in terms of its connective tissue components is controversial. Traditional staging of glaucoma is based on direct or indirect measures of RGC axon or somal injury alone. Our concept is not that RGC axonal injury and loss is not important, because of course, it is the final common pathway to vision loss in this disease. Our concept instead is that RGC axonal injury within the ONH may not be the only organizing pathophysiology of aging and glaucoma within the ONH tissues. To identify the cellular and molecular drivers of glaucomatous ONH pathophysiology may require multiple levels of staging, down to the level of genomic and proteomic characterizations of cellular change (Refs. 52–55; Burgoyne CF, et al. IOVS 2014;55:ARVO E-Abstract 4555; Stowell C, et al. IOVS 2014;55:ARVO E-Abstract 5034; Crabb JS, et al. IOVS 2014;55:ARVO E-Abstract 5704). This concept is not controversial, being under study in many laboratories, in multiple species and within multiple sites of injury, not just the ONH.
Our method for 3D histomorphometric reconstruction has limitations which have been previously discussed.6,7,14 Our measurements within the reconstructions were made relative to a BMO reference plane6,7,14 so as to be consistent with our previous reports. Any posterior bending of BMO relative to the ASCO, collapse of the border tissue of Elshnig, or compression of the choroid,56 could alter these points leading to a posterior shift or tilt of the reference plane in the EG eye. However, we detected a significant decrease in the distance between BMO and the ASCO in only 4 of 21 EG eyes (as a negative change in the parameter anterior scleral canal opening depth (animals 4, 11, 13, and 19, respectively). When we recalculated both laminar position and post-BMO total prelaminar volume using a reference plane based on the anterior scleral canal opening rather than BMO, neither the animal order of deformation nor the significant correlations were significantly altered (data not shown).
Our measurements characterize ONH connective tissue “permanent” deformation within 14 of the EG eyes because they were fixed after 30 to 60 minutes of manometer controlled IOP 10 mm Hg, and total deformation (the combination of permanent plus reversible—see opening paragraphs) within seven EG eyes because the EG eye was fixed after 15 to 30 minutes of either 30 or 45 mm Hg as part of their primary study. We believe that the 21 EG eyes of this report accurately characterize the principal components of fixed ONH connective tissue change in monkey EG, though they may overestimate the range of the subset of parameters which measure “reversible” phenomena. Table 3 reports the overall mean values for the control (n = 21, IOP 10 mm Hg), EG 10 (n = 14, IOP 10 mm Hg), and EG 10/30/45 (n = 21, IOP 10, 30, and 45 mm Hg) eyes. The mean values of the EG 10 and EG 10/30/45 groups are virtually identical. All that is different is that fewer parameters are significant in the EG 10 group because of the loss of power. Supplementary Table S4 reports the range of animal-specific EG versus control eye difference within the 14 EG 10 compared with the 21 EG 10/30/45 animals. Bruch's membrane opening offset, posterior laminar insertion (PLI) offset, ASCO depth, anterior laminar insertion (ALI) depth, and PLI depth demonstrate expansion of the range in at least one direction that could be reversible, though this is not certain. Ignoring the high IOP animals (hatched bars) within Figures 3, 4, and 5 does not change our interpretation of the animal-specific results. These issues will be revisited within a separate group of 28 EG monkeys that have been perfusion fixed with both eyes at IOP 10 mm Hg and are currently undergoing postmortem 3D reconstruction.
Sixteen of the study monkeys were Rhesus Macaques and five were Cynomolgus. In previous publications, we looked for species effects within normal monkey eyes perfusion fixed at IOP 10 mm Hg,14,57 healthy eyes perfusion fixed at IOP 30 and 45 mm Hg,57 and early EG eyes perfusion fixed at 10, 30, or 45 mm Hg.9,24 In all instances, we could find no obvious species effect on ONH anatomy or behavior. In the present study, there are no significant differences between the control Cynomolgus and Rhesus eyes for any parameter (t-test, P > 0.0026, 19 comparisons).
Finally, regarding the eventual application of our findings to the staging and phenotyping of human glaucoma, the following issues are pertinent. On average the monkey ONH and sclera are likely more compliant than humans both because the sclera and lamina are thinner,14,44,45,58 and their material properties are less stiff.39–41 In both species, the sclera has been shown to stiffen with age, but at all ages monkey sclera is, on average, more compliant than human sclera.39–41 While the animals in this study are not young (defined as age < 3.0), ranging in age from 5 to 21 years, their range of structural stiffness is likely to be less than humans. Also while mean EG eye postlaser IOP ranged from 11 to 32 mm Hg, which is well within the range of untreated human glaucoma, peak EG eye postlaser IOP ranged from 16 to 63. Among the 21 EG eyes, peak IOP was 30 mm Hg or less in eight, 40 mm Hg or less in four, 50 mm Hg or less in four and greater than 50 in five animals. Most human glaucoma occurs either at levels of detected IOP that are not elevated59,60 or, if elevated, at detected levels of IOP that do not exceed 40 mm Hg.59,61,62 Taken together, these data suggest that the deformation component of the connective tissue alterations we describe may be larger, for a given level of IOP elevation, than would likely be present in humans, and may be larger and more rapid in their occurrence because of the magnitude of IOP elevation.
Separate from the issues of IOP insult and structural stiffness outlined above, it is possible that for a given stimulus (i.e., mechanoreceptor stimulation, hypoxia, inflammatory cytochines, etc.) monkey astrocytes and scleral fibroblasts remodel more aggressively than humans.10,12 If this is true, the laminar insertion migration and thickness changes we describe may not occur as obviously or as frequently in human eyes or may be more applicable to younger patients (infantile, juvenile, young adult, and otherwise compliant), early in ocular hypertension.17
However, it is also true that within monkeys there will be a range of behavior demonstrated by eyes that are more or less stiff, possess thinner versus thicker tissues, and are from young versus old animals. Indeed, among the 12 animals with optic nerve axon counts, Monkeys 1, 2, and 3 (6 to 9.7 years old) are striking for the magnitude of EG eye axon loss they demonstrate (27.5%–73%) in the setting of modest IOP insults and minimal connective tissue change. This is especially true of monkey 2, in which EG eye axon loss was 73%, the maximum detected postlaser IOP was 22 mm Hg, and the cumulative IOP insult was 99 mm Hg × days. This susceptibility is in contrast to monkeys 8 and 10, which are similar in age, had similar or higher levels of IOP insult, demonstrated larger connective tissue alterations but EG eye axon losses that were substantially lower (−16.4% and −12.4%, respectively). We will eventually employ principal components analyses63 in an expanded group of animals to attempt to identify the relationships that drive monkey ONH connective tissue and RGC axon susceptibility to damage. We predict that these relationships will ultimately inform staging, phenotyping, and susceptibility prediction in human glaucoma.
In summary, our cross-sectional, postmortem ONH reconstructions from 21 animals spanning early to end-stage CSLT progression and optic nerve axon loss in their EG eyes suggest that there are five morphologically recognizable connective tissue components of glaucomatous cupping in monkey EG. The components of this response are important because they underlie the eye-specific clinical phenotype of glaucoma, provide insight into its pathophysiologic mechanisms, and suggest a conceptual framework for staging connective tissue alteration in glaucoma that is independent of (but related to) RGC axon or somal loss. We believe they should be structural targets for OCT detection and quantification in all forms of optic neuropathy, regardless of etiology and regardless of the level of IOP at which it occurs.64 Regional change in each 3D histomorphometric parameter characterized relative to the fovea-to-BMO axis of each eye,29 as well as global and regional laminar microarchitectural change29 within the 21 EG eyes of this study, will be the subject of future reports. How RGC axons are damaged in the presence of the connective tissue phenomena we describe, their sequence, and their underlying cellular mechanisms are currently under study in a separate cohort of animals.10,20
Supplementary Material
Acknowledgments
The authors thank the following individuals for their assistance with this study: Juan Reynaud and Jonathan Grimm for their assistance with software for volumetric parameter quantification, Pris Zhou and Wenxia Wang for animal testing, Anthony Bellezza, PhD, for his direction of animal testing, and Lirong Qin and Joanne Couchman for their assistance with manuscript preparation and submission.
Supported in part by United States Public Heath Service Grant R01EY011610 (CFB) from the National Eye Institute, National Institutes of Health, Bethesda, Maryland, United States; a grant from the American Health Assistance Foundation, Rockville, Maryland, United States (CFB); a grant from The Whitaker Foundation, Arlington, Virginia, United States (CFB); a Career Development Award from Research to Prevent Blindness, New York, New York, United States (CFB); The Legacy Good Samaritan Foundation, Portland, Oregon, United States; and the Sears Trust for Biomedical Research, Mexico, Missouri, United States.
Disclosure: H. Yang, None; R. Ren, None; H. Lockwood, None; G. Williams, None; V. Libertiaux, None; C. Downs, None; S.K. Gardiner, None; C.F. Burgoyne, Heidelberg Engineering (F, C, R), Reichert Instruments (F), Allergan, Ltd. (R)
References
- 1. Kalvin NH,, Hamasaki DI,, Gass JD. Experimental glaucoma in monkeys. I. Relationship between intraocular pressure and cupping of the optic disc and cavernous atrophy of the optic nerve. Arch Ophthalmol. 1966; 76: 82–93. [DOI] [PubMed] [Google Scholar]
- 2. Quigley HA,, Addicks EM. Chronic experimental glaucoma in primates. II. Effect of extended intraocular pressure elevation on optic nerve head and axonal transport. Invest Ophthalmol Vis Sci. 1980; 19: 137–152. [PubMed] [Google Scholar]
- 3. Furuyoshi N,, Furuyoshi M,, May CA,, et al. Vascular and glial changes in the retrolaminar optic nerve in glaucomatous monkey eyes. Ophthalmologica. 2000; 214: 24–32. [DOI] [PubMed] [Google Scholar]
- 4. Jonas JB,, Hayreh SS,, Yong T. Thickness of the lamina cribrosa and peripapillary sclera in Rhesus monkeys with nonglaucomatous or glaucomatous optic neuropathy. Acta Ophthalmol. 2011; 89: e423–e427. [DOI] [PubMed] [Google Scholar]
- 5. Burgoyne CF,, Downs JC,, Bellezza AJ,, et al. The optic nerve head as a biomechanical structure: a new paradigm for understanding the role of IOP-related stress and strain in the pathophysiology of glaucomatous optic nerve head damage. Prog Retin Eye Res. 2005; 24: 39–73. [DOI] [PubMed] [Google Scholar]
- 6. Yang H,, Downs JC,, Girkin C,, et al. 3-D histomorphometry of the normal and early glaucomatous monkey optic nerve head: lamina cribrosa and peripapillary scleral position and thickness. Invest Ophthalmol Vis Sci. 2007; 48: 4597–4607. [DOI] [PMC free article] [PubMed] [Google Scholar]
- 7. Yang H,, Downs JC,, Bellezza A,, et al. 3-D histomorphometry of the normal and early glaucomatous monkey optic nerve head: prelaminar neural tissues and cupping. Invest Ophthalmol Vis Sci. 2007; 48: 5068–5084. [DOI] [PubMed] [Google Scholar]
- 8. Downs JC,, Yang H,, Girkin C,, et al. Three-dimensional histomorphometry of the normal and early glaucomatous monkey optic nerve head: neural canal and subarachnoid space architecture. Invest Ophthalmol Vis Sci. 2007; 48: 3195–3208. [DOI] [PMC free article] [PubMed] [Google Scholar]
- 9. Yang H,, Williams G,, Downs JC,, et al. Posterior (outward) migration of the lamina cribrosa and early cupping in monkey experimental glaucoma. Invest Ophthalmol Vis Sci. 2011; 52: 7109–7121. [DOI] [PMC free article] [PubMed] [Google Scholar]
- 10. Burgoyne CF. A biomechanical paradigm for axonal insult within the optic nerve head in aging and glaucoma. Exp Eye Res. 2011; 93: 120–132. [DOI] [PMC free article] [PubMed] [Google Scholar]
- 11. Roberts MD,, Grau V,, Grimm J,, et al. Remodeling of the connective tissue microarchitecture of the lamina cribrosa in early experimental glaucoma. Invest Ophthalmol Vis Sci. 2009; 50: 681–690. [DOI] [PMC free article] [PubMed] [Google Scholar]
- 12. Hernandez MR. The optic nerve head in glaucoma: role of astrocytes in tissue remodeling. Prog Retin Eye Res. 2000; 19: 297–321. [DOI] [PubMed] [Google Scholar]
- 13. Downs JC,, Roberts MD,, Sigal IA. Glaucomatous cupping of the lamina cribrosa: a review of the evidence for active progressive remodeling as a mechanism. Exp Eye Res. 2011; 93: 133–140. [DOI] [PMC free article] [PubMed] [Google Scholar]
- 14. Yang H,, Downs JC,, Burgoyne CF. Physiologic intereye differences in monkey optic nerve head architecture and their relation to changes in early experimental glaucoma. Invest Ophthalmol Vis Sci. 2009; 50: 224–234. [DOI] [PMC free article] [PubMed] [Google Scholar]
- 15. Grytz R,, Girkin CA,, Libertiaux V,, et al. Perspectives on biomechanical growth and remodeling mechanisms in glaucoma. Mech Res Commun. 2012; 42: 92–106. [DOI] [PMC free article] [PubMed] [Google Scholar]
- 16. Lee EJ,, Kim TW,, Kim M,, et al. Recent structural alteration of the peripheral lamina cribrosa near the location of disc hemorrhage in glaucoma. Invest Ophthalmol Vis Sci. 2014; 55: 2805–2815. [DOI] [PubMed] [Google Scholar]
- 17. Lee KM,, Kim TW,, Weinreb RN,, et al. Anterior lamina cribrosa insertion in primary open-angle glaucoma patients and healthy subjects. PLoS One. 2014; 9: e114935. [DOI] [PMC free article] [PubMed] [Google Scholar]
- 18. Burgoyne CF,, Downs JC. Premise and prediction-how optic nerve head biomechanics underlies the susceptibility and clinical behavior of the aged optic nerve head. J Glaucoma. 2008; 17: 318–328. [DOI] [PMC free article] [PubMed] [Google Scholar]
- 19. Ren R,, Yang H,, Gardiner SK,, et al. Anterior lamina cribrosa surface depth, age, and visual field sensitivity in the Portland Progression Project. Invest Ophthalmol Vis Sci. 2014; 55: 1531–1539. [DOI] [PMC free article] [PubMed] [Google Scholar]
- 20. Burgoyne C. The morphological difference between glaucoma and other optic neuropathies. J Neuroophthalmol. 2015; 35 (suppl 1): S8–S21. [DOI] [PMC free article] [PubMed] [Google Scholar]
- 21. Morgan JE. Optic nerve head structure in glaucoma: astrocytes as mediators of axonal damage. Eye. 2000; 14 (pt 3B): 437–444. [DOI] [PubMed] [Google Scholar]
- 22. Heickell AG,, Bellezza AJ,, Thompson HW,, et al. Optic disc surface compliance testing using confocal scanning laser tomography in the normal monkey eye. J Glaucoma. 2001; 10: 369–382. [DOI] [PubMed] [Google Scholar]
- 23. Burgoyne CF,, Downs JC,, Bellezza AJ,, et al. Three-dimensional reconstruction of normal and early glaucoma monkey optic nerve head connective tissues. Invest Ophthalmol Vis Sci. 2004; 45: 4388–4399. [DOI] [PubMed] [Google Scholar]
- 24. Yang H,, Thompson H,, Roberts MD,, et al. Deformation of the early glaucomatous monkey optic nerve head connective tissue after acute IOP elevation in 3-D histomorphometric reconstructions. Invest Ophthalmol Vis Sci. 2011; 52: 345–363. [DOI] [PMC free article] [PubMed] [Google Scholar]
- 25. He L,, Yang H,, Gardiner SK,, et al. Longitudinal detection of optic nerve head changes by spectral domain optical coherence tomography in early experimental glaucoma. Invest Ophthalmol Vis Sci. 2014; 55: 574–586. [DOI] [PMC free article] [PubMed] [Google Scholar]
- 26. Strouthidis NG,, Yang H,, Reynaud JF,, et al. Comparison of clinical and spectral domain optical coherence tomography optic disc margin anatomy. Invest Ophthalmol Vis Sci. 2009; 50: 4709–4718. [DOI] [PMC free article] [PubMed] [Google Scholar]
- 27. Burgoyne CF. The non-human primate experimental glaucoma model [published online ahead of print June 9, 2015]. Exp Eye Res. doi:http://dx.doi.org/10.1016/j.exer.2015.06.005. [DOI] [PMC free article] [PubMed]
- 28. Strouthidis NG,, Yang H,, Downs JC,, et al. Comparison of clinical and three-dimensional histomorphometric optic disc margin anatomy. Invest Ophthalmol Vis Sci. 2009; 50: 2165–2174. [DOI] [PMC free article] [PubMed] [Google Scholar]
- 29. Lockwood H,, Reynaud J,, Gardiner S,, et al. Lamina cribrosa microarchitecture in normal monkey eyes part 1: methods and initial results. Invest Ophthalmol Vis Sci. 2015; 56: 1618–1637. [DOI] [PMC free article] [PubMed] [Google Scholar]
- 30. Rosner B. 12.9. The intraclass correlation coefficient. : Rosner B ed Fundamentals of Biostatistics. Boston, MA: Harvard University, Brooks/Cole Cengage Learning; 2011: 569. [Google Scholar]
- 31. Gardiner SK,, Fortune B,, Wang L,, et al. Intraocular pressure magnitude and variability as predictors of rates of structural change in non-human primate experimental glaucoma. Exp Eye Res. 2012; 103: 1–8. [DOI] [PMC free article] [PubMed] [Google Scholar]
- 32. Reynaud J,, Cull G,, Wang L,, et al. Automated quantification of optic nerve axons in primate glaucomatous and normal eyes–method and comparison to semi-automated manual quantification. Invest Ophthalmol Vis Sci. 2012; 53: 2951–2959. [DOI] [PMC free article] [PubMed] [Google Scholar]
- 33. Grytz R,, Sigal IA,, Ruberti JW,, et al. Lamina cribrosa thickening in early glaucoma predicted by a microstructure motivated growth and remodeling approach. Mech Mater. 2012; 44: 99–109. [DOI] [PMC free article] [PubMed] [Google Scholar]
- 34. Tatham AJ,, Miki A,, Weinreb RN,, et al. Defects of the lamina cribrosa in eyes with localized retinal nerve fiber layer loss. Ophthalmology. 2014; 121: 110–118. [DOI] [PMC free article] [PubMed] [Google Scholar]
- 35. Faridi OS,, Park SC,, Kabadi R,, et al. Effect of focal lamina cribrosa defect on glaucomatous visual field progression. Ophthalmology. 2014; 121: 1524–1530. [DOI] [PubMed] [Google Scholar]
- 36. You JY,, Park SC,, Su D,, et al. Focal lamina cribrosa defects associated with glaucomatous rim thinning and acquired pits. JAMA Ophthalmol. 2013; 131: 314–320. [DOI] [PubMed] [Google Scholar]
- 37. Yang D,, Fu J,, Hou R,, et al. Optic neuropathy induced by experimentally reduced cerebrospinal fluid pressure in monkeys. Invest Ophthalmol Vis Sci. 2014; 55: 3067–3073. [DOI] [PubMed] [Google Scholar]
- 38. Downs JC,, Burgoyne CF,, Seigfreid WP,, et al. 24-hour IOP telemetry in the nonhuman primate: implant system performance and initial characterization of IOP at multiple timescales. Invest Ophthalmol Vis Sci. 2011; 52: 7365–7375. [DOI] [PMC free article] [PubMed] [Google Scholar]
- 39. Girard MJ,, Suh JK,, Bottlang M,, et al. Scleral biomechanics in the aging monkey eye. Invest Ophthalmol Vis Sci. 2009; 50: 5226–5237. [DOI] [PMC free article] [PubMed] [Google Scholar]
- 40. Coudrillier B,, Tian J,, Alexander S,, et al. Biomechanics of the human posterior sclera: age- and glaucoma-related changes measured using inflation testing. Invest Ophthalmol Vis Sci. 2012; 53: 1714–1728. [DOI] [PMC free article] [PubMed] [Google Scholar]
- 41. Fazio MA,, Grytz R,, Morris JS,, et al. Age-related changes in human peripapillary scleral strain. Biomech Model Mechanobiol. 2014; 13: 551–563. [DOI] [PMC free article] [PubMed] [Google Scholar]
- 42. Yang H,, He L,, Gardiner SK,, et al. Age-related differences in longitudinal structural change by spectral-domain optical coherence tomography in early experimental glaucoma. Invest Ophthalmol Vis Sci. 2014; 55: 6409–6420. [DOI] [PMC free article] [PubMed] [Google Scholar]
- 43. Fazio MA,, Grytz R,, Morris JS,, et al. Human scleral structural stiffness increases more rapidly with age in donors of African descent compared to donors of European descent. Invest Ophthalmol Vis Sci. 2014; 55: 7189–7198. [DOI] [PMC free article] [PubMed] [Google Scholar]
- 44. Sigal IA,, Flanagan JG,, Tertinegg I,, et al. Modeling individual-specific human optic nerve head biomechanics. Part I: IOP-induced deformations and influence of geometry. Biomech Model Mechanobiol. 2009; 8: 85–98. [DOI] [PubMed] [Google Scholar]
- 45. Sigal IA,, Flanagan JG,, Tertinegg I,, et al. Modeling individual-specific human optic nerve head biomechanics. Part II: influence of material properties. Biomech Model Mechanobiol. 2009; 8: 99–109. [DOI] [PubMed] [Google Scholar]
- 46. Bellezza AJ,, Hart RT,, Burgoyne CF. The optic nerve head as a biomechanical structure: initial finite element modeling. Invest Ophthalmol Vis Sci. 2000; 41: 2991–3000. [PubMed] [Google Scholar]
- 47. Clark AF. The cell and molecular biology of glaucoma: biomechanical factors in glaucoma. Invest Ophthalmol Vis Sci. 2012; 53: 2473–2475. [DOI] [PubMed] [Google Scholar]
- 48. Teng Y,, Yu X,, Teng Y,, et al. Evaluation of crowded optic nerve head and small scleral canal in intrapapillary hemorrhage with adjacent peripapillary subretinal hemorrhage. Graefes Arch Clin Exp Ophthalmol. 2014; 252: 241–248. [DOI] [PubMed] [Google Scholar]
- 49. Floyd MS,, Katz BJ,, Digre KB. Measurement of the scleral canal using optical coherence tomography in patients with optic nerve drusen. Am J Ophthalmol. 2005; 139: 664–669. [DOI] [PubMed] [Google Scholar]
- 50. Lee MS. Scleral canal size in patients with optic nerve drusen. Am J Ophthalmol. 2005; 140: 1168–1169 author reply 1169. [DOI] [PubMed] [Google Scholar]
- 51. Girard MJ,, Tun TA,, Husain R,, et al. Lamina cribrosa visibility using optical coherence tomography: comparison of devices and effects of image enhancement techniques. Invest Ophthalmol Vis Sci. 2015; 56: 865–874. [DOI] [PubMed] [Google Scholar]
- 52. Johnson EC,, Doser T,, Cepurna WO,, et al. Cell proliferation and interleukin-6-type cytokine signaling are implicated by gene expression responses in early optic nerve head injury in rat glaucoma. Invest Ophthalmol Vis Sci. 2011; 52: 504–518. [DOI] [PMC free article] [PubMed] [Google Scholar]
- 53. Howell GR,, Macalinao DG,, Sousa GL,, et al. Molecular clustering identifies complement and endothelin induction as early events in a mouse model of glaucoma. J Clin Invest. 2011; 121: 1429–1444. [DOI] [PMC free article] [PubMed] [Google Scholar]
- 54. Tezel G,, Yang X,, Luo C,, et al. An astrocyte-specific proteomic approach to inflammatory responses in experimental rat glaucoma. Invest Ophthalmol Vis Sci. 2012; 53: 4220–4233. [DOI] [PMC free article] [PubMed] [Google Scholar]
- 55. Tezel G. A proteomics view of the molecular mechanisms and biomarkers of glaucomatous neurodegeneration. Prog Retin Eye Res. 2013; 35: 18–43. [DOI] [PMC free article] [PubMed] [Google Scholar]
- 56. Johnstone J,, Fazio M,, Rojananuangnit K,, et al. Variation of the axial location of Bruch's membrane opening with age, choroidal thickness, and race. Invest Ophthalmol Vis Sci. 2014; 55: 2004–2009. [DOI] [PMC free article] [PubMed] [Google Scholar]
- 57. Yang H,, Downs JC,, Sigal IA,, et al. Deformation of the normal monkey optic nerve head connective tissue after acute IOP elevation within 3-D histomorphometric reconstructions. Invest Ophthalmol Vis Sci. 2009; 50: 5785–5799. [DOI] [PMC free article] [PubMed] [Google Scholar]
- 58. Downs JC,, Blidner RA,, Bellezza AJ,, et al. Peripapillary scleral thickness in perfusion-fixed normal monkey eyes. Invest Ophthalmol Vis Sci. 2002; 43: 2229–2235. [PMC free article] [PubMed] [Google Scholar]
- 59. Sommer A,, Tielsch JM,, Katz J,, et al. Relationship between intraocular pressure and primary open angle glaucoma among white and black Americans. The Baltimore Eye Survey. Arch Ophthalmol. 1991; 109: 1090–1095. [DOI] [PubMed] [Google Scholar]
- 60. Iwase A,, Suzuki Y,, Araie M,, et al. The prevalence of primary open-angle glaucoma in Japanese: the Tajimi Study. Ophthalmology. 2004; 111: 1641–1648. [DOI] [PubMed] [Google Scholar]
- 61. Leske MC,, Heijl A,, Hyman L,, et al. Early Manifest Glaucoma Trial: design and baseline data. Ophthalmology. 1999; 106: 2144–2153. [DOI] [PubMed] [Google Scholar]
- 62. Gordon MO,, Kass MA. The Ocular Hypertension Treatment Study: design and baseline description of the participants. Arch Ophthalmol. 1999; 117: 573–583. [DOI] [PubMed] [Google Scholar]
- 63. Ringner M. What is principal component analysis? Nat Biotechnol. 2008; 26: 303–304. [DOI] [PubMed] [Google Scholar]
- 64. Hata M,, Miyamoto K,, Oishi A,, et al. Comparison of optic disc morphology of optic nerve atrophy between compressive optic neuropathy and glaucomatous optic neuropathy. PLoS One. 2014; 9: e112403. [DOI] [PMC free article] [PubMed] [Google Scholar]
Associated Data
This section collects any data citations, data availability statements, or supplementary materials included in this article.


