

Abstract
Background
Fine particulate (PM2.5) air pollution has been consistently linked to survival, but reported effect estimates are geographically heterogeneous. Exposure to different types of particle mixtures may explain some of this variation.
Methods
We used k-means cluster analyses to identify cities with similar pollution profiles, (i.e. PM2.5 composition) across the US. We examined the impact of PM2.5 on survival, and its variation across clusters of cities with similar PM2.5 composition, among Medicare enrollees in 81 US cities (2000–2010). We used time-varying annual PM2.5 averages, measured at ambient central monitoring sites, as the exposure of interest. We ran by-city Cox models, adjusting for individual data on previous cardiopulmonary-related hospitalizations and stratifying by follow-up time, age, gender and race. This eliminates confounding by factors varying across cities and long-term trends, focusing on year-to-year variations of air pollution around its city-specific mean and trend. We then pooled the city-specific effects using a random effects meta-regression. In this second stage, we also assessed effect modification by cluster membership and estimated cluster-specific PM2.5 effects.
Results
We followed more than 19 million subjects and observed more than 6 million deaths. We found a harmful impact of annual PM2.5 concentrations on survival (HR = 1.11 [95% confidence interval = 1.01–1.23] per 10 µg/m3). This effect was modified by particulate composition, with higher effects observed in clusters containing high concentrations of nickel, vanadium and sulfate. For instance, our highest effect estimate was observed in cities with harbors in the Northwest, characterized by high nickel, vanadium and elemental carbon concentrations (1.9 [1.1–3.3]). We observed null or negative associations in clusters with high oceanic and crustal particles.
Conclusions
To our knowledge, this is the first study to examine the association between PM2.5 composition and survival. Our findings indicate that long-term exposure to fuel oil combustion and power plant emissions have the highest impact on survival.
Long-term exposure to fine particulate matter (PM2.5, i.e. particles with aerodynamic diameter ≤ 2.5 µm) has been consistently associated with adverse health, including mortality.1,2 The effects of long-term PM2.5 exposure on mortality have been shown to differ in magnitude by location. Pelucchi et al.3, found heterogeneous effects of long-term PM2.5 exposure on mortality across Europe, in a review meta-analysis of 6 studies, while Hoek et al.4, in a large review of cohort studies on PM2.5 and mortality, also found both a notable pooled effect estimate and heterogeneity in effects across studies, likely due to differences in particle composition and population characteristics. Similarly, Zeger et al.5 found heterogeneous effects across the US, with the highest effects in the central US, somewhat lower, effects in the eastern US and no effects in the West. Many factors have been identified that influence the heterogeneity in the effect estimates6–9; differences in particulate composition, specifically, have been proposed as a key contributing factor to this heterogeneity.4
Nationwide studies have shown that particulate composition varies across the US.10 To date, several studies have assessed the association between particulate components or sources and acute adverse effects. Franklin et al.11 found increased non-accidental mortality rates when PM2.5 mass contained a higher proportion of arsenic, sulfate, silicon or nickel, in a study conducted in 25 US communities. These results are in agreement with a recent study12 reporting modification of sulfate and silicon on the 2-day PM2.5 and all-cause mortality association. Krall et al.13 directly linked short-term exposures to elemental and organic carbon, and silicon to mortality. Zanobetti et al.14 found the association between PM2.5 and cardiovascular (CVD) admissions to be higher when the mass was high in bromine, chromium, nickel and sodium. Bell et al.15 reported associations between CVD emergency admissions and exposure to nickel, as well as vanadium and elemental carbon. Similarly, Peng et al.16 and Tolbert et al.17 found that increases in elemental carbon and organic carbon are associated with increase in risk of CVD emergency admissions.
It has not yet been determined, however, whether particle composition also modifies the association between long-term PM2.5 exposures and mortality, and whether it explains some of the observed effect heterogeneity across locations and studies. A recent European study, investigating the association between PM2.5 components and CVD survival, reported no important associations between any of the PM2.5 components and CVD mortality.18
Notably, studies of long-term effects of PM2.5 on survival rely on primarily cross-sectional exposure contrasts and, hence, are subject to potential confounding by factors that vary across cities. Moreover, such studies traditionally follow cohorts over time and examine the association of survival time with PM2.5 in a Cox proportional hazards model, where most of the exposure contrast is across cities. Causal modeling, in contrast, seeks to estimate the difference in the expected value of mortality in the population under the exposure they received versus what it would have been had they received an alternative exposure. Since that counterfactual cannot be observed, various methods – such as instrumental variables,19 marginal structural models,20 and mendelian randomization21 – seek legitimate surrogates for the unobserved potential outcome. Mendelian randomization, for example, can be thought as a method for observational studies that is analogous to randomized trials, with the goal of making causal inferences about modifiable risk factors and adverse health, by focusing on variations in exposure thought to be uncorrelated with factors confounding the exposure-outcome association.22
For this study we focused on within-city year-to-year fluctuations in PM2.5 about its long-term trend, as representing exposure variations that are unlikely to be confounded. For example, a variable usually included as a confounder in PM2.5-mortality studies is smoking. Smoking rates likely vary across cities, within cities across years, and within cities and years, across individuals. Our method seeks to decompose these three sources of variation. By conducting city-specific analyses, any potential confounding by factors varying across cities is eliminated. By removing long-term trends, any potential confounding by long-term trends in within-city smoking trends is also eliminated. Finally, since we estimate city-specific annual PM2.5 averages and, thus, assign the same exposure to all subjects within city and year, confounding by varying smoking rates across individuals is also not possible. Our results, therefore, could only be confounded by variables that fluctuate with PM2.5 across their long-term trends. Given that these fluctuations in yearly PM2.5 concentrations occur mostly due to weather conditions, such as prevailing wind direction, any residual confounding is unlikely. With this method, hence, we approximate randomization of exposure with respect to confounders. We applied this approach to all-cause mortality data from Medicare enrollees from 81 cities, an open cohort of more than 19 million subjects. Although effect modification by other factors is likely,6–9 in this study we further examine whether particulate composition, specifically, modifies the PM2.5-mortality relationship.
Methods
Data collection
Study Population
We obtained data from fee-for-service Medicare beneficiaries (≥65 years of age) from 81 cities across the United States for the years 2000–2010. Each Medicare record contains information on age, race, zip code, county and state of residence. Furthermore, for subjects hospitalized during this period, we obtained records for the dates and diagnoses of each admission. Specifically, using codes from the International Classification of Diseases, 9th Revision (ICD-9; Center for Disease Control and Prevention 2008), we obtained admission records for congestive heart failure (CHF; code 428), myocardial infarction (MI; code 410), chronic obstructive pulmonary disease (COPD; codes 490–492, 494–496) and diabetes (code 250), as well severity of each admission, expressed by the number of days spent in the coronary or intensive care units.
Medicare is an open cohort; subjects entered our cohort in 2000, or upon their enrollment after 2000. After enrollment, each subject was followed over time until the year of their death or December 2010 (end of our study period).
Although the Medicare data do not have information on individual-level behavioral risk factors (e.g. smoking, and body mass index), they do have rich individual-level information on cause-specific hospitalizations and age, sex, race and zip code-level of residence. In addition, it has been shown that use of these data yield effect estimates that are similar to previously published studies that had included individual-level variables in their analyses.23 Furthermore, our focus on year-to-year fluctuations in PM2.5 about its within-city trend makes it unlikely that potential individual-level confounders, such as individual socioeconomic status (SES), smoking and diet, fluctuate similarly and are correlated with our exposure.
Air pollution data
We obtained PM2.5 and particulate component data from the US Environmental Protection Agency’s (EPA) Air Quality System (AQS) database (http://www.epa.gov/ttn/airs/airsaqs/detaildata/downloadaqsdata.htm). In our analyses we included sites with at least 75% non-missing observations, both total and in each season, and calculated annual PM2.5 and PM2.5 component means. We chose 81 cities satisfying these criteria.
The PM chemical species included in the clustering were the ions nitrate, sodium ion, potassium ion, sulfate, ammonium, the elements sulfur, copper, iron, zinc, nickel, vanadium, titanium, magnesium, potassium, silicon, sodium, chlorine, calcium, bromine, strontium, lead and manganese, elemental carbon, and organic carbon. PM2.5 monitoring sites are population-oriented, measuring exposures where people live and work.24 In our study, we used data from between one monitor per city up to 10 monitors in large Metropolitan Statistical Areas, such as New York, NY and Los Angeles, CA. For speciated PM2.5 data, there was only one available monitor per city, with the exception of New York, NY (n=3), St. Louis, MO (n=2), Cleveland, OH (n=2), Philadelphia, PA (n=2) and Milwaukee, WI (n=2). When more than one monitor was available in a city, we calculated annual city-specific averages.
Data analysis
Spatial Clustering Based on PM2.5 Composition
To identify cities with similar long-term PM2.5 composition, we performed a cluster analysis, as described by Austin et al.25 Briefly, modified Z-scores for each chemical species were calculated using the ratio of the species average between January 2003 and December 2008 at each site, divided by the corresponding PM2.5 concentration at that site. We then employed the k-means clustering algorithm to cluster together sites that have the most similar PM2.5 composition, using the Z-scores. A detailed description of the clustering algorithm we employed is presented in the eAppendix.
Health Models
In contrast to prior studies, we fit separate survival analyses in each city, to avoid confounding by factors varying across cities. We employed Cox’s proportional hazards models, with age (5-yr categories), sex, race and follow-up time as the stratification variables. Follow-up started on 1 January following entry into the cohort, and we used annual PM2.5 mass concentrations as time-varying exposures for all participants. We used the counting process extension of the proportional hazards model by Andersen and Gill,26 thus creating multiple observations for each subject, with each observation representing a single person-year of mortality follow-up.
We adjusted linearly for year, thus estimating whether year-to-year PM2.5 variations around its long-term trends are associated with year-to-year survival variations in each city. Also, this eliminates confounding due to long-term trends. To increase the precision of the estimated effects, we adjusted for any previous admission for CHF, COPD, MI or diabetes, as well as number of days spent in the intensive and coronary care units. These outcomes were selected based on their known association with mortality.27 We also adjusted for zip code-level median income, as a proxy for SES, using zip code level data obtained from the 2000 US Census Bureau (Census 2000, http://www.census.gov). Finally, as a sensitivity analysis, we included annual city-specific smoking rates, obtained from the Behavioral Risk Factor Surveillance System (http://www.cdc.gov/brfss/), as a control to assess whether our method is indeed robust to confounding by smoking.
We combined the city-specific health effect estimates in a second stage, using a random effects meta-analysis.28
Effect Modification by Particulate Composition
We also investigated whether the association between long-term PM2.5 exposure and mortality is modified by PM2.5 composition. To do so, we added dummy variables for each cluster in the second-stage meta-regression and thus obtained the estimated deviation from the overall effect of PM2.5 in each cluster, assessing whether the effect estimate in a specific cluster was significantly different from the pooled effect estimate.
All results are presented per 10 µg/m3 of PM2.5. For our statistical analyses we used the SAS software, version 9.3 (SAS Institute Inc., Cary, NC, USA), and the R Statistical Software, version 2.14.1 (Foundation for Statistical Computing, Vienna, Austria).
Results
The distribution of number of subjects, deaths and cause-specific hospitalizations in the 81 cities in our study are presented in the Table. Our cohort consisted of 19,274,534 subjects and we observed 6,383,358 deaths (33.1%) before the end of follow-up. On average, the participants were aged 75.3 years (SD = 7.5); 57.6% were female and 87% white.
Table.
Distribution of number of subjects, deaths and cause-specific admissions, presented as percentiles across the 81 cities.
| 5% | 25% | 50% | 75% | 95% | Total | |
|---|---|---|---|---|---|---|
| No. Subjects | 26,552 | 68,712 | 129,158 | 253,698 | 833,786 | 19,274,534 |
| No. Deaths | 9,105 | 23,909 | 42,689 | 90,500 | 303,496 | 6,383,358 |
| No. Admissions | ||||||
| Diabetes | 2,739 | 7,472 | 13,098 | 22,069 | 59,575 | 1,801,223 |
| CHF | 931 | 2,772 | 4,644 | 8,488 | 26,401 | 686,430 |
| MI | 859 | 1,636 | 3,405 | 6,051 | 17,950 | 457,241 |
| COPD | 479 | 1,493 | 2,425 | 4,755 | 14,006 | 356,104 |
The average PM2.5 concentration was 12.8 µg/m3 (SD = 1.7). Overall, we observed positive associations between long-term exposure to PM2.5 and mortality, with a hazard ratio (HR) of 1.11 (95% confidence interval [CI] = 1.01–1.23) per 10 µg/m3 increase in the annual PM2.5 concentrations. Including annual city-specific smoking rates in the model did not affect the estimated HRs.
Effect Modification by Particulate Composition
Spatial Clusters
We identified 21 unique clusters: 4 single-city clusters, 6 clusters with 2 cities and 11 clusters with 3 or more cities. A map of all clusters is presented in eFigure 1. The chemical characteristics each cluster are presented in a heat map (eFigure 2), while detailed ratios of species over PM2.5 concentrations by cluster are presented in eFigure 3.
Briefly, clusters can be described in six general groups. The clusters in the first group (clusters 1–5 and 7) are located in the eastern US, and they have high sulfate concentrations, consistent with power plant regional emissions. The clusters in the second group (clusters 6, 8 and 11) are located in the Midwest and are characterized on average by high sulfate, nitrate and metal concentrations, such as manganese, zinc, iron, and lead, indicating more industrialized areas including smelters or metallurgic activity. The clusters in the third group (clusters 10, 13 and 16) include cities with large seaports and are characterized by high sodium, chlorine, and potassium concentrations, associated with oceanic particles, and high nickel and vanadium concentrations, consistent with heavy fuel oil combustion from ships. The clusters in the fourth group (clusters 12 and 14) are located inland in the western US and have high crustal element concentrations, such as calcium, silicon, titanium and iron. Clusters in the fifth group (clusters 9, 15 and 17) do not show a geographic cohesiveness, as they are located throughout the Western and Central US. They are characterized by low sulfate and high concentrations of nitrate and K, associated with agricultural activities and biomass burning, and crustal elements. Finally, the sixth grouping contains the four single-city clusters (see eAppdendix).
PM2.5 composition and mortality
The effects of PM2.5 by cluster are presented in Figure 1 and in eTable 2. We observed varying effect estimates across clusters, with most hazard ratios higher than the null. Specifically, we found that the effect estimates were different than the pooled average in 4 clusters (namely clusters 2, 10, 13 and 16) and marginally different in clusters 8 and 11. The confidence intervals in part reflect the number of cities within a cluster, with single-city clusters having the widest CIs.
Figure 1.
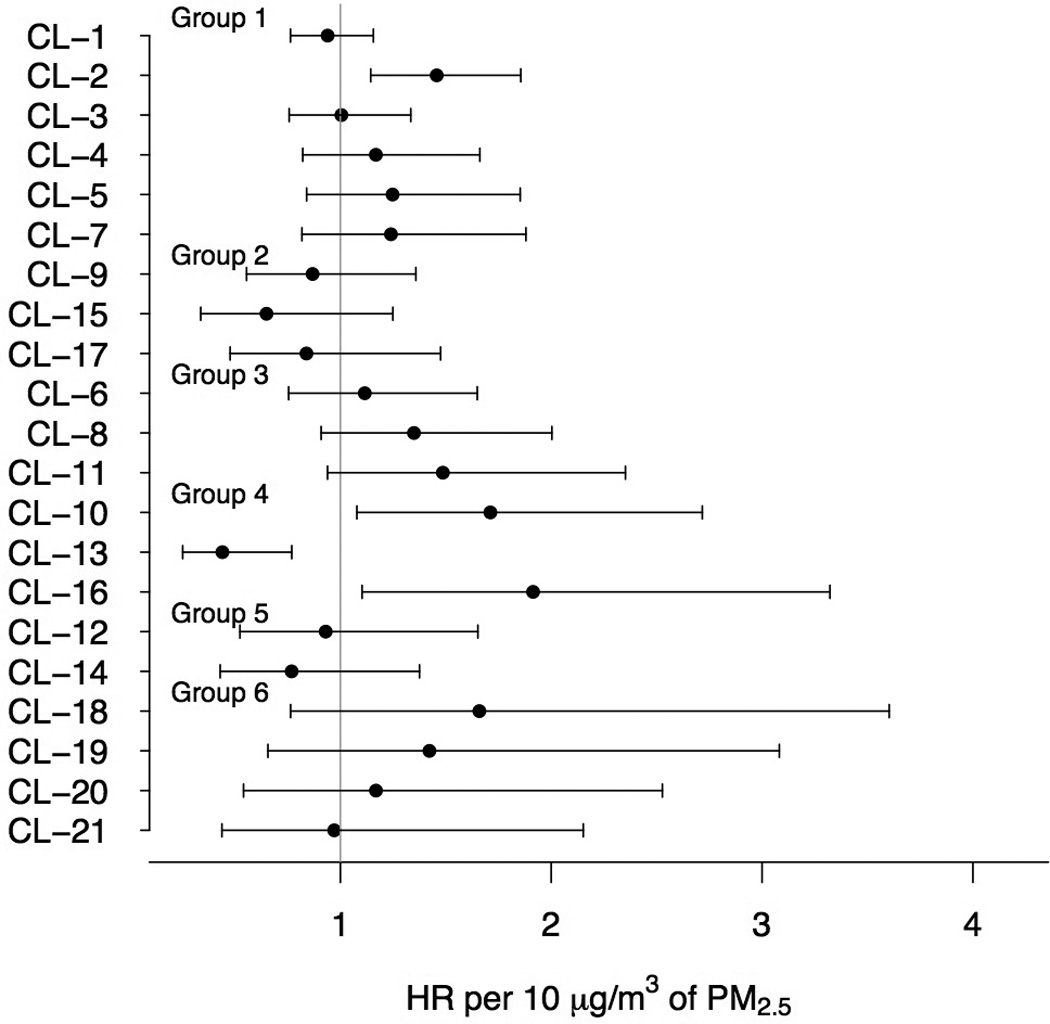
Within-cluster (CL) estimated HR per 10 µg/m3 of PM2.5 (circles) and 95% CIs (lines). The results are ordered according to the 6 groups of clusters.
The highest effect estimate was observed in cluster 16 (HR = 1.9 per 10 µg/m3 of PM2.5 [95%CI = 1.1–3.3]). Cluster 16 contains Seattle, WA, and Portland, OR, and is characterized by high elemental carbon, nickel and vanadium concentrations. High effect estimates were also observed in cluster 10 (1.7 [1.1–2.7]), containing cities with harbors in the southern and southeastern US and also characterized by high vanadium concentrations. In cluster 2 the observed HR was 1.5 (1.1–1.9); cluster 2 includes several Southeastern cities and is characterized by very high sulfate concentrations. High effects were also observed in cluster 11 (1.5 [0.94–2.4]), a cluster containing Midwestern cities with high concentrations of metals consistent with industrial processes, such as lead, manganese and zinc, as well as sulfate. We also observed a high effect estimate in Birmingham, AL (1.7 [0.76–3.6]). Birmingham has the highest elemental carbon concentrations, as well as high concentrations of the metals manganese, zinc, lead and iron, consistent with emissions from industrial facilities located in the area.
In cluster 13, we observed lower PM2.5 effects compared with the pooled effect across all cities (0.44 [0.25–0.77]). Cluster 13 contains San Diego and Ventura, CA, and is characterized by high concentrations of oceanic particles, as indicated by the high sodium, chlorine and potassium levels, as well as high nitrate concentrations. Lower effects were also observed in cluster 15 (0.65 [0.34–1.3]) and cluster 14 (0.77 [0.43–1.4]), that both have high concentrations of crustal species.
Discussion
We conducted a nationwide, multi-year study to assess the effect of long-term PM2.5 exposures on mortality, using data from Medicare enrollees. We followed more than 19 million subjects between 2000 and 2010, with more than 6 million deaths, and observed harmful effects associated with a 10 µg/m3 increase in annual PM2.5. We also examined whether the observed effects are modified by particle composition, as defined by clusters of PM2.5 species concentrations. Our analyses suggest that exposure to different PM2.5 mixtures results in varying effects on mortality.
Contrary to previous studies of air pollution and survival, we conducted our analyses by city, eliminating confounding that could arise by factors varying across cities. We investigated whether year-to-year PM2.5 fluctuations, about its long-term mean, is associated with year-to-year mortality fluctuations within-city. This design also eliminates potential confounding by long-term trends. Although this design could lead to loss of power, this is likely not an issue in this study, given the very large size of our cohort.
An exposure increase in 10 µg/m3 of annual PM2.5 average was associated with a HR of 1.11 (95%CI = 1.01–1.23). This result is in very good agreement with previously published mortality effects.4 Specifically, a recent paper using data from the ESCAPE cohort reported HR = 1.13 (95%CI = 1.01–1.25) per 10 µg/m3 of PM2.5,29 and the most recent reanalysis of the Harvard Six City Study reported a HR of 1.14 (95%CI = 1.07–1.22).30 Although we were not able to include potential confounders at the individual level in our analyses, we believe that any bias is likely to be small given the design’s focus on pollution fluctuations unlikely to be associated with those confounders, the similarities of our findings with other studies, the very large number of subjects included, and the use of hospital admissions as proxies for health conditions. In a direct comparison of the Medicare cohort with the Harvard Six Cities study and the American Cancer Society study, conducted in the same cities as these two cohorts, Eftim et al.23 also showed that use of Medicare data for mortality analyses is appropriate.
Although several studies have assessed the effects of PM2.5 species,11,13 and sources,31 on acute mortality, no studies have investigated the relationship between particulate mixtures and survival. Only one study in Europe, also using ESCAPE data, assessed the effect of exposure to PM2.5 species on cardiovascular survival.18 For that study, 19 cohort-specific Cox proportional hazard models were run and a combined effect estimate was calculated with a random effects meta-analysis. The authors assessed exposures to copper, iron, potassium, nickel, sulfur, silicon, vanadium and zinc and found no associations with any species, with the exception of suggestive evidence of an association with sulfate. The main difference between that study and ours is that they used time-invariant PM2.5 species concentrations, predicted at the residences of the study participants using Land Use Regression Models.
We employed a clustering algorithm to identify cities with similar mixtures of air pollution and assessed the effect of these mixtures on survival. We observed the highest associations in clusters 10 and 16. These clusters included cities with harbors and were characterized by high nickel and vanadium concentrations, and low ratios of nickel and vanadium, indicating high emissions from ship heavy fuel oil (bunker fuel) combustion.32 High effects in cities with high concentrations of these two metals are consistent with prior literature of harmful impacts of fuel oil combustion on acute health.33–35 Toxicological studies also support the epidemiologic evidence.36–38
We also observed strong effects in clusters with high secondary particle concentrations, such as cluster 2 and 10. In these clusters we observed low elemental carbon to organic carbon ratios, indicating large secondary contributions, and high sulfate concentrations. Sulfate is associated with sulfur dioxide power plant emissions,39,40 and is formed in the atmosphere by photochemical reactions,41 leading to high spatial homogeneity.42 Studies of acute outcomes have also observed increased effects of sulfate-rich secondary PM2.5 concentrations and power plant emissions.35,43
Finally, exposures to air pollution in industrialized areas, such as cluster 11 and Birmingham, AL, were also associated with survival in our analyses. Industrial emissions are usually characterized by high concentrations of transition metals, including iron, zinc, manganese and copper, as well as lead. Transition metals are capable of redox recycling; exposure to airborne transition metals, therefore, can lead to oxidative stress, which underlies in part the toxicity of ambient particles.44 It has also been shown, in a rat study, that transition metals are a key determinant of acute inflammatory responses.45
We found no, or opposite, effects in clusters with high concentrations of crustal and oceanic particles. This is contrary to some studies of acute effects; Zanobetti et al., for instance, reported an association between sodium exposures and CVD admissions,14 and Krall et al.13 observed an association between Si and mortality. This suggests that short-term exposures to such particles are related to acute effects, but the biological pathways for survival could be different.
The compositional pollution profile of each city likely plays a role in particle toxicity. For instance, we observed high effect estimates for clusters 10 and 16, but very low effect estimates in cluster 13, with all clusters belonging in the same group. We also observed high contributions of nickel and vanadium to PM2.5 concentrations in cluster 13, albeit not as high as in clusters 10 and 16, and very high oceanic contributions (eFigure 3). This suggests that exposure to different air pollution mixtures, and not solely sources, impacts survival. The possibility of effect modification by other factors, nevertheless, cannot be excluded; investigation of multiple potential effect modifiers, however, was not within the scope of this study.
This study has some limitations. Information on individual characteristics, such as smoking and weight, is not available for Medicare enrollees. Given our choice of study design, however, any differences in such variables across cities, or within-city long-term trends, cannot confound our estimates. Also, Medicare does not provide the underlying cause of death; we were, thus, able to assess only all-cause mortality.
Additionally, we analyzed only species provided by the EPA Speciation Trends Network that satisfied our inclusion criteria. The resulting air pollution mixtures, therefore, might not accurately describe the actual mixtures to which the subjects are exposed. This could result in measurement error, if a city is assigned to the wrong cluster. However, any such error is non-differential with respect to mortality and could only bias our results towards the null. Another source of measurement error, also non-differential in this setting, could arise from use of PM2.5 concentrations measured at central ambient monitors. This error has been shown to bias effect estimates towards the null, with more bias expected with larger contributions of local sources to the PM2.5 concentrations.46
In conclusion, we observed harmful associations between PM2.5 and survival. More importantly, we showed that these associations vary depending on the different types of air pollution mixtures, with higher effects observed in cities with high concentrations of fuel oil combustion particles, indicating harbor-related emissions, and sulfate, a tracer for power plant emissions. Findings of our study can be used to inform policy for targeted source-specific regulations. To our knowledge, this is the first study that provides strong evidence that chronic effects of PM2.5 on mortality are modified by simultaneous exposures to multiple PM2.5 components.
Supplementary Material
Acknowledgments
Sources of financial support: This publication was developed under a STAR Research Assistance Agreement No. RD-834900 and was also made possible by USEPA STAR Fellowship Assistance Agreement no. FP-9172890-01, grant RD 83479801, and R834894 awarded by the U.S. Environmental Protection Agency. Its contents are solely the responsibility of the grantee and do not necessarily represent the official views of the USEPA. Further, USEPA does not endorse the purchase of any commercial products or services mentioned in the publication. This publication was also made possible by training grant NIH T32 ES007069 and by NIEHS ES0002.
Footnotes
Conflict of Interest: The authors declare no conflict of interest.
SDC Supplemental digital content is available through direct URL citations in the HTML and PDF versions of this article (www.epidem.com). This content is not peer-reviewed or copy-edited; it is the sole responsibility of the author.
References
- 1.Dockery DW, Pope CA, Xu X, Spengler JD, Ware JH, Fey ME, Ferris BG, Jr, Speizer FE. An association between air pollution and mortality in six US cities. N Engl J Med. 1993;329:1753–1759. doi: 10.1056/NEJM199312093292401. [DOI] [PubMed] [Google Scholar]
- 2.Krewski D, Jerrett M, Burnett RT, Ma R, Hughes E, Shi Y, Turner MC, III Pope CA, Thurston G, Calle EE, Thun MJ. Extended Follow-Up and Spatial Analysis of the American Cancer Society Study Linking Particulate Air Pollution and Mortality. Boston, MA: Health Effects Institute; 2009. Dec, Research Report 140. [PubMed] [Google Scholar]
- 3.Pelucchi C, Negri E, Gallus S, Boffetta P, Tramacere I, La Vecchia C. Long-term particulate matter exposure and mortality: a review of European epidemiological studies. BMC Public Health. 2009;9(1) doi: 10.1186/1471-2458-9-453. [DOI] [PMC free article] [PubMed] [Google Scholar]
- 4.Hoek G, Krishnan R, Beelen R, Peters A, Ostro B, Brunekreef B, Kaufman J. Long-term air pollution exposure and cardio-respiratory mortality: a review. Environmental Health. 2013;12(1):43. doi: 10.1186/1476-069X-12-43. [DOI] [PMC free article] [PubMed] [Google Scholar]
- 5.Zeger SL, Dominici F, McDermott A, Samet JM. Mortality in the medicare population and chronic exposure to fine particulate air pollution in urban centers (2000–2005) Environ Health Perspect. 2008;116(12):1614–1619. doi: 10.1289/ehp.11449. [DOI] [PMC free article] [PubMed] [Google Scholar]
- 6.Janssen NA, Schwartz J, Zanobetti A, Suh HH. Air conditioning and source-specific particles as modifiers of the effect of PM10 on hospital admissions for heart and lung disease. Environ Health Perspect. 2002;110(1):43–49. doi: 10.1289/ehp.0211043. [DOI] [PMC free article] [PubMed] [Google Scholar]
- 7.Bell ML, Ebisu K, Peng RD, Dominici F. Adverse health effects of particulate air pollution: Modification by air conditioning. Epidemiology. 2009;20(5):682–686. doi: 10.1097/EDE.0b013e3181aba749. [DOI] [PMC free article] [PubMed] [Google Scholar]
- 8.Bell ML, Zanobetti A, Dominici F. Evidence on vulnerability and susceptibility to health risks associated with short-term exposure to particulate matter: A systematic review and meta-analysis. American Journal of Epidemiology. 2013;178(6):865–876. doi: 10.1093/aje/kwt090. [DOI] [PMC free article] [PubMed] [Google Scholar]
- 9.Cox LA, Jr, Popken DA, Ricci PF. Warmer is healthier: Effects on mortality rates of changes in average fine particulate matter (PM2.5) concentrations and temperatures in 100 U.S. cities. Regulatory Toxicology and Pharmacology. 2013;66(3):336–346. doi: 10.1016/j.yrtph.2013.05.006. [DOI] [PubMed] [Google Scholar]
- 10.Bell ML, Dominici F, Ebisu K, Zeger SL, Samet JM. Spatial and temporal variation in PM2.5 chemical composition in the United States for health effects studies. Environ Health Perspect. 2007;115(7):989–995. doi: 10.1289/ehp.9621. [DOI] [PMC free article] [PubMed] [Google Scholar]
- 11.Franklin M, Koutrakis P, Schwartz J. The role of particle composition on the association between PM2.5 and mortality. Epidemiology. 2008;19(5):680–689. doi: 10.1097/ede.0b013e3181812bb7. [DOI] [PMC free article] [PubMed] [Google Scholar]
- 12.Dai L, Zanobetti A, Koutrakis P, Schwartz JD. Associations of fine particulate matter species with mortality in the united states: A multicity time-series analysis. Environmental health perspectives. 2014;122(8):837–842. doi: 10.1289/ehp.1307568. [DOI] [PMC free article] [PubMed] [Google Scholar]
- 13.Krall JR, Anderson GB, Dominici F, Bell ML, Peng RD. Short-term exposure to particulate matter constituents and mortality in a national study of US urban communities. Environmental health perspectives. 2013;121(10):1148–1153. doi: 10.1289/ehp.1206185. [DOI] [PMC free article] [PubMed] [Google Scholar]
- 14.Zanobetti A, Franklin M, Koutrakis P, Schwartz J. Fine particulate air pollution and its components in association with cause-specific emergency admissions. Environmental Health. 2009;8(58) doi: 10.1186/1476-069X-8-58. [DOI] [PMC free article] [PubMed] [Google Scholar]
- 15.Bell ML, Ebisu K, Peng RD, Samet JM, Dominici F. Hospital admissions and chemical composition of fine particulate air pollution. Am J REspir Crit Care Med. 2009;179:1115–1120. doi: 10.1164/rccm.200808-1240OC. [DOI] [PMC free article] [PubMed] [Google Scholar]
- 16.Peng RD, Bell ML, Geyh AS, McDermott A, Zeger SL, Samet JM, Dominici F. Emergency admissions for cardiovascular and respiratory diseases and the chemical composition of fine particle air pollution. Environ Health Perspect. 2009;117(6):957–963. doi: 10.1289/ehp.0800185. [DOI] [PMC free article] [PubMed] [Google Scholar]
- 17.Tolbert PE, Klein M, Peel JL, Sarnat SE, Sarnat JA. Multipollutant modeling issues in a study of ambient air quality and emergency department visits in Atlanta. Journal of Exposure Science and Environmental Epidemiology. 2007;17:S29–S35. doi: 10.1038/sj.jes.7500625. [DOI] [PubMed] [Google Scholar]
- 18.Wang M, Beelen R, Stafoggia M, Raaschou-Nielsen O, Andersen ZJ, Hoffmann B, et al. Long-Term Exposure to Elemental Constituents of Particulate Matter and Cardiovascular Mortality in 19 European Cohorts: Results from the ESCAPE and TRANSPHORM Projects. Environ Int. 2014;66:97–106. doi: 10.1016/j.envint.2014.01.026. [DOI] [PubMed] [Google Scholar]
- 19.Sander Greenland. An introduction to instrumental variables for epidemiologists. International journal of epidemiology. 2000;29(4):722–729. doi: 10.1093/ije/29.4.722. [DOI] [PubMed] [Google Scholar]
- 20.Robins JM, Hernàn MA, Brumback B. Marginal structural models and causal inference in epidemiology. Epidemiology. 2000;11(5):550–560. doi: 10.1097/00001648-200009000-00011. [DOI] [PubMed] [Google Scholar]
- 21.Smith GD, Ebrahim S. ‘Mendelian randomization’: can genetic epidemiology contribute to understanding environmental determinants of disease? International journal of epidemiology. 2003;32(1):1–22. doi: 10.1093/ije/dyg070. [DOI] [PubMed] [Google Scholar]
- 22.Lawlor DA, Harbord RM, Sterne JAC, Timpson N, Smith GD. Mendelian randomization: using genes as instruments for making causal inferences in epidemiology. Statistics in medicine. 2008;27(8):1133–1163. doi: 10.1002/sim.3034. [DOI] [PubMed] [Google Scholar]
- 23.Eftim SE, Samet JM, Janes H, McDermott A, Dominici F. Fine particulate matter and mortality: A comparison of the Six Cities and American Cancer Society cohorts with a Medicare cohort. Epidemiology. 2008;19(2):209–216. doi: 10.1097/EDE.0b013e3181632c09. [DOI] [PubMed] [Google Scholar]
- 24.Watson JG, Chow JC, DuBois D, Green M, Frank N, Pitchford M. Guidance For Network Design and Optimum Site Exposure For PM2.5 And PM10 (EPA-454/R-99-022) US Environmental Protection Agency. 1999 [Google Scholar]
- 25.Austin E, Coull BA, Zanobetti A, Koutrakis P. A framework to spatially cluster air pollution monitoring sites in US based on the PM2.5 composition. Environment International. 2013;59:244–254. doi: 10.1016/j.envint.2013.06.003. [DOI] [PMC free article] [PubMed] [Google Scholar]
- 26.Andersen P, Gill R. Cox’s regression model counting process: A large sample study. Annals of Statistics. 1982;10:1100–1120. [Google Scholar]
- 27.Heron M. National vital statistics reports. 6. Vol. 62. Hyattsville, MD: National Center for Health Statistics; 2013. Deaths: Leading causes for 2010. [PubMed] [Google Scholar]
- 28.Berkey CS, Hoaglin DC, Antczak-Bouckoms A, Mosteller F, Colditz GA. Meta-analysis of multiple outcomes by regression with random effects. Statistics in Medicine. 1998;17:2537–2550. doi: 10.1002/(sici)1097-0258(19981130)17:22<2537::aid-sim953>3.0.co;2-c. [DOI] [PubMed] [Google Scholar]
- 29.Beelen R, Raaschou-Nielsen O, Stafoggia M, Andersen ZJ, Weinmayr G, Hoffmann B, Wolf K, Samoli E, Fischer P, Nieuwenhuijsen M, et al. Effects of long-term exposure to air pollution on natural-cause mortality: an analysis of 22 European cohorts within the multicentre ESCAPE project. The Lancet. 2014;383:785–795. doi: 10.1016/S0140-6736(13)62158-3. [DOI] [PubMed] [Google Scholar]
- 30.Lepeule J, Laden F, Dockery D, Schwartz J. Chronic exposure to fine particles and mortality: an extended follow-up of the Harvard Six Cities study from 1974 to 2009. Environmental health perspectives. 2012;120(7):965. doi: 10.1289/ehp.1104660. [DOI] [PMC free article] [PubMed] [Google Scholar]
- 31.Laden F, Neas LM, Dockery DW, Schwartz J. Association of fine particulate matter from different sources with daily mortality in six U.S. cities. Environ Health Perspect. 2000;108(10):941–947. doi: 10.1289/ehp.00108941. [DOI] [PMC free article] [PubMed] [Google Scholar]
- 32.Peltier RE, Lippmann M. Residual oil combustion: 2. distributions of airborne nickel and vanadium within New York City. J Expo Sci Environ Epidemiol. 2009:1–9. doi: 10.1038/jes.2009.28. [DOI] [PubMed] [Google Scholar]
- 33.Bell ML. Assessment of the Health Impacts of Particulate Matter Characteristics. Boston, MA: Health Effects Institute; 2012. Jan, Research Report 161. [PubMed] [Google Scholar]
- 34.Ostro B, Tobias A, Querol X, Alastuey A, Amato F, Pey J, Pèrez N, Sunyer J. The effects of particulate matter sources on daily mortality: A case-crossover study of Barcelona, Spain. Environmental Health Perspectives. 2011;119(12):1781–1787. doi: 10.1289/ehp.1103618. [DOI] [PMC free article] [PubMed] [Google Scholar]
- 35.Kioumourtzoglou M-A, Coull BA, Dominici F, Koutrakis P, Schwartz J, Suh H. The impactof source contribution uncertainty on the effects of source-specific PM2.5 on hospital admissions: A case study in Boston, MA. Journal of Exposure Science and Environmental Epidemiology. 2014;24:365–371. doi: 10.1038/jes.2014.7. [DOI] [PMC free article] [PubMed] [Google Scholar]
- 36.Kadiiska MB, Mason RP, Dreher KL, Costa DL, Ghio AJ. In vivo evidence of free radical formation in the rat lung after exposure to an emission source air pollution particle. Chemical research in toxicology. 1997;10(10):1104–1108. doi: 10.1021/tx970049r. [DOI] [PubMed] [Google Scholar]
- 37.Campen MJ, Nolan JP, Schladweiler MCJ, Kodavanti UP, Costa DL, Watkinson WP. Cardiac and thermoregulatory effects of instilled particulate matter-associated transition metals in healthy and cardiopulmonary-compromised rats. Journal of Toxicology and Environmental Health, Part A: Current Issues. 2002;65(20):1615–1631. doi: 10.1080/00984100290071694. [DOI] [PubMed] [Google Scholar]
- 38.Lippmann M, Ito K, Hwang JS, Maciejczyk P, Chen LC. Cardiovascular effects of nickel in ambient air. Environ Health Perspect. 2006;114(11):1662–1669. doi: 10.1289/ehp.9150. [DOI] [PMC free article] [PubMed] [Google Scholar]
- 39.Hopke PK, Ito K, Mar T, Christensen WF, Eatough DJ, Henry RC, Kim E, Laden F, Lall R, Larson TV, Liu H, Neas L, Pinto J, Stölzel M, Suh H, Paatero P, Thurston GD. PM source apportionment and health effects: 1. Intercomparison of source apportionment results. J Expo Sci Environ Epidemiol. 2006;16(3):275–286. doi: 10.1038/sj.jea.7500458. [DOI] [PubMed] [Google Scholar]
- 40.Hsu S-I, Ito K, Kendall M, Lippmann M. Factors affecting personal exposure to thoracic and fine particles and their components. J Expos Sci Environ Epidemiol. 2012;22:439–447. doi: 10.1038/jes.2012.23. [DOI] [PMC free article] [PubMed] [Google Scholar]
- 41.Hazi Y, Heikkinen MSA, Cohen BS. Size distribution of acidic sulfate ions in fine ambient particulate matter and assessment of source region effect. Atmospheric Environment. 2003;37:5403–5413. [Google Scholar]
- 42.Wilson W, Mage D, Grant L. Estimating separately personal exposure to ambient and non-ambient particulate matter for epidemiology and risk assessment; why and how. J. Air & Waste Manage. Assoc. 2000;50:1167–1183. doi: 10.1080/10473289.2000.10464164. [DOI] [PubMed] [Google Scholar]
- 43.Ito K, Mathes R, Ross Z, Nádas A, Thurston G, Matte T. Fine particulate matter constituents associated with cardiovascular hospitalizations and mortality in New York City. Environmental Health Perspectives. 2011;119(4):467–473. doi: 10.1289/ehp.1002667. [DOI] [PMC free article] [PubMed] [Google Scholar]
- 44.Kelly FJ. Oxidative stress: its role in air pollution and adverse health effects. Occupational and environmental medicine. 2003;60(8):612–616. doi: 10.1136/oem.60.8.612. [DOI] [PMC free article] [PubMed] [Google Scholar]
- 45.Costa DL, Dreher KL. Bioavailable transition metals in particulate matter mediate cardiopulmonary injury in healthy and compromised animal models. Environmental health perspectives. 1997;105(Suppl 5):1053. doi: 10.1289/ehp.97105s51053. [DOI] [PMC free article] [PubMed] [Google Scholar]
- 46.Kioumourtzoglou M-A, Spiegelman D, Szpiro AA, Sheppard L, Kaufman JD, Yanosky JD, Williams R, Laden F, Hong B, Suh H. Exposure measurement error in PM2.5 health effects studies: A pooled analysis of eight personal exposure validation studies. Environmental Health. 2014;13(1):2. doi: 10.1186/1476-069X-13-2. [DOI] [PMC free article] [PubMed] [Google Scholar]
Associated Data
This section collects any data citations, data availability statements, or supplementary materials included in this article.