Abstract
Exosomes have emerged as a promising biomarker. These vesicles abound in biofluids and harbor molecular constituents from their parent cells, thereby offering a minimally-invasive avenue for molecular analyses. Despite such clinical potential, routine exosomal analysis, particularly the protein assay, remains challenging, due to requirements for large sample volumes and extensive processing. We have been developing miniaturized systems to facilitate clinical exosome studies. These systems can be categorized into two components: microfluidics for sample preparation and analytical tools for protein analyses. In this report, we review a new assay platform, nano-plasmonic exosome (nPLEX), in which sensing is based on surface plasmon resonance to achieve label-free exosome detection. Looking forward, we also discuss some potential challenges and improvements in exosome studies.
Keywords: Exosome, Surface plasmon resonance, Extracellular vesicles, Cancer, Molecular diagnosis
The growing emphasis on targeted and personalized therapy concomitantly increases the need to analyze and monitor key cancer proteins and pathway activation[1–3]. Although tissue biopsies remain the gold standard, their invasiveness and limited sampling often present practical challenges with patient management[4].
Exosomes have emerged as a new class of cancer biomarker for clinical diagnostics[5, 6]. Exosomes are membrane-bound phospholipid vesicles (50–200 nm in diameter) that are actively secreted by cancer cells (Fig. 1). These vesicles carry cellular constituents of their originating cells, including transmembrane and intracellular proteins[7], mRNA[8], DNA[9], microRNA[10], lipids and metabolites, and can serve as cellular surrogates[11]. Combined with their large abundance and ubiquitous presence in bodily fluids (e.g., blood, ascites, urine)[5, 12, 13], exosomes offer significant advantages for cancer monitoring[14–16]. Namely, an exosomal assay can be robust and minimally invasive for repeated tests. As most tumor cells shed exosomes, the assay can also report relatively unbiased readouts of the whole tumor burden, less affected by the scarcity of the samples (e.g., circulating tumor cells to circulating DNAs) or intra-tumoral heterogeneity (e.g., fine-needle aspiration)[17]. Furthermore, the amount and molecular profile of cancer exosomes have been shown to correlate with tumor burden as well as treatment efficacy[17, 18]. A number of recent review articles have highlighted exosomes’ role in diagnostics, cell-to-cell interactions and therapeutic opportunities[5, 6, 19–23]. Despite such clinical potential, routine exosome analysis is still a challenging task. Conventional methods (e.g., Western blotting, ELISA) require larger sample volumes (>500 μL per biomarker) and extensive processing (e.g., 3 hours with ultracentrifugation)[6, 24]. Such assays become impractical when multiple markers need to be profiled or the sample volume is inherently limited (e.g., cerebrospinal fluid)
Fig. 1. Exosomes shed from ovarian cancer cell.
(a) Electron microscopy image of a primary human ovarian cancer cell (CaOV3) confirms the avid release of membrane vesicles by the cell. (b) High magnification image shows that the vesicles on the cell surface assumed typical saucer-shaped characteristics of exosomes. (c) The size distribution of the exosomes, as characterized by the nanoparticle tracking analysis (NTA), ranges from 20 – 250 nm. Reproduced from Im H, Shao H, Park YI et al. Label-free detection and molecular profiling of exosomes with a nano-plasmonic sensor. Nat Biotechnol 2014;32:490–495 with permission from Nature Publishing Group, copyright 2014 [18].
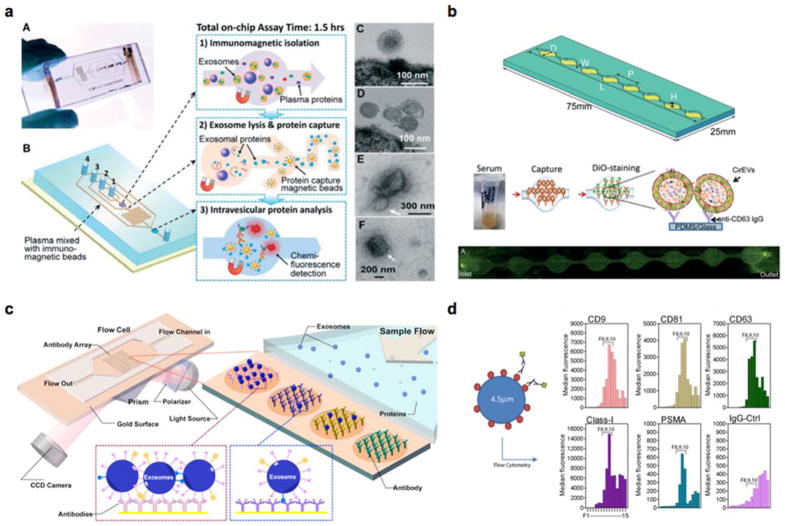
Various exosome detection platforms have been introduced to overcome these challenges (Fig. 2, Table 1)[17, 18, 25–30]. Integration with microfluidics allows for exosome analyses in small volumes; adoption into novel sensing methods (e.g. surface plasmon resonance, magnetic resonance) generated exosomal assays with shorter assay time, higher sensitivity and higher throughput. Commercialized nucleic acid sensing technologies (e.g. RainDrop, NanoStrings) have been adapted for a variety of exosomal RNA components with high sensitivity. With the high sensitivity and throughput, these new technologies have shown great promise for both exosomal RNA and protein detection over conventional analytical methods.
Fig. 2. New exosome sensing platforms.
(a) An integrated microfluidic chip for exosome isolation, chemical lysis and exosomal protein analysis. Reproduced with permission from He M, Crow J, Roth M, Zeng Y, Godwin AK. Integrated immunoisolation and protein analysis of circulating exosomes using microfluidic technology. Lab Chip 2014;14:3773–3780, published by The Royal Society of Chemistry [26]. (b) A microfluidic device (ExoChip) for on-chip exosome capture and analysis. Reproduced from Kanwar SS, Dunlay CJ, Simeone DM, Nagrath S. Microfluidic device (ExoChip) for on-chip isolation, quantification and characterization of circulating exosomes. Lab Chip 2014;14:1891–1900 with permission of The Royal Society of Chemistry [27]. (c) A surface plasmon resonance imaging (SPRi) system for label-free exosome detection. Reprinted with permission from Zhu L, Wang K, Cui J et al. Label-Free Quantitative Detection of Tumor-Derived Exosomes through Surface Plasmon Resonance Imaging. Anal Chem 2014;86:8857–8864. Copyright 2014 American Chemical Society [29]. (d) Aptamer-based platform (SOMAscan™) for proteomic analysis of cancer exosomes. Reproduced with permission from Webber J, Stone TC, Katilius E et al. Proteomics Analysis of Cancer Exosomes Using a Novel Modified Aptamer-based Array (SOMAscanTM) Platform. Mol Cell Proteomics 2014;13:1050–1064 [28].
Table 1.
Comparison of exosomal sensing platforms.
| Method | Sensing principle | Target | Sensitivity | Throughput | Reference |
|---|---|---|---|---|---|
| nPLEX | SPR | Protein | ~103 exosomes | High (>100 arrays) | 18 |
| μNMR | Magnetic resonance | Protein | ~104 exosomes | Low (single channel) | 17 |
| ExoChip | Fluorescence | CD63+/Rab5+ EVs | 0.5 pM | Low (three channels) | 27 |
| SOMAscan | Fluorescence | Protein | 100 fM | Very high (1,129) | 28 |
| Microfluidic chip | Fluorescence | Protein | 0.3 pg/mL | Low (single channel) | 26 |
| SPRi | SPR | Protein | 5×10⁷ exosomes/cm2 | 29 | |
| BEAMing & digital PCR | Fluorescence | RNA | 0.01% (mutant detection) | High | 25 |
| miRNA microarray/NanoString | Fluorescence | miRNA | Very high (> 1,000) | 30 |
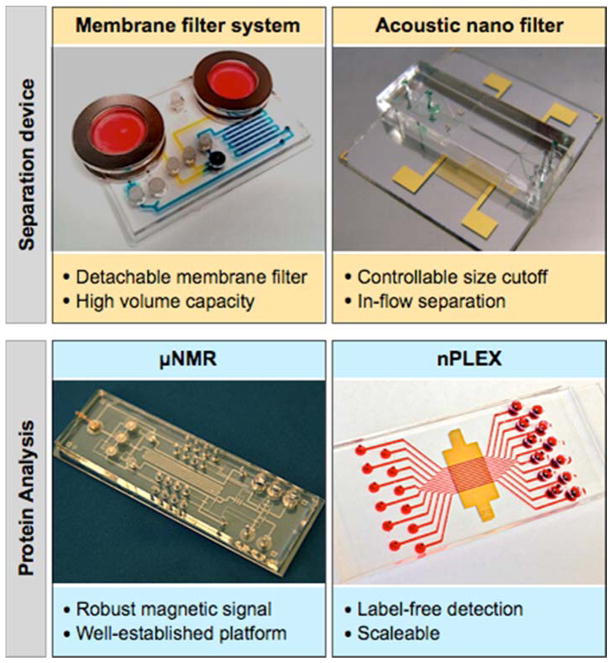
We have been advancing miniaturized systems to facilitate exosome studies (Figure 3). These systems are comprised of two components: microfluidics to facilitate sample preparation and analytical tools for protein analyses. The microfluidic devices are designed to collect intact exosomes directly from biological samples, replacing ultracentrifugation or proprietary precipitation methods. The first developed device used a detachable membrane filter (0.1 μm pore) to size-selectively enrich exosomes from large sample volumes[31]; the next developed system was based on acoustic actuation, which enabled controllable size-cutoff and continuous, inflow filtration[32]. For protein analyses, we initially adopted the μNMR technology to magnetically profile exosomal proteins[17]. In μNMR, target proteins were labeled with magnetic nanoparticles, and changes in transverse relaxation of the samples were measured. The signal detection is robust against biological background, and the assay was demonstrated to benefit from such a well-established platform[33–36]. The μNMR assay, however, was difficult to scale up for high throughput detection. The task requires a large NMR-grade magnet to accommodate multiple NMR probes, and also entails labeling with magnetic nanoparticles. Recently, we developed a new assay system, termed nano-plasmonic exosome (nPLEX)[18] that could overcome these challenges. The nPLEX sensing is based on surface plasmon resonance (SPR) through periodic nanohole arrays, wherein target-specific exosome binding on the array causes significant SPR signal changes. The system is scalable with a large number of sensing units (> 100) integrated into a single chip, and the assay is label-free (i.e., no need for secondary labeling with nanoparticles)[37, 38].
Figure 3. Miniaturized devices developed for exosome separation (top) and its protein profiling (bottom).
Images are adapted with permission from: Shao H, Chung J, Balaj L et al. Protein typing of circulating microvesicles allows real-time monitoring of glioblastoma therapy. Nat Med 2012;18:1835–1840 [17]; Im H, Shao H, Park YI et al. Label-free detection and molecular profiling of exosomes with a nano-plasmonic sensor. Nat Biotechnol 2014;32:490–495 with permission from Nature Publishing Group, copyright 2014 [18]; with permission from Rho J, Chung J, Im H et al. Magnetic Nanosensor for Detection and Profiling of Erythrocyte-Derived Microvesicles. ACS Nano 2013;7:11227–11233. Copyright 2013 American Chemical Society [31]; and with permission from Lee K, Shao H, Weissleder R, Lee H. Acoustic purification of extracellular microvesicles. ACS Nano 2015;9:2321–2327. Copyright 2015 American Chemical Society [32].
This special report will review this nascent nPLEX technology, assessing its sensor design, assay protocols, and clinical applications. We will specifically focus on nPLEX’s capacity for fast, high-throughput exosome analyses, and also discuss directions to further improvements.
nPLEX Technology
Sensing principle
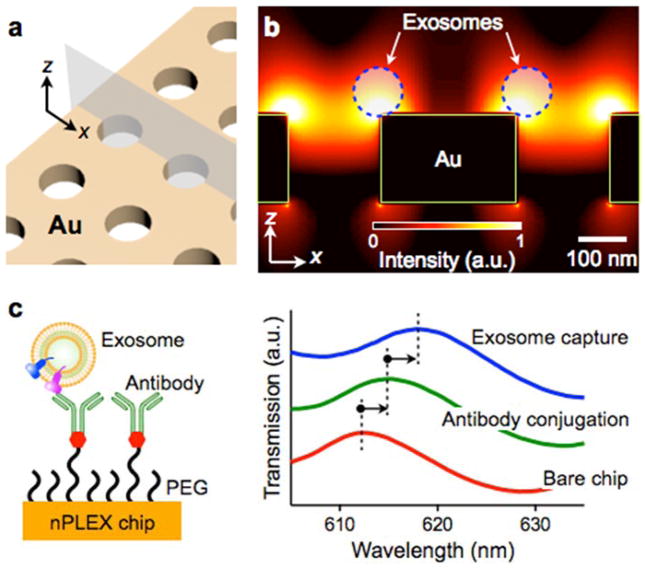
The nPLEX system comprises of periodic nanohole arrays made in an opaque gold (Au) film (Figure 4a). Light illumination to the nanohole arrays can excite strong electromagnetic fields, called surface plasmons (SPs)on the surface (Figure 4b), which lead to SP-mediated extraordinary optical transmission (EOT)[39, 40]. The transmission spectral peak positions are highly sensitive to the refractive index on the nanohole surface, and exosome binding to the nanohole surface (via affinity ligands) would red-shift the optical transmission peaks (Figure 4c). The amount of spectral shift correlates with the molecular mass density [41], which enables quantification of captured exosomes on the sensing surface. Because exosome binding itself induces a spectral shift, the nPLEX can detect exosomes in a label-free manner.
Fig. 4. nPLEX sensing principle.
(a) A sensing site comprises a periodic nanohole array patterned in a gold film. (b) Finite-difference time-domain simulation shows the enhanced electromagnetic fields tightly confined near a periodic nanohole surface. The field distribution overlaps with the size of exosomes captured onto the sensing surface. a.u., arbitrary unit. (c) Antibodies were immobilized on the nPLEX chip, and exosomes were captured based on their expression of extravesicular markers (left). Antibody conjugation and exosome binding were monitored measuring spectral shifts via the nPLEX sensor (right). Reproduced from Im H, Shao H, Park YI et al. Label-free detection and molecular profiling of exosomes with a nano-plasmonic sensor. Nat Biotechnol 2014;32:490–495 with permission from Nature Publishing Group, copyright 2014 [18].
The nanohole-based plasmonic detection has unique advantages over conventional SPR systems (e.g., Kretschmann configuration[42]). First, a simple, collinear optical setup can be used for signal measurements[38, 43], and the system can be readily miniaturized[18, 44]. Second, the system is scalable for high throughput detection. The minimal array size for the EOT could be as small as 5-by-5 periodic nanoholes (foot print < 10 μm2)[45], which allows for the integration of high density arrays (> 106 detection sites per cm2)[46–48]. Such high density is difficult to achieve with the Kretschmann configuration. The large tilt angle of incidence could lead to optical aberration when a NA aperture is used to increase spatial resolution or defocusing when imaging arrays in a large area.
System design
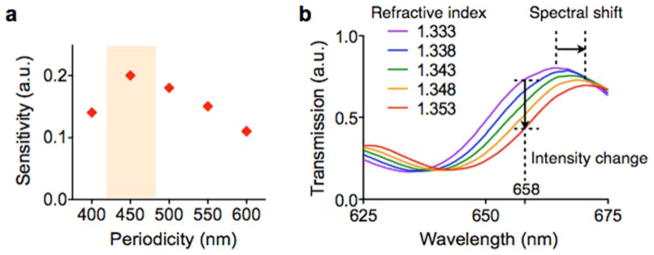
The geometry of the nanoholes was optimized through 3-dimensional simulation to match the sensing range with the mean diameter of exosomes (~100 nm; Figure 5a). The nPLEX signal was measured by monitoring the transmission spectrum via a spectrometer setup. In this mode, individual arrays are sequentially scanned, and a spectral shift of resonance peak from exosome binding is detected. Although the spectrum-based measurements provide comprehensive information of the nanohole’s optical characteristics, it could be time-consuming with large sensing arrays. For faster readout, we alternatively measured changes in transmission intensity at an excitation wavelength (Figure 5b). This intensity-based method could monitor multiple sensing arrays simultaneously, enabling high-throughput parallel measurements.
Fig. 5. Device design optimization.
(a) The sensitivity of the nPLEX sensor was defined as Δλ/w, where Δλ and w are the shift and the width of SPR spectrum, respectively. The nanohole array with 450-nm hole-pitch showed the highest sensitivity for the detection of 100 nm exosomes. a.u., arbitrary unit. (b) Increase in the refractive index on the nPLEX surface induces a spectral shift (Δλ) of resonance peak to a longer wavelength. The increase of refractive index also causes intensity changes (Δp) at a given wavelength (e.g., at 658 nm). Therefore, exosome binding can be detected by either tracking Δλ by spectrometry or Δp by imaging. Reproduced from Im H, Shao H, Park YI et al. Label-free detection and molecular profiling of exosomes with a nano-plasmonic sensor. Nat Biotechnol 2014;32:490–495 with permission from Nature Publishing Group, copyright 2014 [18].
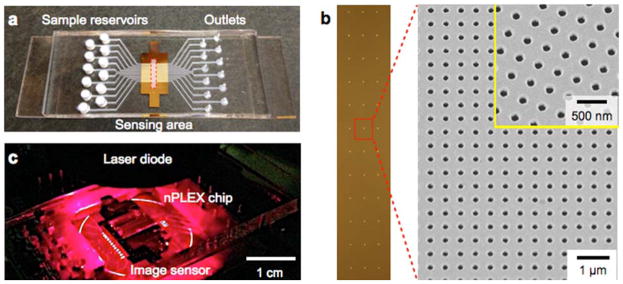
Figure 6a shows the first nPLEX prototype. The structure was patterned in a 200 nm-thick Au film on a glass substrate. We laid out a 12 × 3 array of sensing units with multi-channel microfluidics placed on top (Figure 6b). Each channel spanned over three sensing units for triplicate measurements. The sample volume per sensing unit was ~1 μL. For parallel measurements of nPLEX arrays, an intensity-based detection system integrated with miniaturized optics consisting of a laser diode and an image sensor was also developed (Figure 6c). This system can simultaneously monitor changes in the transmitted light intensities of 36 arrays for high-throughput parallel measurements.
Fig. 6. First nPLEX prototype.
(a) A photograph of the nanohole device integrated with microfluidics. A 12-channel fluidic cell was placed on top of a glass slide containing nanohole arrays. (b) A total of 36 measurement sites were arranged into a 12 × 3 array. Each measurement site had periodic nanoholes (right). The structure was patterned in a gold film (200 nm thick) deposited on a glass substrate. (c) A photograph of the miniaturized nPLEX imaging system. The nPLEX chip was located directly on an image sensor, which measured transmitted light intensities of the 36 sites simultaneously. Reproduced from Im H, Shao H, Park YI et al. Label-free detection and molecular profiling of exosomes with a nano-plasmonic sensor. Nat Biotechnol 2014;32:490–495 with permission from Nature Publishing Group, copyright 2014 [18].
Analytical nPLEX assay for molecular profiling
To impart molecular specificity, the nanohole surface was coated with different antibodies in each channel. Following antibody conjugation, exosomes were introduced and spectral shifts are measured before and after exosome binding. An IgG control channel was incorporated to measure the contribution from non-specific binding and its signal was subtracted from each target channel.
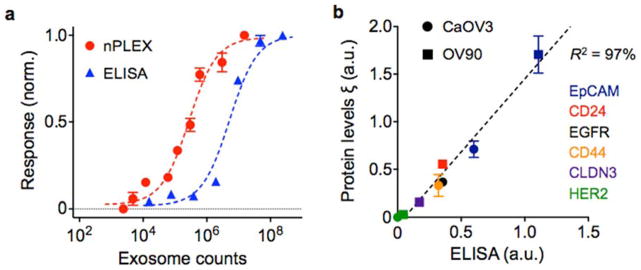
To determine the detection sensitivity, we functionalized the sensor surface with antibodies against CD63, a type III lysosomal membrane protein enriched in exosomes. Alternatively, other exosome-specific lysosomal membrane proteins (e.g. CD9, CD81) were also used[49]. Samples were prepared from CaOV3 (human ovarian carcinoma) cell lines, and their initial exosome concentrations were estimated by nanoparticle-tracking analysis (NTA). A pair of nPLEX sensors, functionalized with CD63 and control IgG antibodies respectively, were used to measure the relative spectral (ΔλCD63) or intensity (ΔpCD63) changes against known exosome counts. The titration experiments established the limit of detection (LOD) of ~ 3000 exosomes (670 aM) with the label-free nPLEX assay (Figure 7a). The observed sensitivity based on the LOD was 104- and 102-fold higher than Western blotting and chemiluminescence ELISA, respectively.
Fig. 7. Exosome quantification and protein profiling with nPLEX.
(a) Exosomes isolated from human ovarian cancer cell line (CaOV3) were introduced onto a nPLEX sensor functionalized with CD63 antibody for exosomal capture. The nPLEX platform showed considerably higher sensitivity than ELISA. (b) Comparison between nPLEX and ELISA measurements. Exosomes isolated from human ovarian cancer cell lines were used. The expression level (ξ) was determined by normalizing the marker signal with that of CD63, which accounted for variation in exosomal counts across samples. All measurements were in triplicate and the data is displayed as mean ± s.d. Reproduced from Im H, Shao H, Park YI et al. Label-free detection and molecular profiling of exosomes with a nano-plasmonic sensor. Nat Biotechnol 2014;32:490–495 with permission from Nature Publishing Group, copyright 2014 [18].
To quantitatively detect exosome proteins, we functionalized the nPLEX sensors with antibodies against target markers and measured associated signals (Δλtarget or Δptarget) from exosome capture. Next, we defined the expression level (ξtarget) of the target marker by scaling the marker-associated changes to those of CD63 (i.e., ξtarget = Δλtarget/ΔλCD63 ≈ Δptarget/ΔpCD63). Such normalization accounted for differences in exosome counts among samples and thereby reported the average expression level of a target marker per exosome[17, 18]. This method was applied to profile exosomes from different cell lines (CaOV3, OV90) for various extravesicular markers (Figure 7b). Expression levels were well-matched (R2 > 98%) between nPLEX and ELISA, verifying the accuracy of the developed nPLEX assay. In addition, the nPLEX assay could be adapted for downstream genetic analyses by releasing captured exosomes from the device using surface regeneration protocols[17, 18].
Clinical potential of exosomes
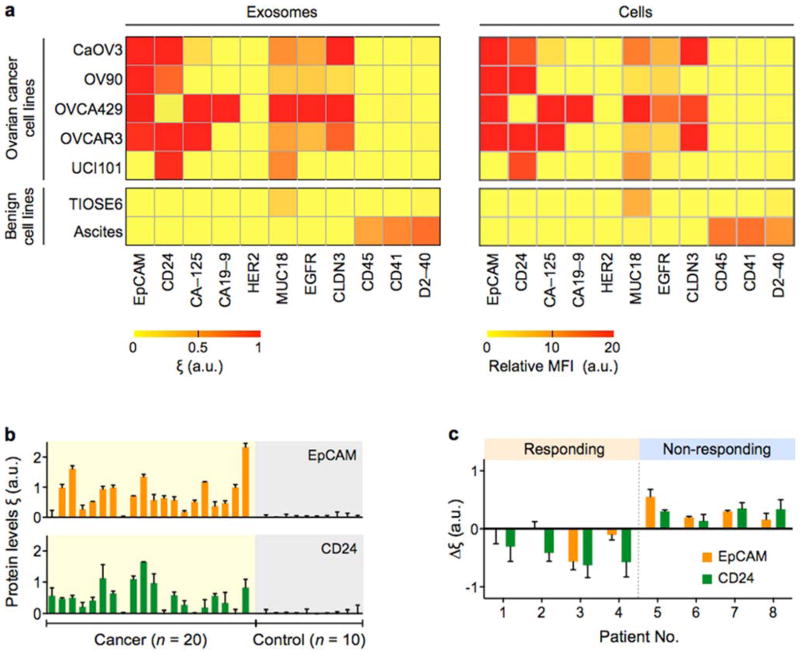
We first explored the correlation between exosomes and their parental cells. Multiplexed in vitro nPLEX screening showed good agreement of protein expression between exosomes and their parental cells across different ovarian cancer cell lines (Figure 8a). Such close matching of molecular profiles between exosome and cells was previously identified in glioblastoma multiforme (GBM) cell lines using μNMR[17]. In addition, our nPLEX screening showed that EpCAM and CD24 were highly expressed in tested ovarian cancer cell lines.
Fig. 8. Molecular profiling of ovarian cancer exosomes.
(a) In-vitro study. Ovarian cancer associated markers (EpCAM, CD24, CA-125, CA19-9, HER2, MUC18, EGFR, Claudin3), immune host cell markers (CD41, CD45) and a mesothelial marker (D2-40) were profiled on both parental ovarian cells (right, using flow cytometry) and their derived exosomes (left, using nPLEX sensor). Exosomal protein profiles showed an excellent match with those of originating cells. A two-marker combination comprising EpCAM and CD24 could effectively distinguish cancer exosomes from benign exosomes. MFI, mean fluorescence intensity. (b) Ascites exosomes from ovarian cancer and non-cancer patients were evaluated by the nPLEX sensor. Cancer exosomes were captured on EpCAM and CD24-specific sensor sites, and the exosomal expression levels of these markers were measured. Ovarian cancer patients (n = 20) were associated with elevated EpCAM and CD24 expression, while non-cancer patients (n = 10) showed negligible signals. (c) Longitudinal nPLEX assays. Ascites samples were collected sequentially from ovarian cancer patients undergoing chemotherapy (n = 8). Measuring temporal changes in exosomal expressions of EpCAM and CD24 could distinguish treatment response. Reproduced from Im H, Shao H, Park YI et al. Label-free detection and molecular profiling of exosomes with a nano-plasmonic sensor. Nat Biotechnol 2014;32:490–495 with permission from Nature Publishing Group, copyright 2014 [18].
Based on these results, the nPLEX system was applied to detect ovarian cancer exosomes in patient-derived ascites (Figure 8b). Thirty ascites samples were obtained: 20 patients were diagnosed with Stage 3 (n = 10) and 4 (n = 10) ovarian cancer and 10 control ascites patients were diagnosed with liver cirrhosis[18]. The study demonstrated that 1) unprocessed ascites contained large quantities (>109 per ml) of exosomes; 2) nPLEX was sensitive enough to detect exosomes directly isolated from ascites by simple syringe membrane filtration; and 3) the levels of EpCAM and CD24 per exosome were significantly higher in ovarian cancer patient samples than in control groups. For 30 samples tested, the detection accuracy was 97% using EpCAM and CD24 as diagnostic markers. The nPLEX screening was further used to evaluate the prognostic values of exosomes for treatment monitoring (Figure 8c). For ovarian cancer patients (n = 8) undergoing standard chemotherapy, the study demonstrated that the levels of exosomal EpCAM, CD24 or both decreased among responding patients, whereas levels of these markers increased in non-responding patients.
Expert commentary
Exosomes present new opportunities for cancer diagnoses and treatment monitoring. These vesicles abound in biological fluids and carry cell-specific cargos (lipids, proteins and genetic materials), which can be harnessed as a minimally invasive means to probe the molecular status of tumors. Significant technical developments are underway to channel exosome analysis into clinical settings: fluidic-based tools have been devised to facilitate sample preparation, and analytical platforms have been adapted to detect exosomes in clinical samples. Such efforts have started to unveiling tumor-associated exosomal fingerprints, particularly in RNA profiles (both coding and noncoding).
Exosomal protein analysis, on the other hand, still remains challenging. With the lack of universal amplification strategy (e.g., PCR), protein analysis generally requires large quantities of exosomes and often involves extensive sample processing. The nPLEX technology was developed to address these issues. The nPLEX’s high sensitivity allows for quantitative measurements on small sample amounts; the detection is label-free to minimize assay time and potential sample loss/degradation; and the system is scalable to a large array for high-throughput assays.
Extended insight into exosomal proteins could help capture dynamic snapshots of tumors, that are hard to detect with genetic assays. Aberrant changes in cancer cells, in response to microenvironmental stress, are reflected in protein levels and its post-translational modification, which have significant effects on disease progression and therapeutic response. As such, the improved exosomal proteomic analyses, proffered by nPLEX, could pave the way for the potential use of exosomes as companion diagnostics and pharmacodynamic readouts.
We identify two immediate directions to further improve the nPLEX technology. First, the assay format needs to be developed to measure both extra- and intravesicular proteins. The initial nPLEX studies were limited to detecting transmembrane or lipid-bound proteins, since the assay was based on capturing whole exosomes on the device surface. Devising a new assay for intravesicular proteins is critical to probe the activation status of proteins as well as to measure cytosolic protein targets. Second, the clinical utility of nPLEX requires further validation under the auspices of larger clinical trials. The large datasets thus generated would aid in identifying key exosomal fingerprints for cancer. These efforts would establish nPLEX as a transformative platform facilitating cancer research and clinical practice.
Five-year view
The trajectories undertaken by the exosome field’s development of first generation analytical tools parallel those of the more mature circulating tumor cell (CTC) research. Exosomes are abundant and stable in circulation. These advantages impart significant practical value on exosomes as noninvasive and unbiased surrogates for tissue-based biomarkers. As seen in cellular analyses, we envision that more advanced technologies for exosome enrichment and detection will be developed to ultimately enable high-throughput profiling of single exosomes. This will potentially lead to the identification of exosome subpopulations, highly specific to cancer, that could be prospectively explored in cancer clinical trials. Additional investigations will focus on whether testing of cancer exosomes could generate pharmacodynamic readouts. Coupled with the ready access of liquid biopsies, earlier ‘go-no go’ decisions could inform drug development. Improved understanding of the mechanisms driving exosomal signaling will accelerate the efforts to exploit exosomal targeting to deliver therapeutic payloads. This transition to theranostics could be a key step for the exosome field and usher in further attention from pharmaceutical stakeholders, among others. Such diverse opportunities create an exciting venue for exosome research – we anticipate an expanding pipeline of committed and accomplished junior and seasoned investigators across disciplines, along with increased funding opportunities for the next five years and beyond.
Key issues.
Exosomes are membrane-bound vesicles that contain molecular constituents of their cell of origin, including proteins, nucleic acids, lipids and metabolites.
Exosomes can serve as a minimally invasive biomarker for cancer diagnosis and treatment monitoring.
Miniatured devices are being developed to expedite exosome isolation and its downstream analyses. These devices could shorten the hands-on assay time and minimize required samples volumes.
The SPR-based nPLEX technology enables rapid, sensitive, label-free profiling of exosomal proteins.
The nPLEX assay is quantitative, reporting the average expression level of target protein markers per exosomes.
The detection platform is scalable for high throughput, automated detection.
By changing the affinity ligands, the nPLEX platform could be used to detect exosomes from virtually any cell type, and hence could serve as a universal platform for exosome analyses.
Intra-exosomal biology remains an area of active interest given its potential to generate novel pharmacodynamic readouts or therapeutic approaches
Acknowledgments
The authors thank XO Breakefield (Massachusetts General Hospital, Boston, MA, USA) for help with discussion.
Footnotes
Financial & competing interests disclosure
This work was supported in part by NIH grants R01 HL113156 to H Lee; NIH grants P01 CA069246, U54 CA151884 and T32-CA79443 to R. Weissleder; and DoD OCRP Award W81XWH-14-1-0279 to H Lee. H Shao acknowledges financial support from the B.S.-Ph.D. National Science Scholarship awarded by the Agency for Science, Technology and Research, Singapore. The authors have no other relevant affiliations or financial involvement with any organization or entity with a financial interest in or financial conflict with the subject matter or materials discussed in the manuscript apart from those disclosed.
References
Papers of special note have been highlighted as:
* of interest
** of considerable interest
- 1.Bidard FC, Weigelt B, Reis-Filho JS. Going with the flow: from circulating tumor cells to DNA. Sci Transl Med. 2013;5:207ps14. doi: 10.1126/scitranslmed.3006305. [DOI] [PubMed] [Google Scholar]
- 2.Pantel K, Alix-Panabieres C. Real-time liquid biopsy in cancer patients: fact or fiction? Cancer Res. 2013;73:6384–6388. doi: 10.1158/0008-5472.CAN-13-2030. [DOI] [PubMed] [Google Scholar]
- 3.Basik M, Aguilar-Mahecha A, Rousseau C, et al. Biopsies: next-generation biospecimens for tailoring therapy. Nat Rev Clin Oncol. 2013;10:437–450. doi: 10.1038/nrclinonc.2013.101. [DOI] [PubMed] [Google Scholar]
- 4.Gerlinger M, Rowan AJ, Horswell S, et al. Intratumor heterogeneity and branched evolution revealed by multiregion sequencing. N Engl J Med. 2012;366:883–892. doi: 10.1056/NEJMoa1113205. [DOI] [PMC free article] [PubMed] [Google Scholar]
- 5.Thery C, Ostrowski M, Segura E. Membrane vesicles as conveyors of immune responses. Nat Rev Immunol. 2009;9:581–593. doi: 10.1038/nri2567. [DOI] [PubMed] [Google Scholar]
- 6.Simpson RJ, Lim JW, Moritz RL, Mathivanan S. Exosomes: proteomic insights and diagnostic potential. Expert Rev Proteomics. 2009;6:267–283. doi: 10.1586/epr.09.17. [DOI] [PubMed] [Google Scholar]
- 7.Graner MW, Alzate O, Dechkovskaia AM, et al. Proteomic and immunologic analyses of brain tumor exosomes. FASEB J. 2009;23:1541–1557. doi: 10.1096/fj.08-122184. [DOI] [PMC free article] [PubMed] [Google Scholar]
- 8*.Skog J, Wurdinger T, van Rijn S, et al. Glioblastoma microvesicles transport RNA and proteins that promote tumour growth and provide diagnostic biomarkers. Nat Cell Biol. 2008;10:1470–1476. doi: 10.1038/ncb1800. First paper reporting the role of microvesicles in tumor growth and the potential use as diagnostic biomarkers for glioblastoma. [DOI] [PMC free article] [PubMed] [Google Scholar]
- 9.Balaj L, Lessard R, Dai L, et al. Tumour microvesicles contain retrotransposon elements and amplified oncogene sequences. Nat Commun. 2011;2:180. doi: 10.1038/ncomms1180. [DOI] [PMC free article] [PubMed] [Google Scholar]
- 10.Valadi H, Ekström K, Bossios A, Sjöstrand M, Lee JJ, Lötvall JO. Exosome-mediated transfer of mRNAs and microRNAs is a novel mechanism of genetic exchange between cells. Nat Cell Biol. 2007;9:654–659. doi: 10.1038/ncb1596. [DOI] [PubMed] [Google Scholar]
- 11.Kalra H, Simpson RJ, Ji H, et al. Vesiclepedia: a compendium for extracellular vesicles with continuous community annotation. PLoS Biol. 2012;10:e1001450. doi: 10.1371/journal.pbio.1001450. [DOI] [PMC free article] [PubMed] [Google Scholar]
- 12.Raimondo F, Morosi L, Chinello C, Magni F, Pitto M. Advances in membranous vesicle and exosome proteomics improving biological understanding and biomarker discovery. Proteomics. 2011;11:709–720. doi: 10.1002/pmic.201000422. [DOI] [PubMed] [Google Scholar]
- 13.Thery C, Zitvogel L, Amigorena S. Exosomes: composition, biogenesis and function. Nat Rev Immunol. 2002;2:569–579. doi: 10.1038/nri855. [DOI] [PubMed] [Google Scholar]
- 14.Andre F, Schartz NEC, Movassagh M, et al. Malignant effusions and immunogenic tumour-derived exosomes. Lancet. 2002;360:295–305. doi: 10.1016/S0140-6736(02)09552-1. [DOI] [PubMed] [Google Scholar]
- 15.Peinado H, Alečković M, Lavotshkin S, et al. Melanoma exosomes educate bone marrow progenitor cells toward a pro-metastatic phenotype through MET. Nat Med. 2012;18:883–891. doi: 10.1038/nm.2753. [DOI] [PMC free article] [PubMed] [Google Scholar]
- 16.Grange C, Tapparo M, Collino F, et al. Microvesicles released from human renal cancer stem cells stimulate angiogenesis and formation of lung premetastatic niche. Cancer Res. 2011;71:5346–5356. doi: 10.1158/0008-5472.CAN-11-0241. [DOI] [PubMed] [Google Scholar]
- 17**.Shao H, Chung J, Balaj L, et al. Protein typing of circulating microvesicles allows real-time monitoring of glioblastoma therapy. Nat Med. 2012;18:1835–1840. doi: 10.1038/nm.2994. Original paper reporting exosome detection in GBM patients using a miniaturized NMR system. [DOI] [PMC free article] [PubMed] [Google Scholar]
- 18**.Im H, Shao H, Park YI, et al. Label-free detection and molecular profiling of exosomes with a nano-plasmonic sensor. Nat Biotechnol. 2014;32:490–495. doi: 10.1038/nbt.2886. Original paper reporting the nPLEX technology; SPR systems were optimized for the exosome analysis. [DOI] [PMC free article] [PubMed] [Google Scholar]
- 19.Colombo M, Raposo G, Thery C. Biogenesis, secretion, and intercellular interactions of exosomes and other extracellular vesicles. Annu Rev Cell Dev Biol. 2014;30:255–289. doi: 10.1146/annurev-cellbio-101512-122326. [DOI] [PubMed] [Google Scholar]
- 20.Kooijmans SA, Vader P, van Dommelen SM, van Solinge WW, Schiffelers RM. Exosome mimetics: a novel class of drug delivery systems. Int J Nanomedicine. 2012;7:1525–1541. doi: 10.2147/IJN.S29661. [DOI] [PMC free article] [PubMed] [Google Scholar]
- 21.Kourembanas S. Exosomes: vehicles of intercellular signaling, biomarkers, and vectors of cell therapy. Annu Rev Physiol. 2015;77:13–27. doi: 10.1146/annurev-physiol-021014-071641. [DOI] [PubMed] [Google Scholar]
- 22.Thery C. Exosomes: secreted vesicles and intercellular communications. F1000 Biol Rep. 2011;3:15. doi: 10.3410/B3-15. [DOI] [PMC free article] [PubMed] [Google Scholar]
- 23.Vlassov AV, Magdaleno S, Setterquist R, Conrad R. Exosomes: current knowledge of their composition, biological functions, and diagnostic and therapeutic potentials. Biochim Biophys Acta. 2012;1820:940–948. doi: 10.1016/j.bbagen.2012.03.017. [DOI] [PubMed] [Google Scholar]
- 24.Taylor DD, Zacharias W, Gercel-Taylor C. Exosome isolation for proteomic analyses and RNA profiling. Methods Mol Biol. 2011;728:235–246. doi: 10.1007/978-1-61779-068-3_15. [DOI] [PubMed] [Google Scholar]
- 25.Chen WW, Balaj L, Liau LM, et al. BEAMing and Droplet Digital PCR Analysis of Mutant IDH1 mRNA in Glioma Patient Serum and Cerebrospinal Fluid Extracellular Vesicles. Mol Ther-Nucl Acids. 2013;2 doi: 10.1038/mtna.2013.28. [DOI] [PMC free article] [PubMed] [Google Scholar]
- 26.He M, Crow J, Roth M, Zeng Y, Godwin AK. Integrated immunoisolation and protein analysis of circulating exosomes using microfluidic technology. Lab Chip. 2014;14:3773–3780. doi: 10.1039/c4lc00662c. [DOI] [PMC free article] [PubMed] [Google Scholar]
- 27.Kanwar SS, Dunlay CJ, Simeone DM, Nagrath S. Microfluidic device (ExoChip) for on-chip isolation, quantification and characterization of circulating exosomes. Lab Chip. 2014;14:1891–1900. doi: 10.1039/c4lc00136b. [DOI] [PMC free article] [PubMed] [Google Scholar]
- 28.Webber J, Stone TC, Katilius E, et al. Proteomics Analysis of Cancer Exosomes Using a Novel Modified Aptamer-based Array (SOMAscanTM) Platform. Mol Cell Proteomics. 2014;13:1050–1064. doi: 10.1074/mcp.M113.032136. [DOI] [PMC free article] [PubMed] [Google Scholar]
- 29.Zhu L, Wang K, Cui J, et al. Label-Free Quantitative Detection of Tumor-Derived Exosomes through Surface Plasmon Resonance Imaging. Anal Chem. 2014;86:8857–8864. doi: 10.1021/ac5023056. [DOI] [PMC free article] [PubMed] [Google Scholar]
- 30.Donker RB, Mouillet JF, Chu T, et al. The expression profile of C19MC microRNAs in primary human trophoblast cells and exosomes. Mol Hum Reprod. 2012;18:417–424. doi: 10.1093/molehr/gas013. [DOI] [PMC free article] [PubMed] [Google Scholar]
- 31*.Rho J, Chung J, Im H, et al. Magnetic Nanosensor for Detection and Profiling of Erythrocyte-Derived Microvesicles. ACS Nano. 2013;7:11227–11233. doi: 10.1021/nn405016y. Original paper describing a membrane-based microfluidic devices for vesicle isolation. [DOI] [PMC free article] [PubMed] [Google Scholar]
- 32*.Lee K, Shao H, Weissleder R, Lee H. Acoustic purification of extracellular microvesicles. ACS Nano. 2015;9:2321–2327. doi: 10.1021/nn506538f. Original paper reporting the acoustic-wave microfluidic system that performs in-flow separation of microvesicles. [DOI] [PMC free article] [PubMed] [Google Scholar]
- 33**.Lee H, Sun E, Ham D, Weissleder R. Chip-NMR biosensor for detection and molecular analysis of cells. Nat Med. 2008;14:869–874. doi: 10.1038/nm.1711. First demonstration of miniaturized NMR system for molecular analysis. [DOI] [PMC free article] [PubMed] [Google Scholar]
- 34.Haun JB, Castro CM, Wang R, et al. Micro-NMR for rapid molecular analysis of human tumor samples. Sci Transl Med. 2011;3:71ra16. doi: 10.1126/scitranslmed.3002048. [DOI] [PMC free article] [PubMed] [Google Scholar]
- 35.Lee H, Yoon TJ, Figueiredo JL, Swirski FK, Weissleder R. Rapid detection and profiling of cancer cells in fine-needle aspirates. Proc Natl Acad Sci USA. 2009;106:12459–12464. doi: 10.1073/pnas.0902365106. [DOI] [PMC free article] [PubMed] [Google Scholar]
- 36.Issadore D, Min C, Liong M, Chung J, Weissleder R, Lee H. Miniature magnetic resonance system for point-of-care diagnostics. Lab Chip. 2011;11:2282–2287. doi: 10.1039/c1lc20177h. [DOI] [PMC free article] [PubMed] [Google Scholar]
- 37.Im H, Wittenberg NJ, Lesuffleur A, Lindquist NC, Oh S-H. Membrane protein biosensing with plasmonic nanopore arrays and pore-spanning lipid membranes. Chem Sci. 2010;1:688–696. doi: 10.1039/C0SC00365D. [DOI] [PMC free article] [PubMed] [Google Scholar]
- 38.Brolo AG. Plasmonics for future biosensors. Nat Photonics. 2012;6:709–713. [Google Scholar]
- 39.Ebbesen TW, Lezec HJ, Ghaemi HF, Thio T, Wolff PA. Extraordinary optical transmission through sub-wavelength hole arrays. Nature. 1998;391:667–669. [Google Scholar]
- 40*.Dahlin AB. Sensing applications based on plasmonic nanopores: The hole story. Analyst. 2015 doi: 10.1039/c4an02258k. A recent review paper discussing the development of nanopore-based plasmonic nanosensors and their applications. [DOI] [PubMed] [Google Scholar]
- 41.Jung LS, Campbell CT, Chinowsky TM, Mar MN, Yee SS. Quantitative interpretation of the response of surface plasmon resonance sensors to adsorbed films. Langmuir. 1998;14:5636–5648. [Google Scholar]
- 42.Homola J. Present and future of surface plasmon resonance biosensors. Anal Bioanal Chem. 2003;377:528–539. doi: 10.1007/s00216-003-2101-0. [DOI] [PubMed] [Google Scholar]
- 43.Im H, Sutherland JN, Maynard JA, Oh SH. Nanohole-based surface plasmon resonance instruments with improved spectral resolution quantify a broad range of antibody-ligand binding kinetics. Anal Chem. 2012;84:1941–1947. doi: 10.1021/ac300070t. [DOI] [PMC free article] [PubMed] [Google Scholar]
- 44.Cetin AE, Coskun AF, Galarreta BC, et al. Handheld high-throughput plasmonic biosensor using computational on-chip imaging. Light-Sci Appl. 2014;3:e122. [Google Scholar]
- 45.Przybilla F, Degiron A, Genet C, et al. Efficiency and finite size effects in enhanced transmission through subwavelength apertures. Opt Express. 2008;16:9571–9579. doi: 10.1364/oe.16.009571. [DOI] [PubMed] [Google Scholar]
- 46.Im H, Lesuffleur A, Lindquist NC, Oh SH. Plasmonic nanoholes in a multichannel microarray format for parallel kinetic assays and differential sensing. Anal Chem. 2009;81:2854–2859. doi: 10.1021/ac802276x. [DOI] [PMC free article] [PubMed] [Google Scholar]
- 47.Lindquist NC, Lesuffleur A, Im H, Oh SH. Sub-micron resolution surface plasmon resonance imaging enabled by nanohole arrays with surrounding Bragg mirrors for enhanced sensitivity and isolation. Lab Chip. 2009;9:382–387. doi: 10.1039/b816735d. [DOI] [PubMed] [Google Scholar]
- 48.Escobedo C, Chou YW, Rahman M, et al. Quantification of ovarian cancer markers with integrated microfluidic concentration gradient and imaging nanohole surface plasmon resonance. Analyst. 2013;138:1450–1458. doi: 10.1039/c3an36616b. [DOI] [PubMed] [Google Scholar]
- 49*.Lotvall J, Hill AF, Hochberg F, et al. Minimal experimental requirements for definition of extracellular vesicles and their functions: a position statement from the International Society for Extracellular Vesicles. J Extracell Vesicles. 2014;3:26913. doi: 10.3402/jev.v3.26913. A recent report describing molecular characteristics of extracellular vesicles. [DOI] [PMC free article] [PubMed] [Google Scholar]


