Abstract
Tuberculosis remains disproportionately concentrated among the poor, yet known determinants of tuberculosis reactivation may fail to explain observed disparities in disease rates according to wealth. Reviewing data on tuberculosis disparities in India and the wealth distribution of known tuberculosis risk factors, we describe how social mixing patterns could be contributing to tuberculosis disparities. Wealth-assortative mixing, wherein individuals are more likely to contact others from similar socioeconomic backgrounds, amplifies smaller differences in risk of tuberculosis, resulting in large population-level disparities. As disparities and assortativeness increase, tuberculosis becomes more difficult to control, an effect that is obscured by looking at population averages of epidemiological parameters, such as case detection rates. We illustrate how tuberculosis control efforts may benefit from preferential targeting toward the poor. In India, an equivalent-scale intervention could have a substantially greater impact if targeted to those living below the poverty line, compared with a population-wide strategy. In addition to potential efficiencies in targeting higher-risk populations, tuberculosis control efforts would reduce more secondary tuberculosis cases, per primary case diagnosed, if they were preferentially targeted to the poor. We highlight the need to collect programmatic data on tuberculosis disparities and explicitly incorporate equity considerations in tuberculosis control plans.
Keywords: disparities, poverty, models, social mixing, policy
Introduction
The associations between tuberculosis and poverty have been well described across an array of settings and time periods, from the pre-chemotherapeutic era to the present age of publically supported, directly observed therapy, short-course (DOTS).1–6 More recent studies have suggested that, in addition to absolute poverty, income inequality within communities may represent an independent driver of tuberculosis.7 The World Health Organization, citing wealth disparities in tuberculosis prevalence and outcomes, issued a recommendation that countries “address poverty in TB control” by reducing barriers to access for tuberculosis care among the poor.8 The specific implications of disparities on tuberculosis epidemics and anticipated impact of poverty-focused strategies have received less attention.
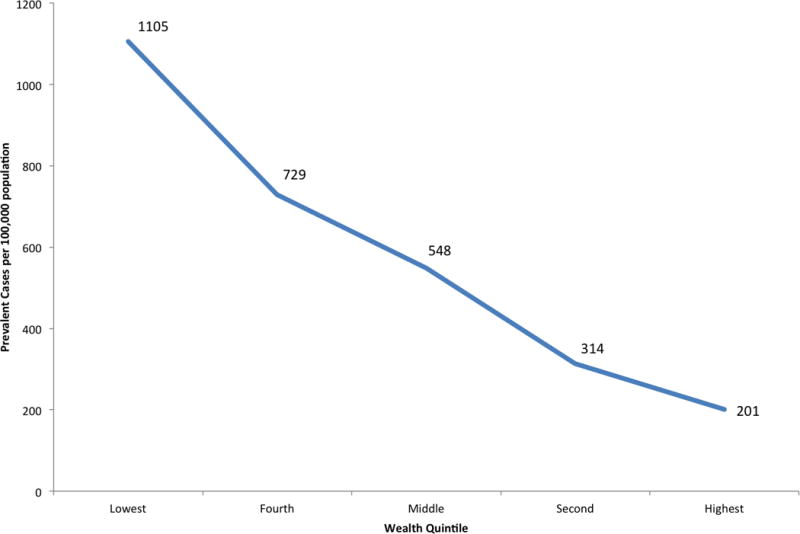
In this paper, we examine critical areas of intersection between poverty and tuberculosis epidemiology, and discuss the fundamental consequences of disparities on tuberculosis control. We use the example of India, home to the world’s largest tuberculosis epidemic, which falls along a steep wealth gradient: the poorest quintile of the population have more than five-fold greater prevalence (1,105 cases/100,000) than the wealthiest quintile (201 cases/100,000) (Figure 1).9 Drawing upon basic principles in mathematical epidemiology, we illustrate the role of social mixing in critically shaping disparities in the distribution of tuberculosis, and demonstrate how the concentration of disease risk and transmission among the poor presents challenges and opportunities for the control of tuberculosis.
Figure 1.

Prevalence of self-reported tuberculosis by wealth quintile in the National Family Health Survey-III (adapted from Oxlade and Murray9).
Explaining extreme tuberculosis disparities in India
Despite well-established linkages between tuberculosis and poverty, it has not been clear whether the association is primarily due to: 1) poverty-related risk factors leading to differential risk of tuberculosis progression or reactivation; or 2) differences in risks of tuberculosis exposure, due to crowded living conditions and social contact patterns. Most of the research aimed at understanding disparities in the burden of tuberculosis has focused on individual-level risk factors, including low body mass, HIV, diabetes, tobacco use, alcohol use, and indoor air pollution.9–11 Drawing upon data from the National Family Health Survey (NFHS), Oxlade and Murray found that most of these risk factors (other than HIV and diabetes) are more prevalent among the poorer wealth quintiles in India (Table S1).9
We aimed to assess the extent to which known determinants could explain observed disparities in India. To do so, we calculated a summary incidence rate ratio (IRR), comparing the poorest 40% (representing those living on less than $1.25 per day, the World Bank poverty threshold, in 2005 at the time of NFHS-III12) against the wealthiest 60%. Using data on prevalence of risk factors by wealth quintile in India from NFHS, the summary IRR was 1.40 (40% increase), whereas the observed prevalence ratio was 2.59 (159% increase). This large discrepancy suggests that the distribution of known risk factors for disease progression does not fully explain observed disease disparities.
Conventional epidemiologic limitations – including unmeasured risk factors or differential measurement according to wealth – undoubtedly account for some of this discrepancy, but it seems unlikely that such limitations explain a four-fold difference. However, three additional mechanisms could explain the gap between observed and predicted prevalence:
Poverty is associated with a longer duration of disease (e.g., due to reduced healthcare access).
The poor have a higher effective contact rate, due to crowding and poorly ventilated living conditions.
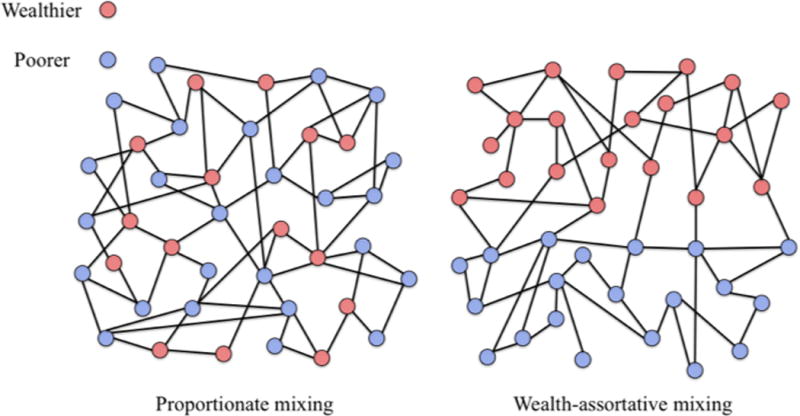
Poor individuals mix largely with other poor individuals, and wealthy individuals mix with other wealthy individuals (i.e., assortative mixing; Figure 2)
Figure 2. Comparison of proportionate versus assortative mixing by wealth group.

In proportionate (or non-wealth-assortative) mixing, the two wealth classes have equal contact rates with each wealth class, proportionate to the size of the wealth class; in wealth-assortative mixing, the majority of contacts occur within each wealth class.
These three mechanisms involve differential transmission, and cannot be easily be assessed by conventional regression methods. Furthermore, data on these three characteristics are sparse. While some studies have found associations between poverty and treatment delays,13 data on diagnostic delays by socioeconomic status in India are limited and conflicting.14–16 Historical studies have demonstrated the role of crowding and poor living conditions on the risk of tuberculosis transmission within households.17 But there are no published data on respiratory contact rates or assortativeness of mixing by socioeconomic group within India or other developing countries.
We performed an exploratory analysis to examine these factors, evaluating the magnitude of socioeconomic differentials in time to diagnosis, contact rates, and assortativeness that would be required to explain the observed residual disparities in tuberculosis prevalence beyond that predicted from the NFHS data, comparing the wealthiest 60% to the poorest 40%. To accomplish this, we modified published models of tuberculosis18 to incorporate structure on wealth (Supplementary Appendix).
In the absence of assortative mixing, the duration of infectiousness and contact rates would both have to be 58% greater among the poor, for example, to produce the observed, 2.6-fold disparity in prevalence. However, the magnitude of differences required declines as assortativeness increases. If 90% of one’s contacts occur within one’s wealth strata (rather than 50% assumed by proportionate mixing), the duration of infectiousness and contact rates would only need to be 22% greater. Assortative mixing by socioeconomic status may therefore be a critical amplifier of tuberculosis disparities, without which it is difficult to explain the observed magnitude of inequality in disease distribution.
Disparities and assortative mixing as obstacles to tuberculosis control
A fundamental implication of the link between assortative mixing and disparities in tuberculosis prevalence is that tuberculosis becomes more difficult to control at a population level. To demonstrate this, we draw upon the concept of the disease reproductive number (R0), defined as the average number of secondary cases of disease that arise due to transmission from a single infectious person. Among other things, R0 sheds light on how difficult it will be to control a disease, with high R0 infections more difficult to control than those with lower R0. If R0 < 1, a disease will die out in a population.
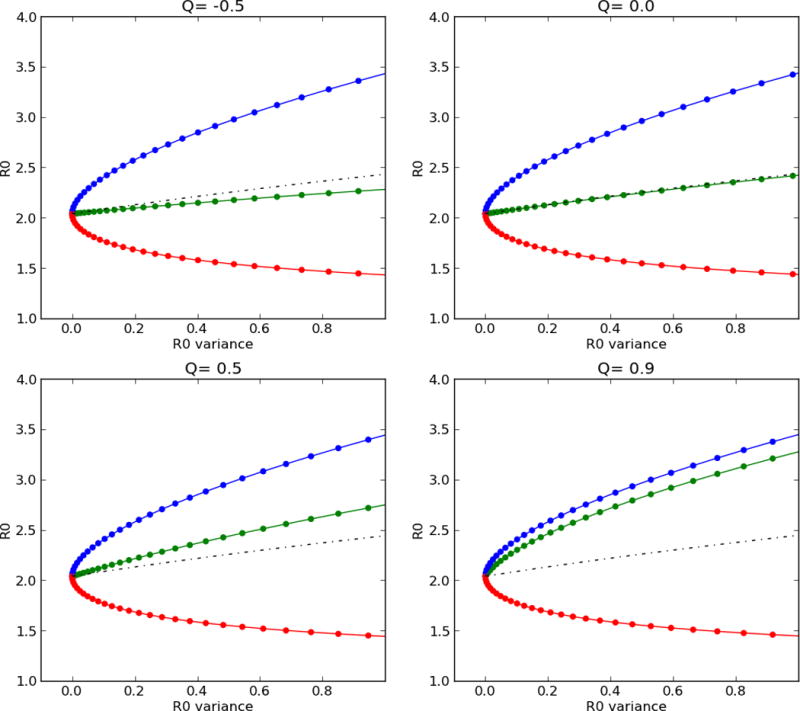
For tuberculosis, this requires consideration of both the number of individuals infected by one person and the probability that those individuals subsequently develop active tuberculosis. When wealth-assortative mixing is present, the poor are more likely to contact the poor, who are in turn more likely to develop disease, have more secondary contacts, and remain infectious for a longer period of time. Thus, a single case of tuberculosis can generate more secondary cases of disease. We illustrate this in Figure 3: the population R0 increases as a function of disparities (depicted as the variance in R0 between the wealthy and poor) and assortative mixing. Transmission within a high-risk group for subsequent disease acts as positive reinforcement for tuberculosis.
Figure 3. Reproductive number as a function of disparities and assortative mixing.

Assortative mixing (Q) is varied in each panel from non-assortative (Q= −0.5, upper left) to highly assortative (Q=0.9, lower right), and variance in reproductive number between the rich (red line) and poor (blue line) is shown on each x-axis. The mean reproductive number (black dashed line) and population reproductive number (green line) are depicted for each scenario.
This observation has been frequently noted in the epidemiological literature on sexually transmitted infections which posits a “core” mixing population — a group that has a high number of sexual contacts.25 The existence of a core population increases the reproductive number and thus makes it more challenging to control a disease, if control strategies are not targeted at the core group.26 In the case of tuberculosis, assuming homogeneous values for diagnosis rates, contacts, and progression risks, and failing to account for assortative mixing, could lead to substantial overestimation of the impact of untargeted tuberculosis control interventions in a specific setting. The concentration of disease and transmission among the poor may explain why the tuberculosis epidemic has been slow to improve despite the successful global rollout of the DOTS program and optimistic predictions from epidemiologic models that ignore this heterogeneity.
The benefits of targeting tuberculosis interventions to the poor
Conversely, the presence of assortative mixing also offers an opportunity in tuberculosis control: tuberculosis interventions targeted to the poor may, in fact, be more efficient at averting transmission than would otherwise be projected. Not only will such targeted interventions have a higher yield (e.g., lower number needed to screen) due to the higher background prevalence, but when disparities in natural history or transmission parameters and wealth-assortative mixing are present, targeted interventions will result in a greater reduction in secondary transmission achieved per case diagnosed.
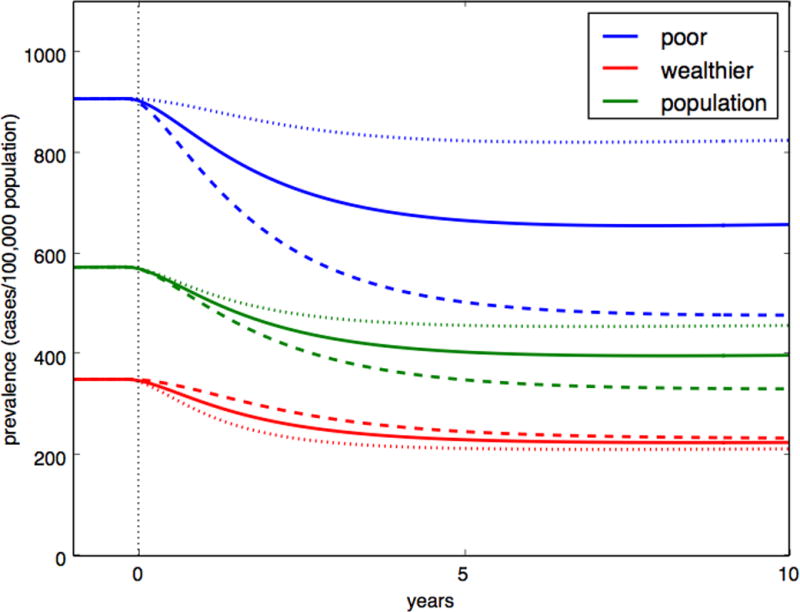
We illustrate this with the rollout of a hypothetical early diagnostic program in India, which doubles the rate of diagnosis for 75 patients per 100,000 population (i.e. approximately 25% of all patients with tuberculosis). We compare this program, deployed homogenously throughout the population, to an intervention of equivalent scale that is targeted to the wealthier group or to the poor. When the intervention is targeted to the poor, its impact on population prevalence of tuberculosis is 27% greater than the untargeted intervention, while the impact of the wealthy-targeted intervention (e.g., a new diagnostic test that is rolled out to referral centers accessed primarily by the wealthy) was 23% less (Figure 4). The actual differences are likely even greater, as we did not account for the impoverishing effects of tuberculosis,27,28 which can result in feedback loops or “poverty traps” that further amplify disparities.29 Moreover, fewer people may need to be screened in the poor population to identify 75 patients with tuberculosis, making the intervention targeted to the poor not only more effective per case diagnosed, but more efficient as well.
Figure 4. Impact of early diagnostic strategies by population targeted.

Comparison of the projected impact of an equivalent-scale diagnostic intervention, resulting in additional diagnosis of 75 per 100,000 persons per year, that is untargeted (solid line); targeted at the wealthier 60% (dotted line); or targeted at the poorest 40% (dashed line), with the outcome of tuberculosis prevalence over 10 years. Here, assortativeness is assumed to be 0.8, and the reactivation rate and contact rate was varied between groups.
Bringing disparities into focus in global tuberculosis control
Given the critical importance of disparities to the success of tuberculosis interventions, we argue that equity should be explicitly considered in developing tuberculosis control plans. We highlight two key ways in which to do so.
First, data on tuberculosis disparities should be collected and reported along with conventional programmatic metrics.30 Global programs for tuberculosis control rely heavily on metrics such as the case notification rate; the value of collecting and collating such programmatic data enables programs to assess progress in tuberculosis and to project need for further resource investment. However, a setting with significant wealth disparities in TB distribution may require more resources to achieve the same population-level impact on TB incidence than a setting with equivalent incidence but fewer disparities. It is therefore critically important to understand the extent to which wealth disparities exist, and to which tuberculosis is concentrated among high-risk subpopulations. Including data on wealth in required notification reports would enable global comparison of these disparities and would help in framing the challenges that lie ahead, setting targets for specific populations.
Obtaining data on mixing by socioeconomic status has been more challenging, though the conditions for wealth assortative mixing are evident. Differential classes of service within public transport, the concentration of poverty in urban slums or rural agricultural communities, and persistent regional inequality in India are suggestive of various levels at which wealth classes are physically separated.19 However, while a number of recent studies have been performed to understand social contact patterns in different populations by age and household structure,20–22 none has examined mixing by wealth status or other demographic factors. With recent technological advances, it may be possible to enumerate social networks in greater detail and understand how those social contacts differ by socioeconomic status.23,24 Such insights are essential to explain disparities in the burden of tuberculosis and other diseases of poverty.
Second, policies should explicitly target the poorest and highest risk populations for interventions. In India, as in many other low- and middle-income countries, there is geographic clustering of poverty both between and within areas—for example, large slums. In the NFHS data, self-reported tuberculosis was 822/100,000 in slum areas compared with 321/100,000 in non-slum urban areas. Dowdy et al. projected that targeting hotspots in slums of Rio de Janeiro could be an extremely effective means to control tuberculosis in the broader population.31 Strategic placement of diagnostic resources in geographic settings that serve poor, high-risk areas could be an efficient approach to reducing the tuberculosis burden.
By contrast, there is a risk that new diagnostic tests could exacerbate disparities if they are preferentially accessed by wealthier individuals. In India, for example, an initiative aims to expand access to Xpert MTB/RIF by selling discounted kits to a consortium of private laboratories in return for their charging a lower price than currently offered. However, the price that the patient pays is still estimated to be around $35 per test.32 This cost may be prohibitive for the poorest patients. If this program is not complemented by scale-up of Xpert MTB/RIF in the free public sector, therefore, disparities in diagnosis could increase. By contrast, targeted subsidies for access to TB diagnosis among the poorest individuals—for example, those with a below poverty line (BPL) card—could reduce disparities and have a greater impact on tuberculosis transmission. The success of any intervention to reduce disparities in access to diagnostics will be dependent on measuring inequities in utilization;33 collection of socioeconomic measures for monitoring tuberculosis diagnostic utilization could yield this critical data.34
There already exist two compelling arguments for improving access for the poor for tuberculosis interventions. The first is a moral one, grounded in the concept of equity. The second is one of efficiency – to make optimal use of limited resources, we should go where the disease is. We add a third argument for addressing inequities in the distribution of tuberculosis, namely that interventions tailored for the poor will have greater impact on tuberculosis transmission per case diagnosed, due to heterogeneities in risk and assortative mixing. Measuring and reporting on wealth disparities in tuberculosis, followed by development and implementation of interventions that favor the poor, may empower countries to develop tuberculosis control strategies that are more ethically sound, more efficient, and at the end of the day, more effective as well.
Supplementary Material
Acknowledgments
JRA is supported by the National Institute of Allergy and Infectious Diseases (K01 AI104411).
Footnotes
Conflicts of Interest: None
References
- 1.Terris M. Relation of economic status to tuberculosis mortality by age and sex. Am J Public Health Nations Health. 1948;38(8):1061–1070. doi: 10.2105/ajph.38.8.1061. [DOI] [PMC free article] [PubMed] [Google Scholar]
- 2.Terris M, Monk MA. The validity of socio-economic differentials in tuberculosis mortality. Am Rev Respir Dis. 1960;81:513–517. doi: 10.1164/arrd.1960.81.4.513. [DOI] [PubMed] [Google Scholar]
- 3.Hoa NB, Tiemersma EW, Sy DN, et al. Household expenditure and tuberculosis prevalence in Vietnam: prediction by a set of household indicators. Int J Tuberc Lung Dis. 2011;15(1):32–37. [PubMed] [Google Scholar]
- 4.Hossain S, Quaiyum MA, Zaman K, et al. Socio Economic Position in TB Prevalence and Access to Services: Results from a Population Prevalence Survey and a Facility-Based Survey in Bangladesh. PLoS ONE. 2012;7(9):e44980. doi: 10.1371/journal.pone.0044980. [DOI] [PMC free article] [PubMed] [Google Scholar]
- 5.Olson NA, Davidow AL, Winston CA, Chen MP, Gazmararian JA, Katz DJ. A national study of socioeconomic status and tuberculosis rates by country of birth, United States, 1996–2005. BMC Public Health. 2012;12:365. doi: 10.1186/1471-2458-12-365. [DOI] [PMC free article] [PubMed] [Google Scholar]
- 6.Nana Yakam A, Noeske J, Dambach P, Bowong S, Fono LA, Ngatchou-Wandji J. Spatial analysis of tuberculosis in Douala, Cameroon: clustering and links with socio-economic status. The International Journal of Tuberculosis and Lung Disease. 2014;18(3):292–297. doi: 10.5588/ijtld.13.0573. [DOI] [PubMed] [Google Scholar]
- 7.Harling G, Ehrlich R, Myer L. The social epidemiology of tuberculosis in South Africa: a multilevel analysis. Soc Sci Med. 2008;66(2):492–505. doi: 10.1016/j.socscimed.2007.08.026. [DOI] [PubMed] [Google Scholar]
- 8.World Health Organization. Addressing poverty in TB control: options for national TB control programmes. Geneva, Switzerland: World Health Organization; 2005. [Google Scholar]
- 9.Oxlade O, Murray M. Tuberculosis and poverty: why are the poor at greater risk in India? PLoS ONE. 2012;7(11):e47533. doi: 10.1371/journal.pone.0047533. [DOI] [PMC free article] [PubMed] [Google Scholar]
- 10.Murray M, Oxlade O, Lin H-H. Modeling social, environmental and biological determinants of tuberculosis. Int J Tuberc Lung Dis. 2011;15(Suppl 2):S64–70. doi: 10.5588/ijtld.10.0535. [DOI] [PubMed] [Google Scholar]
- 11.Lönnroth K, Jaramillo E, Williams BG, Dye C, Raviglione M. Drivers of tuberculosis epidemics: the role of risk factors and social determinants. Soc Sci Med. 2009;68(12):2240–2246. doi: 10.1016/j.socscimed.2009.03.041. [DOI] [PubMed] [Google Scholar]
- 12.The World Bank. World Bank Open Data: free and open access to data about development in countries around the globe. Available at: data.worldbank.org. Accessed February 10, 2014.
- 13.Storla DG, Yimer S, Bjune GA. A systematic review of delay in the diagnosis and treatment of tuberculosis. BMC Public Health. 2008;8:15. doi: 10.1186/1471-2458-8-15. [DOI] [PMC free article] [PubMed] [Google Scholar]
- 14.Rajeswari R, Chandrasekaran V, Suhadev M, Sivasubramaniam S, Sudha G, Renu G. Factors associated with patient and health system delays in the diagnosis of tuberculosis in South India. Int J Tuberc Lung Dis. 2002;6(9):789–795. [PubMed] [Google Scholar]
- 15.Sudha G, Nirupa C, Rajasakthivel M, et al. Factors influencing the care-seeking behaviour of chest symptomatics: a community-based study involving rural and urban population in Tamil Nadu, South India. Trop Med Int Health. 2003;8(4):336–341. doi: 10.1046/j.1365-3156.2003.01010.x. [DOI] [PubMed] [Google Scholar]
- 16.Tamhane A, Ambe G, Vermund SH, Kohler CL, Karande A, Sathiakumar N. Pulmonary Tuberculosis in Mumbai, India: Factors Responsible for Patient and Treatment Delays. Int J Prev Med. 2012;3(8):569–580. [PMC free article] [PubMed] [Google Scholar]
- 17.Chapman JS, Dyerly MD. Social and other factors in intrafamilial transmission of tuberculosis. Am Rev Respir Dis. 1964;90:48–60. doi: 10.1164/arrd.1964.90.1.48. [DOI] [PubMed] [Google Scholar]
- 18.Blower SM, McLean AR, Porco TC, et al. The intrinsic transmission dynamics of tuberculosis epidemics. Nat Med. 1995;1(8):815–821. doi: 10.1038/nm0895-815. [DOI] [PubMed] [Google Scholar]
- 19.Singh N, Kendall J, Jain RK, Chander J. Regional Inequality in India in the 1990s: Trends and Policy Implications. Mumbai: Reserve Bank of India; 2010. Available at: http://www.rbi.org.in/scripts/PublicationsView.aspx?id=12292. Accessed February 10, 2014. [Google Scholar]
- 20.Mossong J, Hens N, Jit M, et al. Social contacts and mixing patterns relevant to the spread of infectious diseases. PLoS Med. 2008;5(3):e74. doi: 10.1371/journal.pmed.0050074. [DOI] [PMC free article] [PubMed] [Google Scholar]
- 21.Horby P, Pham QT, Hens N, et al. Social contact patterns in Vietnam and implications for the control of infectious diseases. PLoS ONE. 2011;6(2):e16965. doi: 10.1371/journal.pone.0016965. [DOI] [PMC free article] [PubMed] [Google Scholar]
- 22.Johnstone-Robertson SP, Mark D, Morrow C, et al. Social mixing patterns within a South African township community: implications for respiratory disease transmission and control. Am J Epidemiol. 2011;174(11):1246–1255. doi: 10.1093/aje/kwr251. [DOI] [PMC free article] [PubMed] [Google Scholar]
- 23.Read JM, Edmunds WJ, Riley S, Lessler J, Cummings DAT. Close encounters of the infectious kind: methods to measure social mixing behaviour. Epidemiol Infect. 2012;140(12):2117–2130. doi: 10.1017/S0950268812000842. [DOI] [PMC free article] [PubMed] [Google Scholar]
- 24.Salathé M, Bengtsson L, Bodnar TJ, et al. Digital Epidemiology. PLoS Comput Biol. 2012;8(7):e1002616. doi: 10.1371/journal.pcbi.1002616. [DOI] [PMC free article] [PubMed] [Google Scholar]
- 25.Keeling MJ, Rohani P. Modeling Infectious Diseases in Humans and Animals. Princeton University Press; 2007. [Google Scholar]
- 26.Yorke JA, Hethcote HW, Nold A. Dynamics and control of the transmission of gonorrhea. Sex Transm Dis. 1978;5(2):51–56. doi: 10.1097/00007435-197804000-00003. [DOI] [PubMed] [Google Scholar]
- 27.Pantoja A, Floyd K, Unnikrishnan KP, et al. Economic evaluation of public-private mix for tuberculosis care and control, India. Part I. Socio-economic profile and costs among tuberculosis patients. Int J Tuberc Lung Dis. 2009;13(6):698–704. [PubMed] [Google Scholar]
- 28.Barter DM, Agboola SO, Murray MB, Bärnighausen T. Tuberculosis and poverty: the contribution of patient costs in sub-Saharan Africa–a systematic review. BMC Public Health. 2012;12:980. doi: 10.1186/1471-2458-12-980. [DOI] [PMC free article] [PubMed] [Google Scholar]
- 29.Bonds MH, Keenan DC, Rohani P, Sachs JD. Poverty trap formed by the ecology of infectious diseases. Proc Biol Sci. 2010;277(1685):1185–1192. doi: 10.1098/rspb.2009.1778. [DOI] [PMC free article] [PubMed] [Google Scholar]
- 30.Van Leth F, Guilatco RS, Hossain S, et al. Measuring socio-economic data in tuberculosis prevalence surveys. Int J Tuberc Lung Dis. 2011;15(Suppl 2):S58–63. doi: 10.5588/ijtld.10.0417. [DOI] [PubMed] [Google Scholar]
- 31.Dowdy DW, Golub JE, Chaisson RE, Saraceni V. Heterogeneity in tuberculosis transmission and the role of geographic hotspots in propagating epidemics. Proc Natl Acad Sci USA. 2012;109(24):9557–9562. doi: 10.1073/pnas.1203517109. [DOI] [PMC free article] [PubMed] [Google Scholar]
- 32.Anand G. Plan to fight deadly TB strain gains in India. Wall Street Journal. 2013 Mar 17; [Google Scholar]
- 33.Squire SB, Ramsay ARC, van den Hof S, et al. Making innovations accessible to the poor through implementation research. Int J Tuberc Lung Dis. 2011;15(7):862–870. doi: 10.5588/ijtld.11.0161. [DOI] [PubMed] [Google Scholar]
- 34.Nhlema Simwaka B, Benson T, Salaniponi FML, Theobald SJ, Squire SB, Kemp JR. Developing a socio-economic measure to monitor access to tuberculosis services in urban Lilongwe, Malawi. Int J Tuberc Lung Dis. 2007;11(1):65–71. [PubMed] [Google Scholar]
Associated Data
This section collects any data citations, data availability statements, or supplementary materials included in this article.


