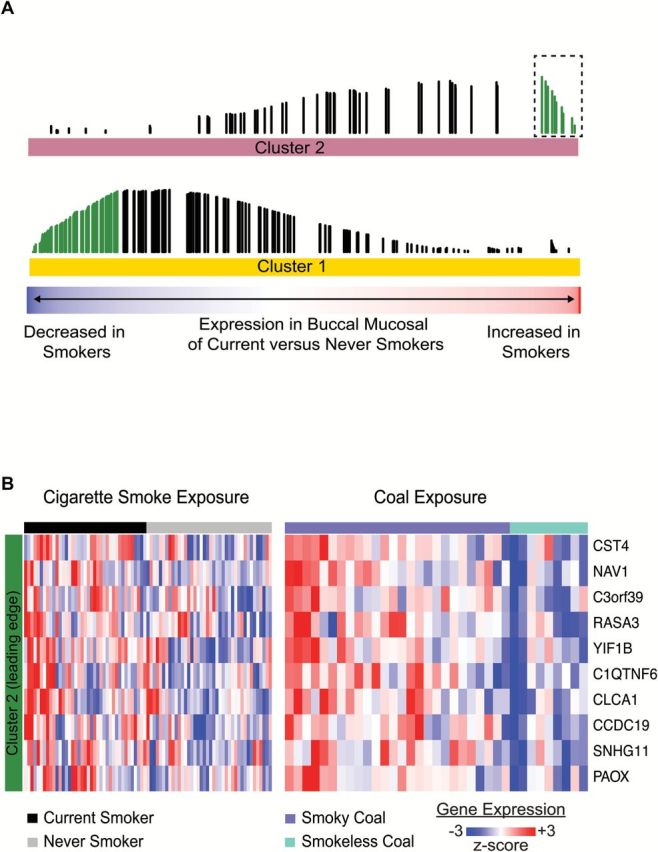
Figure 3.

The buccal gene-expression pattern associated with household air pollution has significant similarities to the pattern associated with cigarette smoking. (A) Distribution of 282 genes associated with smoky versus smokeless coal exposure among all genes ranked according to their differential expression in current smokers versus never smokers from dataset GSE17913. Genes expressed at higher levels in the buccal mucosa of smoky coal users are significantly enriched (GSEA, q < 0.05) among the genes most highly induced in the buccal mucosa of current smokers (top). There is a similar enrichment between genes that are repressed by smoky coal and cigarette smoke (bottom). The bottom color bar represents the degree to which the gene is altered in current smokers (red: increased in smokers, blue: decreased in smokers). Each vertical line represents one of the 282 genes, the height of which represents the running GSEA enrichment score. Green lines represent the leading edge genes or subset of genes most concordantly up- or down-regulated with respect to dataset GSE17913. (B) Supervised heatmap of 10 leading edge genes from Cluster 2 (boxed green lines in A) generated across current smokers and never smokers (left), and subjects exposed to smoky or smokeless coal (right).
