Abstract
Myocardium subtended by obstructive coronary artery disease (CAD) may show reduced left ventricle (LV) global longitudinal strain (GLS), as well as early systolic lengthening (ESL) before shortening; these can be measured at rest and may predict obstructive CAD. This study investigated whether baseline resting LV longitudinal strain measurements may be able to detect significant CAD in patients undergoing stress echocardiography (SE) and coronary angiography, who have normal resting wall motion. We selected patients with a clinical indication of coronary angiography who were previously referred for SE. Patients with known CAD, rest wall-motion (WM) abnormalities, or rhythm/conduction abnormalities were excluded. Speckle tracking strain analyses were retrospectively performed on digitally archived 2D video-loops, using vendor independent software. Peak GLS and duration of ESL were recorded. Diagnostic accuracy of each parameter to predict obstructive (≥50%) CAD was assessed and multivariate logistic regression models fitted and compared. Eighty-two patients were enrolled and 49 had significant CAD by quantitative angiography. Patients with CAD were more often male (P=0.01) and more frequently presented with typical angina (P<0.01). Among rest and stress variables, GLS showed a Youden index of 0.665, while SE WM assessment showed a Youden index of 0.599. These were the only two parameters that remained predictive in multivariate analyses. In conclusion, rest GLS demonstrated comparable accuracy with stress-echo data for prediction of angiographically obstructive CAD; it also added significant CAD prediction when combined with clinical data, similar to SE WM assessment.
Keywords: coronary artery disease, speckle tracking echocardiography, global strain, stress echocardiography, coronary flow reserve
Introduction
Noninvasive identification of patients with coronary artery disease (CAD) remains a clinical challenge despite the widespread use, and possible overuse, of imaging and provocative testing; more than 50% of patients currently referred to coronary angiography show normal or non-obstructive CAD (1).
Although strain imaging has a potential role in the diagnosis and management of virtually any disease that affects the myocardium, arguably its greatest potential is in the detection of ischemic heart disease, because longitudinal mechanics predominate in the ischemia-vulnerable subendocardium (2). Several studies have demonstrated that significant coronary artery stenosis might cause persistently impaired longitudinal left ventricle (LV) function at rest, which may go undetected by visual assessment but not when two-dimensional speckle tracking echocardiography (2D-STE) is used for quantification of LV function (2, 3, 4, 5, 6). This would be especially true in patients with higher risk coronary stenoses, where there may be intermittent ischemia that results in subtle forms of stunning that may be detectable with strain measurements. However, stress-echocardiography (SE), either pharmacologic or with exercise, remains to date the only echocardiographic technique used to triage patients with suspected CAD symptoms and no wall-motion (WM) abnormalities in rest conditions. We aimed to assess whether the diagnostic accuracy of 2D-STE global longitudinal strain (GLS) or early systolic lengthening (ESL) measured at rest may compare, be synergistic or incremental to the parameters which can be measured today during SE to predict angiographically obstructive CAD, i.e. WM and Doppler coronary flow reserve on the left anterior descending coronary artery (CFR–LAD) (7).
Materials and methods
Patients
This study was conducted in a single tertiary coronary care center using a retrospective design. Patients with a clinical indication of coronary angiography, who also underwent contrast SE less than 2 months before the angiogram, between 2011 and 2012, and whose 2D acoustic windows were deemed fair to optimal, were considered.
The following exclusion criteria were then applied: i) history of myocardial infarction (MI) and/or previous percutaneous/surgical revascularization or valve surgery, ii) myocardial scar or WM abnormalities in rest echocardiography, iii) LV ejection fraction (LVEF) <55%, iv) more than mild valvular disease, and v) atrial fibrillation or bundle branch block with QRS >120 ms.
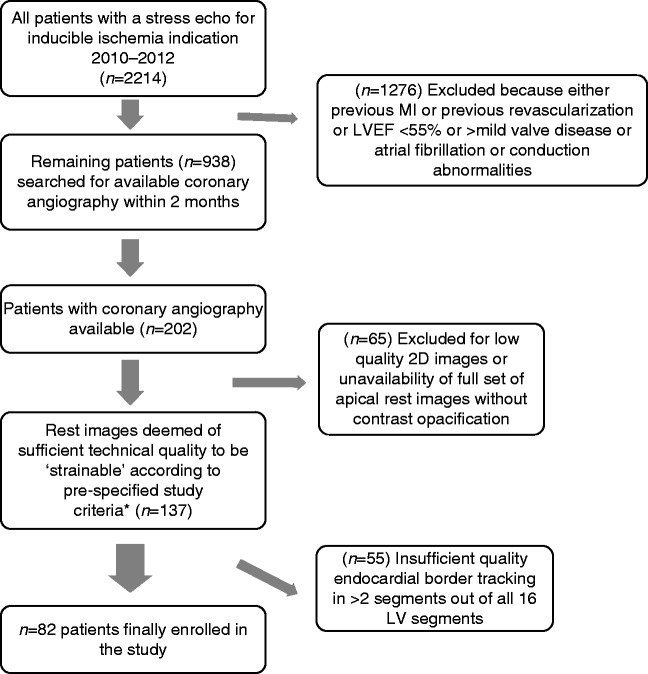
Figure 1 illustrates total patients under consideration for recruitment over the study period and the reasons for exclusion, leading to the final sample size of 82 patients.
Figure 1.
Algorithm showing total patients under consideration for recruitment over the study period and the reasons for exclusion, leading to the final selected sample of 82 patients.
Echocardiographic studies
All the studies were performed using a Philips iE33 scanner (Philips Ultrasound, Bothell, WA, USA), equipped with standard phased-array transducers. LV volumes were traced manually at end-diastole and end-systole in apical four- and two-chamber views and LVEF was derived from the modified biplane Simpson's method. All patients underwent high-dose accelerated dipyridamole stress, using the 0.84 mg/kg, 6-min protocol. β-blockers were withheld per-protocol at least 24 h before the test. 2D echocardiography, 12-lead electrocardiographic, and blood pressure monitoring were performed in accordance with established standard protocols. Aminophylline was routinely used to reverse the effect of dipyridamole. Phospholipid-encapsulated microbubble SonoVue (Bracco Imaging, Milan, Italy) was routinely used in repeated 0.5-ml i.v. boluses for LV opacification at rest and after dipyridamole by activation of the specific preset for contrast WM analysis (mechanical index 0.27 and frame rate 40 Hz) in the apical four-, two-, and three-chamber views. Wall motion was assessed at rest and after dipyridamole infusion. Coronary flow in the mid-distal left anterior descending coronary artery was sought in the low parasternal long-axis or modified two-chamber view; color-coded blood flow was visualized both at rest and peak stress using contrast enhancement, and flow velocities were measured at baseline and at peak stress (before aminophylline injection). More details regarding the dipyridamole protocol, WM, and CFR–LAD assessment have been previously published (7).
A 16-segment LV classification was used for analysis; the left anterior descending territory was identified as the four left ventricular apical segments, three mid segments (septal, anteroseptal and anterior), and two basal segments (anterior and anteroseptal); the circumflex territory as the two anterolateral and two inferolateral segments (basal and mid); the right coronary artery as the two inferior (basal and mid) segments plus the basal septum.
Strain analyses
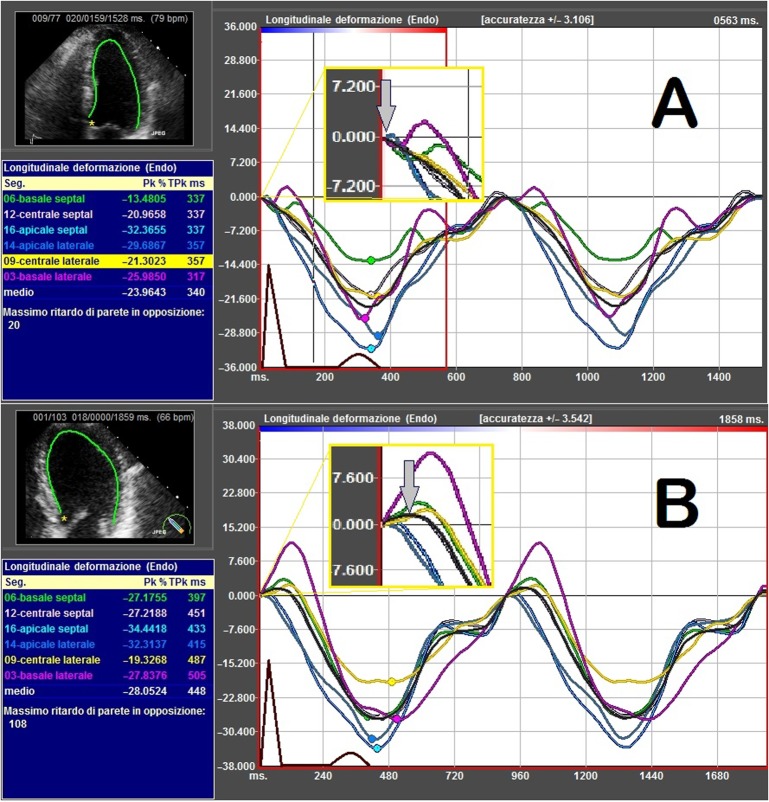
Two consecutive heart cycles at rest, from the three standard apical planes (four-chamber, two-chamber, and long-axis), were considered by conventional 2D gray scale echocardiography; vendor-independent software (TomTec 2D Cardiac Performance Analyses, Munich, Germany) was used and longitudinal strain was measured by 2D-STE using a 16 LV segment model. All measurements were obtained before contrast administration. In each of the apical views, the endocardial contour was manually drawn and tracking of deformation was automatically performed by the software, once visual confirmation of good quality tracking was given by the operator. The average frame rate of included 2D video clips was 42±5/s, depending on the acquisition frame rate originally used during the SE study (our digital storage system uses a vendor proprietary file format, which maintains original acquisition frame rate). For each LV segment, the peak negative systolic strain value (representing maximum segmental systolic shortening) was automatically recorded and averaged for each apical view, while average time to peak positive early systolic strain or lengthening (ESL) was manually measured in each apical view by pointing the electronic caliper on the tracing, which represents the average strain in each view (Fig. 2 graphically shows how ESL time measures were performed). The duration of ESL was defined as time from onset of the Q wave on electrocardiography (ECG) (R wave if the Q wave was absent) to maximum myocardial systolic lengthening. Both GLS and ESL were then averaged for the three apical views.
Figure 2.
Segment-by-segment and average (black line) tracings representing longitudinal strain (%) during two full heart cycles in two patients. QRS has been drawed and superimposed to clarify timing. Black line represents the average strain and was used for time measurements. On X-axis time and on Y-axis longitudinal strain amplitude are represented. (A) Normal case. (B) Abnormal case. (A, upper panel) Grey arrow indicates absence of early longitudinal systolic strain (magnified yellow bordered box) in the four-chamber view in a patient without obstructive coronary artery disease. (B, lower panel) Grey arrow shows significant (73 ms) early longitudinal systolic strain (magnified yellow bordered box) in the four-chamber view for a patient with obtructive coronary artery disease.
The study was approved by the Committee for Medical Research, and all subjects gave written informed consent. The echocardiographic data were analyzed while blinded to all clinical information.
Coronary angiography
Coronary angiography was performed on clinical indication or based on results of the provocative tests by standard (Judkins) technique, using digital imaging acquisition and storage. Coronary artery stenosis visually estimated at ≥50% were considered obstructive (or significant) CAD. Subsequent distinctions between ≥50% stenosis and severe >70% stenosis were also made using QCA software (CAAS, Pie Medical Imaging, Maastricht, The Netherlands).
Statistical analyses
All continuous data are expressed as mean±s.d. Differences between groups were analyzed by independent Student's t-test, χ 2 tests were used to compare discrete data between groups; receiver-operating characteristic (ROC) curve analyses was performed to determine the accuracy of GLS and ESL to detect obstructive CAD, with an area under the curve (AUC) value of 0.50 indicating no accuracy and a value of 1.00 indicating maximal accuracy. The optimal cutoff was defined as the value of the ROC curve that was closest to the upper left corner. The Youden index was calculated as (1−(1–sensitivity)+(1–specificity)) and summarizes both sensitivity and specificity in one number between 0 and 1. The higher the Youden index, the better the diagnostic accuracy of the test. Univariate and multivariate logistic regression analyses were performed to evaluate the association between the presence of significant CAD and age, gender, typical or atypical angina, hypertension, diabetes mellitus, hypercholesterolemia, current smoker status, obesity (BMI >30), LVEF and the following rest and stress-echocardiographic variables: rest GLS, rest ESL (both strain parameters dichotomized based on best cutoff from ROC plots), reversible WM, and CFR–LAD <2.
All variables found significant on univariate logistic regression were considered for multiple regression analyses. Odds ratios and 95% CIs were calculated.
The incremental value of rest strain or stress echocardiographic information over clinical data and LVEF was assessed in three modeling steps. The first step consisted of fitting a multivariate logistic regression model of clinical data; one single additional rest strain or stress echocardiographic parameter was alternatively added to this model (normal vs abnormal), followed by a second parameter (normal vs abnormal) in the last modeling step. The significance of adding additional variables to previous modeling steps was based on the change in model-based likelihood statistics, with degrees of freedom equal to the number of additional variables. Rest strain variables (GLS and ESL) were analyzed repeatedly by two independent observers on ten randomly selected patients and results were expressed as Cronbach's α. All P values were two-tailed and a significance level of 0.05 was used. All statistical analyses were performed on Statsdirect version 2.7.9 Statistical Software (StatsDirect Ltd, Cheshire, UK).
Results
Baseline characteristics
Eighty-two patients were included in the study. The demographic data according to the study groups are given in Table 1. Patients with significant CAD were more frequently male (P=0.012) and more frequently reported typical angina vs atypical symptoms (P=0.005). All other clinical variables were comparable between CAD and nonsignificant CAD (nsCAD) groups.
Table 1.
Clinical characteristics of the study group
| Variables | nsCAD (n=33) | CAD ≥50% (n=49) | P value |
|---|---|---|---|
| Age | 62.4±12 | 64.9±11 | 0.34 |
| Males n (%) | 13 (39) | 33 (67) | 0.012 |
| Hypertension | 18 (54) | 33 (67) | 0.24 |
| Diabetes mellitus | 7 (21) | 13 (26) | 0.58 |
| Hypercholesterolemia | 16 (48) | 30 (49) | 0.25 |
| NYHA 1 | 22 | 32 | 0.86 |
| NYHA 2 | 11 | 17 | 0.82 |
| NYHA 3 | 0 | 0 | – |
| NYHA 4 | 0 | 0 | – |
| Typical angina | 11 (33) | 32 (65) | 0.005 |
| Angina <24 h before the test | 4 (12) | 10 (20) | 0.33 |
| Blood pressure (mmHg) | |||
| Systolic | 144±21 | 139±16 | 0.25 |
| Diastolic | 81±11 | 81±9 | >0.99 |
| Heart rate | 67±13 | 66±11 | 0.71 |
NYHA, New York Heart Association functional Class; CAD, coronary artery disease; nsCAD, nonsignificant CAD.
Angiographic findings, echocardiographic data, and SE results
Forty-nine patients (60% of the total cohort) had ≥1 coronary artery with ≥50% stenosis (CAD group). Among them, 16 patients (32%) had triple-vessel disease, 12 (24%) had double-vessel disease, and 21 (43%) had single-vessel disease. Thirty-three patients (40%) had no or <50% coronary artery stenosis (nsCAD group). Forty-three patients (52%) had ≥1 coronary artery with >70% stenosis; among them, four patients had triple-vessel disease, 11 had double-vessel disease, and 28 patients had single-vessel disease.
Rest echocardiographic and SE data are presented in Table 2. Patients in the CAD group had significantly reduced rest GLS (−19±2.4 vs −22.7±2.4, P<0.001), but not ESL, LVEF, or end-diastolic volume (EDV) compared with patients in the nsCAD group. Figure 3 shows the scatter plot of GLS classified by number of diseased vessels (coronary stenosis ≥50%). As expected both SE parameters, reversible WM abnormalities and CFR–LAD (considered either as a continuous variable or using the usual <2 cutoff), were significantly different between patients with or without obstructive CAD (P<0.001 for all comparisons).
Table 2.
Angiographic results and echocardiography variables
| Variables | nsCAD (n=33) | CAD ≥50% (n=49) | P value |
|---|---|---|---|
| Coronary angiography ≥50% | |||
| Single-vessel disease | 0 | 16 (32) | |
| Double-vessel disease | 0 | 12 (24) | |
| Triple-vessel disease | 0 | 21 (43) | |
| Rest echocardiography | |||
| LVEF | 60.6±3 | 61.2±3 | 0.37 |
| EDV | 97±22 | 99±18 | 0.67 |
| GLS (%) | −22.73±2.40 | −19.02±2.45 | <0.001 |
| ESL (ms) | 12.01±16.07 | 18.29±18.23 | 0.10 |
| Stress echocardiography | |||
| Reversible WM abnormalities | 2 (6) | 33 (67) | <0.001 |
| CFR–LAD | 2.17±0.25 | 1.79±0.4 | <0.001 |
| CFR–LAD <2 | 8 (24) | 35 (71) | <0.001 |
CAD, coronary artery disease; nsCAD, nonsignificant CAD; LVEF, left ventricle ejection fraction; EDV, end-diastolic volume; GLS, global longitudinal strain; ESL, early systolic lengthening; CFR–LAD, coronary flow reserve on the left anterior descending coronary artery.
Figure 3.
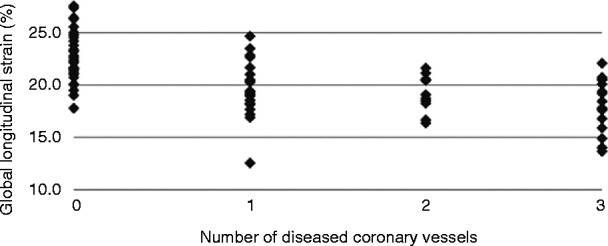
The scatter plot of global longitudinal strain (GLS) by number of diseased vessels (stenosis >50%).
ROC analysis and SE diagnostic data
Figure 4 shows the results of the ROC curve analysis regarding CFR–LAD, rest GLS, and ESL for the detection of significant CAD (≥50%): GLS demonstrated AUC=0.861 with an optimal cutoff value <−20.7%; CFR–LAD demonstrated AUC=0.827 with an optimal cutoff value of <1.8; and ESL demonstrated AUC=0.601 with an optimal cutoff value of >12.7 ms.
Figure 4.
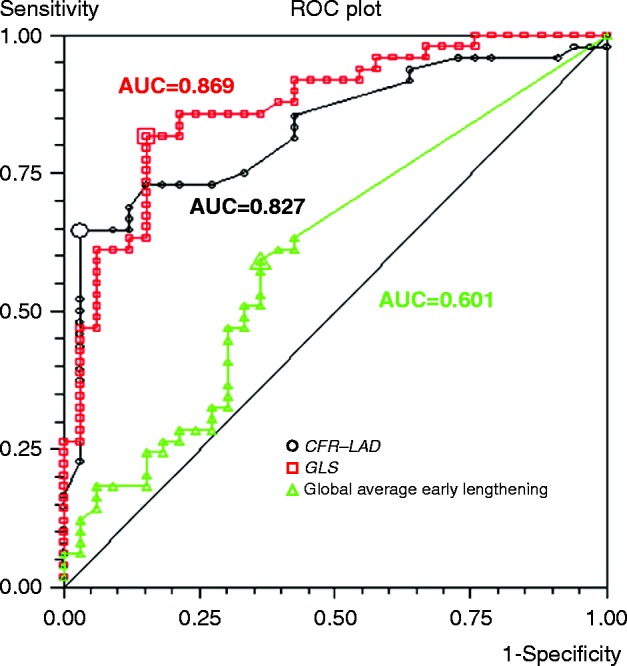
Receiver-operating curves for global longitudinal strain (GLS) and coronary flow reserve on the left anterior descending coronary artery (CFR–LAD) were built and best cutoff and area under the curve calculated.
Table 3 gives diagnostic results (sensitivity, specificity, and Youden index) for categorical SE parameters (WM, WM combined with CFR–LAD <2) and rest strain parameters (GLS and ESL) categorized based on their best cutoff value from ROC analyses. GLS was the parameter with the highest Youden index (0.66), indicating highest diagnostic accuracy. Interestingly, the Youden index for GLS did not increase when alternatively defining CAD as the presence of >70% stenosis (0.61). Table 4 and Fig. 5 illustrate the distribution of tested rest and stress parameters across the nsCAD and the three CAD subgroups based on the increasing number of vessels with ≥50% stenosis.
Table 3.
Diagnostic performance of selected rest and stress-echocardiography variables
| Sensitivity (95% CI) | Specificity (95% CI) | Youden index | |
|---|---|---|---|
| Wall-motion reversible abnormalities | 66% (52.46–80.05) | 93.94% (79.77–99.26) | 0.599 |
| WM reversible abnormalities or CFR–LAD <2 | 89.8% (77.77–96.6) | 69.7% (51.29–84.41) | 0.595 |
| Rest global longitudinal strain <−20.72% | 81.63% (67.97–91.24) | 84.85% (68.1–94.89) | 0.665 |
| Average early systolic lengthening >12.66 ms | 59.18% (44.21–73) | 63.64% (45.12–79.59) | 0.228 |
Table shows sensitivity, specificity, and Youden index to diagnose at least one coronary artery stenosis ≥50% for stress-echo parameters (wall-motion abnormalities, wall motion combined with CFR–LAD <2) and for rest strain parameters (GLS and ESL) considered as categorical variables. In this case <2 was used as cutoff for CFR–LAD, as indicated by previous literature, while the best cutoff found in current study (−20.72%) was used for GLS and ESL (>12.66 ms).
Table 4.
Data across groups with increasing coronary artery disease severity
| Variables | nsCAD (n=33) | Single-vessel (n=21) | Double-vessel (n=12) | Triple-vessel (n=16) |
|---|---|---|---|---|
| LVEF | 60.6±3.1 | 60.8±4.5 | 62.9±3.8 | 60.3±2.6 |
| Rest GLS <−20.72% | 15.1% | 71.4% | 83.3% | 87.5% |
| Rest GLS | −22.73±2.89 | −19.66±2.66 | −19.20±1.67 | −18.08±2.5 |
| Average ESL >12.66 ms | 36.3% | 38% | 66.6% | 75% |
| Average ESL | 12.01±16.17 | 12.07±14.05 | 20.76±20.28 | 24.60±19.5 |
| Stress echocardiography | ||||
| WM reversible abnormalities | 6% | 57.1% | 58.3% | 87.5% |
| CFR–LAD <2 | 24.2% | 61.9% | 75% | 81.25% |
| CFR–LAD | 2.17±0.25 | 1.86±0.53 | 1.73±0.87 | 1.74±0.21 |
LVEF, left ventricular ejection fraction; GLS, global longitudinal strain; ESL, early systolic lengthening; WM, wall motion; CFR–LAD, coronary flow reserve on the left anterior descending coronary artery; nsCAD, nonsignificant CAD.
Figure 5.
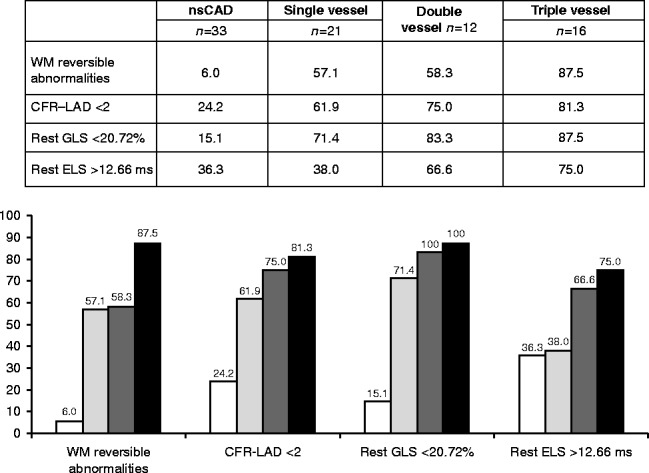
All rest strain and stress-echo variables show a clear trend from patients with no significant coronary artery disease through single-, double-, and triple-vessel CAD patients, but WM and GLS are the parameters most often normal in patients with no CAD (high specificity). CAD, coronary artery disease; nsCAD, non-significant coronary artery disease; WM, wall motion; GLS, global longitudinal strain; ESL, early systolic lengthening.
Univariate and multivariate predictors of obstructive CAD
The possible predictors of CAD among clinical variables, rest, and SE parameters that were significant at univariate logistic regression and multivariate results are given in Table 5.
Table 5.
Univariate and multivariate predictors of CAD (≥50% stenosis in at least one coronary artery)
| Parameters | Univariate | Multivariate | ||||
|---|---|---|---|---|---|---|
| OR | 95% CI | P value | OR | 95% CI | P value | |
| Gender (male vs female) | 3.17 | 1.26–7.95 | 0.013 | 3.08 | 0.64–14.82 | 0.15 |
| Typical angina | 4.74 | 1.83–12.30 | 0.001 | 1.2 | 0.24–6.1 | 0.81 |
| Stress wall-motion abnormalities | 31.96 | 6.78–150.55 | <0.0001 | 27.3 | 3.64–205.9 | 0.001 |
| CFR–LAD <2 | 7.81 | 2.84–21.42 | <0.0001 | 3.8 | 0.81–18.59 | 0.089 |
| Rest longitudinal global strain <−20.72% | 21.84 | 6.72–70.94 | <0.0001 | 16.21 | 3.13–83.94 | 0.001 |
| Average early lengthening >12.66 | 2.53 | 1.02–6.30 | 0.0448 | 1.23 | 0.25–6.07 | 0.80 |
CFR–LAD, coronary flow reserve on the left anterior descending coronary artery; OR, odds ratio.
In the multivariate analysis, reversible WM abnormalities at SE and rest GLS were the only two parameters which remained strong and independent predictors of significant CAD (both P<0.01), with odds ratios of 27.3 (95% CI 3.64–205.9) and 16.2 (95% CI 3.13–83.94) respectively, which suggests the potential diagnostic usefulness of their combination.
Logistic regression multivariate models for obstructive CAD prediction
The addition of both rest GLS data and SE WM results significantly increased the global χ 2 value of the models (χ 2 18.7 vs 40.5 or 44.8 respectively, P<0.001), when added to known clinical data and rest LVEF.
Regional strain data
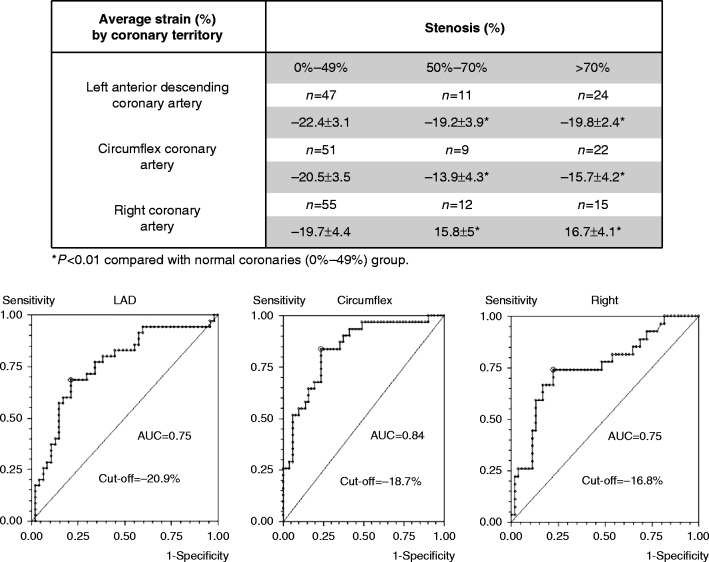
Figure 6 shows strain data broken into the three coronary territories, both in patients with non-obstructive coronaries (or <50% stenosis), intermediate stenosis (50–70%) as their most severe stenosis, and at least one severe (>70%) stenosis. Regional strain is significantly reduced in patients with either intermediate or severe stenoses, compared with patients with nonobstructive coronaries (P<0.01) for each considered coronary territory, as expected. Strain in the LAD territory is significantly higher than strain in the other two territories, both in the presence of coronary stenosis and nonobstructive coronaries. Consequently, ROC curves denote a different diagnostic best cutoff (lower part of Fig. 6), depending on the specific territory considered, with a higher cutoff for LAD territory (−20.9%) compared with circumflex (−18.7%) and right coronary artery (RCA) (−16.8%) territories.
Figure 6.
Average strain % by coronary territory classified based on normal or <50% stenosis, intermediate (50–70%) or severe (>70%) coronary artery stenosis in the matching coronary. Receiver-operating curves with respective area under the curve and best cutoff value for strain when assessing each coronary territory, as separate entities.
Feasibility and reliability
In the 82 patients enrolled, myocardial strain could be assessed in 89% of LV myocardial segments; 11% of segments were excluded because of poor image quality or insufficient endocardium tracking.
Reliability analyses of GLS revealed Cronbach's α values of 0.933 for intraobserver variability and 0.916 for interobserver variability, while for average duration of ESL, Cronbach's α values were 0.899 for intraobserver variability and 0.885 for interobserver variability.
Discussion
In the highly select population of patients without rest WMA, where GLS estimation was feasible, both reversible WMA and resting GLS were shown to be independent predictors of CAD. Thus, the clinical value of performing resting GLS for the prediction of CAD remains uncertain. The results of our diagnostic study demonstrate for the first time that rest strain analysis, specifically GLS using vendor-independent software, has similar accuracy, compared with stress-echo WM analysis for the prediction of whether a patient is affected or not by angiographically obstructive CAD. Both rest GLS and stress WM demonstrated an incremental value over clinical and LVEF data. Although rest GLS in this study has shown similar diagnostic accuracy compared with SE to predict which patients had angiographic CAD, the clinical usefulness of the information gained using the two techniques is different. Unlike rest GLS imaging, SE is able to demonstrate regional reversible ischemia, which is important for clinical decision-making and appropriate treatment. Further studies are needed to determine the clinical role of reduced rest GLS, despite its significant diagnostic accuracy to detect patients affected by obstructive CAD.
Furthermore, the findings of this study need validation by prospective testing of the retrospectively calculated GLS cutoff point for the detection of CAD. Optimal diagnostic performance and cutoff varied in our study depending on the coronary territory separately examined with regional strain, but the LAD territory demonstrated higher average values in both patients with normal coronaries and in patients with obstructive CAD.
The optimal GLS diagnostic cutoff varies significantly among previous studies using different equipment, different design, and vendor-dependent 2D-STE software (3, 4, 5, 6). This study used vendor-independent software, but normal values for GLS with this analysis system are also not established. At least three previous studies assessed rest GLS to predict obstructive CAD following invasive angiography; regarding the best diagnostic cutoff to be used, two of them (3, 4) found discordant results (lower optimal cutoff close to 17%) compared with the current study (−20.7%) and the study reported by Choi et al. (6), which showed similar GLS values to the ones collected in our study (data given in Table 4) through different CAD categories, with normal coronaries patients showing a mean GLS of −22±1.5%, single or double-vessel disease −19.4±2.4%, and triple-vessel or left main disease −18±2.3%. Recent data have indicated that GLS is more dependent on the 2D-STE software used, rather than ultrasound equipment used to acquire images (8, 9, 10), which makes the use of vendor-independent software particularly attractive to standardize GLS for widespread use. The possibility of using a fixed diagnostic GLS cutoff value to diagnose obstructive CAD, independent of the ultrasound equipment used for images acquisition, would be required to increase the clinical usefulness of strain imaging.
GLS may also depend on the clinical characteristics of patients and their hemodynamic parameters (i.e., blood pressure) during image acquisition (11). One of the previous studies, which found a GLS of −17.4% as the optimal diagnostic cutoff, included a high proportion of New York Heart Association (NYHA) functional class three patients, which theoretically may show lower GLS compared with healthier NYHA class one and two patients than those enrolled in our study, at least partly explaining the different GLS values found in their study and both this study and the study reported by Choi et al. (6).
Reversible WM abnormalities during SE had very high specificity in our study. Combining CFR–LAD with WM partly compensated for the suboptimal sensitivity of standalone WM analysis, as already reported (7, 12). Patients with typical angina (n=43) showed significantly lower GLS compared with the other 39 patients whose referring symptom was atypical chest pain (−18.5±2.7% vs −20.7±2.9%, P<0.001). Furthermore, patients with chest pain within 24 h of their SE (n=14) had a nonsignificant trend toward lower GLS (−18.8±3% vs −19.6±3.3%); this apparent relationship of GLS with typical and recent anginal symptoms lends support to the theory that GLS is reduced in CAD patients because of ischemic stunning. Therefore, our study clearly indicates that GLS is a useful measure to confirm or deny the suspicion of obstructive CAD in patients with typical chest pain.
To the best of our knowledge, no previous study has specifically compared the incremental value of rest GLS to modern SE which includes CFR–LAD, in particular during dipyridamole stress, but rest GLS has recently been demonstrated as useful in addition to exercise ECG (13).
The apparently striking, enthusiastic data regarding the diagnostic accuracy of rest GLS are partly mitigated by the less-than-ideal feasibility of this GLS measure. In fact, GLS measurement in our study could be performed with visually acceptable tracking in ≥14 of 16 LV segments (as required by the protocol) in only 60% of eligible patients: this makes GLS clinically useful mostly in patients who have high-quality apical images and 2D-STE endocardial tracking.
Study limitations
Patient enrollment criteria were very strict in this study, due to the need to enroll only patients with normal wall motion at baseline echocardiogram, sufficient acoustic windows to retrospectively apply speckle tracking imaging, and the availability of a coronary angiogram; consequently, the study is partly limited by the small sample size and potential selection bias. The frame rate of images which were analyzed offline may have been suboptimal for the specific purpose of time-interval measurements, although the study's average value of 42 frames/s is considered reliable for amplitude measures (9, 10). This might have had an impact on the diagnostic accuracy of time-dependent ELS, which in our study was suboptimal and much inferior compared with the accuracy of GLS, in contrast to a previous study conducted using a higher frame rate at acquisition and vendor-specific software (3). 2D-STE was finally feasible in only 82 patients out of the 202 eligible subjects who underwent coronary angiography, demonstrating that this technique has low feasibility in a clinical setting of unselected patients. Owing to the retrospective nature of the study, image quality was also more representative of clinical routine, rather than of a strain-focused study, in which only patients with top-quality images are typically included. This may represent more of a strength than a limitation of GLS assessment, representing what can be achieved using nondedicated imaging in a real-world setting.
Conclusions
Rest GLS demonstrated high accuracy in the detection of obstructive CAD, not different from, and possibly superior to, the visual assessment of regional WM during SE. At the very least, rest GLS is synergistic with stress WM assessment, leading to the highest accuracy of detecting whether a patient is affected by obstructive CAD or not.
Declaration of interest
The authors declare that there is no conflict of interest that could be perceived as prejudicing the impartiality of the research reported.
Funding
This research did not receive any specific grant from any funding agency in the public, commercial or not-for-profit sector.
References
- 1. Patel MR Peterson ED Dai D Brennan JM Redberg RF Anderson HV Brindis RG Douglas PS Low diagnostic yield of elective coronary angiography New England Journal of Medicine 362 2010. 886–895. 10.1056/NEJMoa0907272 [DOI] [PMC free article] [PubMed] [Google Scholar]
- 2. Hoit BD Strain and strain rate echocardiography and coronary artery disease Circulation. Cardiovascular Imaging 4 2011. 179–190. 10.1161/CIRCIMAGING.110.959817 [DOI] [PubMed] [Google Scholar]
- 3. Smedsrud MK Sarvari S Haugaa KH Gjesdal O Ørn S Aaberge L Smiseth OA Edvardsen T Duration of myocardial early systolic lengthening predicts the presence of significant coronary artery disease Journal of the American College of Cardiology 60 2012. 1086–1093. 10.1016/j.jacc.2012.06.022 [DOI] [PubMed] [Google Scholar]
- 4. Montgomery DE Puthumana JJ Fox JM Ogunyankin KO Global longitudinal strain aids the detection of non-obstructive coronary artery disease in the resting echocardiogram European Heart Journal Cardiovascular Imaging 13 2012. 579–587. 10.1093/ejechocard/jer282 [DOI] [PubMed] [Google Scholar]
- 5. Nucifora G Schuijf JD Delgado V Bertini M Scholte AJ Ng AC van Werkhoven JM Jukema JW Holman ER van der Wall EE et al. Incremental value of subclinical left ventricular systolic dysfunction for the identification of patients with obstructive coronary artery disease American Heart Journal 159 2010. 148–157. 10.1016/j.ahj.2009.10.030 [DOI] [PubMed] [Google Scholar]
- 6. Choi JO Cho SW Song YB Cho SJ Song BG Lee SC Park SW Longitudinal 2D strain at rest predicts the presence of left main and three vessel coronary artery disease in patients without regional wall motion abnormality European Journal of Echocardiography 10 2009. 695–701. 10.1093/ejechocard/jep041 [DOI] [PubMed] [Google Scholar]
- 7. Gaibazzi N Rigo F Reverberi C Detection of coronary artery disease by combined assessment of wall motion, myocardial perfusion and coronary flow reserve: a multiparametric contrast stress-echocardiography study Journal of the American Society of Echocardiography 23 2010. 1242–1250. 10.1016/j.echo.2010.09.003 [DOI] [PubMed] [Google Scholar]
- 8. Risum N Ali S Olsen NT Jons C Khouri MG Lauridsen TK Samad Z Velazquez EJ Sogaard P Kisslo J Variability of global left ventricular deformation analysis using vendor dependent and independent two-dimensional speckle-tracking software in adults Journal of the American Society of Echocardiography 25 2012. 1195–1203. 10.1016/j.echo.2012.08.007 [DOI] [PubMed] [Google Scholar]
- 9. Sun JP Lee AP Wu C Lam YY Hung MJ Chen L Hu Z Fang F Yang XS Merlino JD et al. Quantification of left ventricular regional myocardial function using two-dimensional speckle tracking echocardiography in healthy volunteers – a multi-center study International Journal of Cardiology 167 2012. 495–501. 10.1016/j.ijcard.2012.01.071 [DOI] [PubMed] [Google Scholar]
- 10. Negishi K Lucas S Negishi T Hamilton J Marwick TH What is the primary source of discordance in strain measurement between vendors: imaging or analysis? Ultrasound in Medicine & Biology 39 2013. 714–720. 10.1016/j.ultrasmedbio.2012.11.021 [DOI] [PubMed] [Google Scholar]
- 11. Burns AT La Gerche A D'hooge J MacIsaac AI Prior DL Left ventricular strain and strain rate: characterization of the effect of load in human subjects European Journal of Echocardiography 11 2010. 283–289. 10.1093/ejechocard/jep214 [DOI] [PubMed] [Google Scholar]
- 12. Cortigiani L Rigo F Galderisi M Gherardi S Bovenzi F Picano E Sicari R Diagnostic and prognostic value of Doppler echocardiographic coronary flow reserve in the left anterior descending artery in hypertensive and normotensive patients [corrected] Heart 97 2011. 1758–1765. 10.1136/heartjnl-2011-300178 [DOI] [PubMed] [Google Scholar]
- 13. Biering-Sørensen T Hoffmann S Mogelvang R Zeeberg Iversen A Galatius S Fritz-Hansen T Bech J Jensen JS Myocardial strain analysis by 2-dimensional speckle tracking echocardiography improves diagnostics of coronary artery stenosis in stable angina pectoris Circulation. Cardiovascular Imaging 7 2014. 58–65. 10.1161/CIRCIMAGING.113.000989 [DOI] [PubMed] [Google Scholar]


 This work is licensed under a