Abstract
The aim of the study is to establish the impact of 2D echocardiographic methods on absolute values for aortic root dimensions and to describe any allometric relationship to body size. We adopted a nationwide cross-sectional prospective multicentre design using images obtained from studies utilising control groups or where specific normality was being assessed. A total of 248 participants were enrolled with no history of cardiovascular disease, diabetes, hypertension or abnormal findings on echocardiography. Aortic root dimensions were measured at the annulus, the sinus of Valsalva, the sinotubular junction, the proximal ascending aorta and the aortic arch using the inner edge and leading edge methods in both diastole and systole by 2D echocardiography. All dimensions were scaled allometrically to body surface area (BSA), height and pulmonary artery diameter. For all parameters with the exception of the aortic annulus, dimensions were significantly larger in systole (P<0.05). All aortic root and arch measurements were significantly larger when measured using the leading edge method compared with the inner edge method (P<0.05). Allometric scaling provided a b exponent of BSA0.6 in order to achieve size independence. Similarly, ratio scaling to height in subjects under the age of 40 years also produced size independence. In conclusion, the largest aortic dimensions occur in systole while using the leading edge method. Reproducibility of measurement, however, is better when assessing aortic dimensions in diastole. There is an allometric relationship to BSA and, therefore, allometric scaling in the order of BSA0.6 provides a size-independent index that is not influenced by the age or gender.
Keywords: 2D echocardiography, aortic root, allometric scaling
Introduction
Aortic dilatation is a common manifestation in a range of conditions such as hypertension, aortic valve disease and connective tissue disease that carries an adverse prognosis and often requires serial monitoring over long periods of time. While multi-planar tomographic imaging with either computed tomography (CT) or magnetic resonance imaging (MRI) is the gold standard to confirm dilatation and for monitoring of progression (1), both these techniques are expensive and not always readily available. Conversely, echocardiography is often the first investigation to diagnose aortic dilatation and may be used to monitor progression due to its availability and low cost (2).
Until recently, our understanding of the normal ranges of aortic dimensions and specific echocardiographic methodology was based upon a single study (3) that was also the only evidence used in the current 2005 American Society of Echocardiography guidelines on Chamber Quantification (4). Utilisation of these data, now over 20 years old, is problematic as a result of improvements in technology that have led to the widespread use of 2D rather than M-mode to perform linear measurements and a change in recommendation from measuring leading edge to leading edge to measuring the tissue–blood interface. Moreover, there are differences in the timing of measurements within the aortic root between multi-planar tomographic imaging in which the largest measures are recorded irrespective of gating (presumed often to be systolic) and 2D echocardiography when end-diastolic measures are often taken. Some studies (5, 6, 7) have attempted to redefine the normal range and this is encouraging. However, there is still a lack of clarity pertaining to the technical minutia of the measurements with little attention of when these measurements should be acquired in the cardiac cycle or whether to use leading edge to leading edge/inner edge to inner edge methods.
It is well established that aortic dimensions are influenced by body size and the echocardiographic community are encouraged to index absolute dimensions to body surface area (BSA) in a ratiometric manner (indexed value = raw data/BSA) (4). It has been documented that this method of scaling is flawed in that very few biological relationships occur in a linear fashion (8) and, therefore, a non-linear (allometric) approach (indexed value = raw data/(BSAexp)) of scaling is often recommended (9). The relationship of the aortic root/arch dimensions to the height of the patient had previously been demonstrated (6); however, the specific allometric relationship has not yet been explored. Therefore, further assessment may support a size-independent alternative to traditional ratiometric scaling to BSA. Finally, there is some evidence to suggest that the pulmonary artery diameter may act as a reference for aortic dilatation (10) and, therefore, the ratio of aortic to pulmonary artery may aid individual interpretation.
In view of this, the following study aims to establish the impact on echocardiographically derived aortic root dimensions of i) the timing of the measurement with reference to the cardiac cycle, ii) different methods of measurements including the leading edge and the internal edge methods and iii) the influence of the body size and relationship to pulmonary artery diameter with a focus on allometric scaling.
Methods
Sample population
Participants were enrolled into a number of studies as either a control group or specifically to assess cardiac normality. Ethics approval was obtained from Liverpool John Moores University, St Georges University Hospital, Queen Elizabeth Hospital, Birmingham and the Royal United Hospital, Bath, to allow these data to be used for the purposes of this study and all participants provided informed consent. All participants were in sinus rhythm and self-reported as free of cardiovascular disease, diabetes, renal disease, liver disease or other pathologies and were not taking any prescribed medication. Furthermore, participants were excluded if there was any evidence of abnormality identified on the resting echocardiogram. Height and weight were recorded at the time of the examination using a standard calibrated equipment and BSA was calculated in accordance with the method of Dubois & Dubois (11); BSA (m2) =0.007184×Height0.725×Weight0.425. Heart rate was recorded from the electrocardiogram (ECG) inherent to the ultrasound system.
Echocardiographic assessment
All echocardiograms were acquired by experienced sonographers using commercially available ultrasound systems (Vivid Q/Vivid 7 and Vivid E9 (GE Medical, Horton, Norway), CX30, IE33 and IE22, Philips Medical, Andover, The Netherlands) with multi-frequency-phased array transducers (1.7–4 MHz with harmonic imaging), and all examinations were carried out in accordance with the ASE guidelines (4). All images were optimised using depth, focal zones and gain to maximise delineation of the blood pool/aortic intima border. A minimum of three cardiac cycles were acquired and stored to a local server for offline analysis using a commercially available software program (EchoPac, GE Medical and QLab, Philips Medical).
The aortic root was assessed at four levels: the aortic annulus (ANN) defined as the level of the hinge point of the aortic cusps; the sinus of Valsalva (SoV) at the level of the coronary ostia; the sinotubular junction (STJ) defined as the level where the sinus bulge terminates and the proximal ascending aorta (AsA) defined as 1 cm distal to the STJ. The aortic arch (ARCH) was measured using a suprasternal notch orientation at the level just proximal to the left subclavian artery while the pulmonary artery was assessed 1 cm distal to the pulmonary valve utilising a parasternal short axis orientation.
Each measurement was made at end-diastole (as defined as the onset of the QRS complex on the ECG) and mid-systole (as defined as ‘mid-S to terminal T-wave’ on the ECG). Each measurement at each point in the cardiac cycle was subsequently performed using the leading edge method (defined as the anterior echo of the aortic wall to the anterior echo on the posterior intima) and the inner edge method (defined as blood pool/intima border of the anterior aortic wall to the same border on the posterior aortic wall), and the same methods were used for the assessment of the pulmonary artery. Therefore, each anatomical level provided four separate measurements with the exception of the ANN, which due to the nature of the measurement, i.e. hinge point location, the leading edge method, was not employed and consequently only two measurements were made (see Figs 1 and 2).
Figure 1.
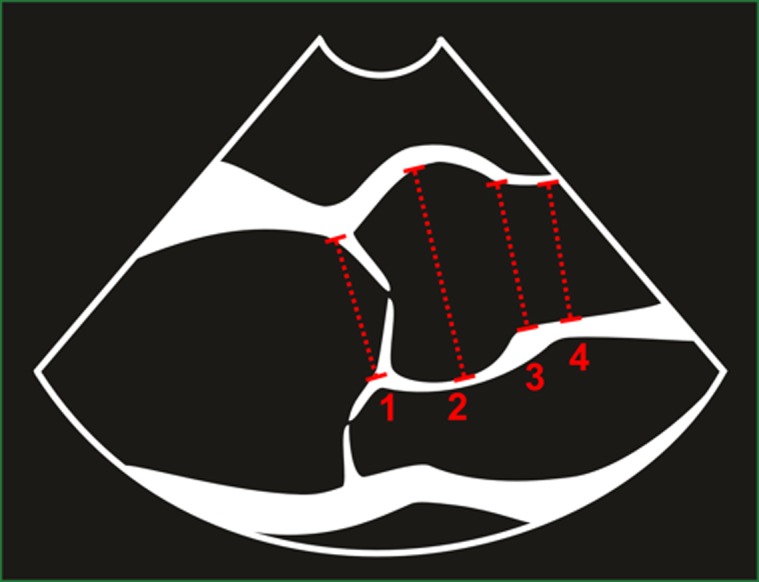
Aortic root dimensions measured using the inner edge method; 1) aortic annulus, 2) sinus of Valsalva, 3) sinotubular junction and 4) proximal ascending aorta.
Figure 2.
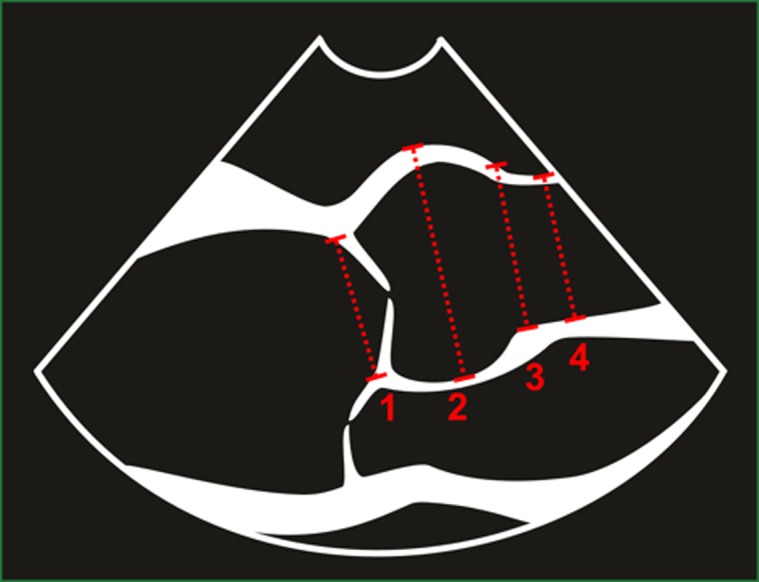
Aortic arch dimension measured using the leading edge method; 1) aortic annulus, 2) sinus of Valsalva, 3) sinotubular junction and 4) proximal ascending aorta.
Standard echocardiographic parameters of the left atrium (LA) and left ventricle (LV) were also acquired to ensure normality and included interventricular septal thickness (IVS), LV diastolic diameter (LVDd), LV systolic diameter (LVDs), LV posterior wall thickness (LVPW), LV end-diastolic volume (LVEDV), LV end-systolic volume (LVESV), derived ejection fraction (EF), LA diameter (LAd) and LA volume (LAvol). All measurements were made in accordance with the ASE recommendations while volume derivations were made using Simpson's biplane methodology (4). All patients studied had a trileaflet aortic valve and no evidence of valvular heart disease.
Data analysis and statistics
Firstly, to determine if there was any systematic bias between systolic and diastolic measurements and the inner edge and leading edge methods, a paired Student's t-test was used with the statistical significance set at P<0.05. Secondly, Bland–Altman analysis was performed to establish bias and limits of agreement between both methods and timings.
All aortic root and arch dimensions from all methods were initially assessed to establish any relationship to BSA, height and PA diameter using a simple Pearson correlation. In cases where a significant correlation has been identified, we examined whether this scaling approach had removed the influence of the body size as described previously (8) and determined whether allometric scaling was appropriate (12). In cases where ratio scaling had failed to remove the influence of the body size, the allometric relationship was assessed using a non-linear model y=a . x b (13). Size exponents (b) together with their 95% CIs were calculated. We define the smallest worthwhile effect for the allometric relationships as a correlation coefficient of r=0.30, a moderate effect size in Cohen's terms (14). To assess the impact of age on the aortic root size, independent of the body size, a covariate analysis was performed using the model y=a:x b . exp (c.age). The subsequent b exponent was compared with that obtained using the general model y=a . x b, and the c-value was assessed. In order to establish the impact of gender, the analysis was repeated separately for both males and females.
Inter-observer variability was assessed with four blinded observers repeating all measurements on a subset of ten participants and reliability was expressed as an intra-class correlation coefficient (ICC). All statistical analyses were performed using a specialised software program (SPSS, Ver 20, SPSS, Inc.).
Results
A total of 248 participants (age 29±14 years (range 17–72 years)) were included in this study. All participants were in normal sinus rhythm and baseline demographics are presented in Table 1.
Table 1.
Baseline demographics and standard cardiac chamber dimensions
| Parameters | Overall (n=248) (mean±s.d.) | Males (n=157) (mean±s.d.) | Females (n=91) (mean±s.d.) | P |
|---|---|---|---|---|
| Age (years) | 29±14 | 27±13 | 32±16 | 0.004 |
| BSA (m2) | 1.83±0.19 | 1.89±0.20 | 1.71±0.13 | <0.001 |
| Heart rate (bpm) | 67±11 | 65 ±11 | 68±11 | 0.045 |
| IVSd (mm) | 9.0±1.5 | 9.0±1.4 | 8.0±1.3 | <0.001 |
| LVd (mm) | 48±4 | 49±3 | 45±3 | <0.001 |
| PWd (mm) | 9.0±2.0 | 9.0±1.2 | 8.0±2.8 | <0.001 |
| LVs (mm) | 30±4 | 31±4 | 28±3 | <0.001 |
| LVEDV (ml) | 104±23 | 113±33 | 91±18 | <0.001 |
| LVESV (ml) | 39±11 | 44±10 | 33±9.4 | <0.001 |
| LVEDV (ml/m2) | 56±11 | 59±11 | 53±9 | <0.001 |
| LVESV (ml/m2) | 21±6 | 23±5 | 19±5 | 0.007 |
| LV EF (%) | 63±6 | 62±5 | 64±6 | <0.001 |
| LAd (mm) | 34±4 | 35±5 | 32±4 | <0.001 |
| LA volume (ml) | 44±13 | 48±14 | 39±9 | <0.001 |
| LA volume (ml/m2) | 24±6 | 25±6 | 23±5 | <0.001 |
Impact of timing and methods
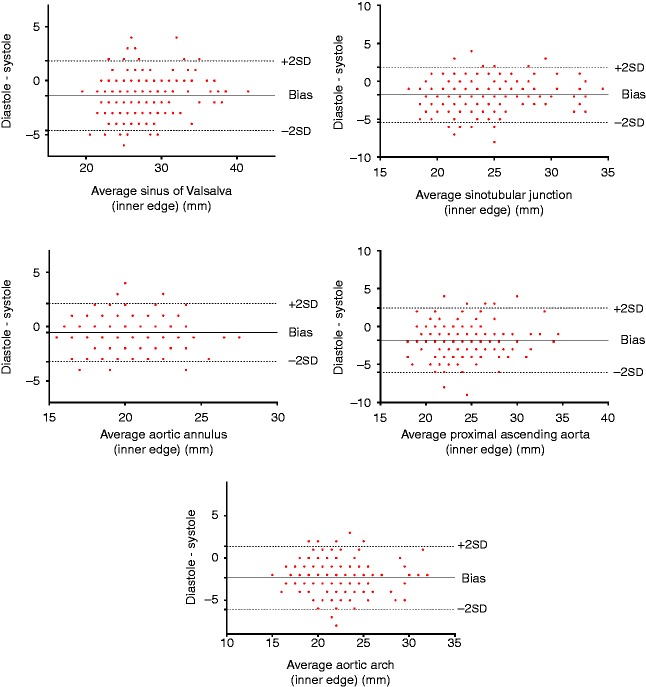
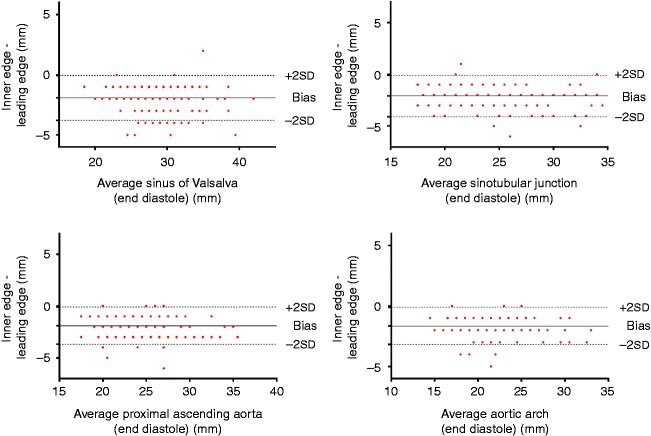
For all parameters with the exception of the ANN, there was a negative bias with dimensions being significantly larger in systole (P<0.05) (ANN=−0.6 mm, SoV=−1.4 mm, STJ=−1.8 mm, AsA=−1.8 mm and ARCH=−2.3 mm) (see Fig. 3). All aortic root and arch measurements were significantly larger when using the leading edge method compared with the inner edge method (P<0.05) and similarly demonstrated a negative bias (SoV=−1.9 mm, STJ=−2.1 mm, AsA=−1.9 mm, ARCH=−1.6 mm) (see Fig. 4). Inter-observer variability as demonstrated with ICCs ranged from 0.84 to 0.97 with the best reliability obtained from the inner edge method in diastole with the exception of the ARCH that demonstrated the least variability from inner edge method measurements in systole.
Figure 3.
Bland–Altman plots demonstrating a negative bias indicating systematically higher values for measurements made in end-systole when using the inner edge method.
Figure 4.
Bland–Altman plots demonstrating a negative bias indicating systematically higher values for leading edge measurements when using end-diastole.
Scaling
When all dimensions were scaled ratiometrically to BSA, the subsequent index was not size independent. The subsequent allometric scaling provided size-independent indices with the specific exponents presented in Table 2. The b exponent consistently ranged between 0.5 and 0.7 and there was very little variability between systole/diastole and methods of measurement. For practical purposes, a value of 0.6 for all indices provided a size-independent index.
Table 2.
b exponents for body surface area and pulmonary diameter when used as a scaling parameter (exemplar using the diastolic inner edge methodology)
| Dimensions | Size independence scaled to BSA | b exponent | Size independence scaled to BSA b |
|---|---|---|---|
| Annulus | No | BSA0.52 | Yes |
| Sinus of Valsalva | No | BSA0.68 | Yes |
| Sinotubular junction | No | BSA0.62 | Yes |
| Proximal ascending | No | BSA0.63 | Yes |
| Aortic arch | No | BSA0.57 | Yes |
| Main pulmonary artery | No | BSA0.25 | Yes |
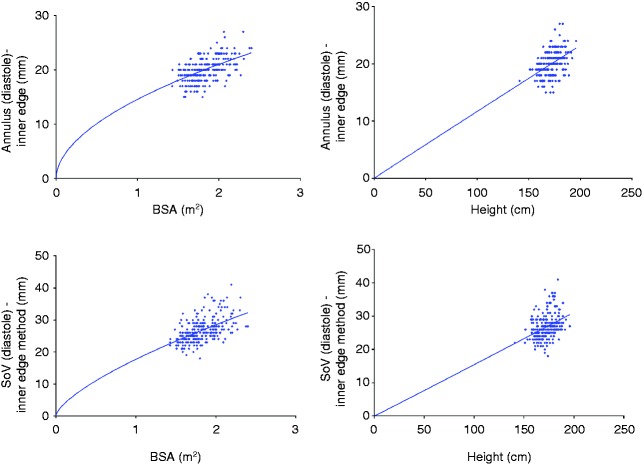
When dimensions were scaled ratiometrically to height, all parameters with the exception of the STJ produced size-independent indices. With regard to the STJ, the b exponent was similar to BSA with a value of 0.62. When age was included within the non-linear model, there was an additional impact (c>0) and, therefore, the relationship becomes less linear with the advancing age. There was not a similar impact for BSA (c=0). When analysed on both genders independently, absolute values for all dimensions were larger in males than in females (P<0.05); however, the allometric relationships remained for both BSA and height as for the population as a whole and the indexed values were not significantly different between the genders. Figure 5 provides an example of the allometric relationships when indexing for BSA and height, respectively, for the whole population.
Figure 5.
Exemplar scatter plots with a non-linear regression line constrained to pass through the origin highlighting a non-linear relationship to BSA and a linear relationship to height.
Correlations between PA and aortic dimensions were modest at best with the r-values ranging from 0.21 to 0.4, which reach statistical significance only with the ARCH dimension (P=0.002), SoV (P=0.008) and ANN (P=0.001). The subsequent allometric scaling provided a b exponent ranging between 0.2 and 0.3 and, for practical purposes, scaling aortic root dimensions to PA0.25 appears to have a limited value (see Fig. 6).
Figure 6.
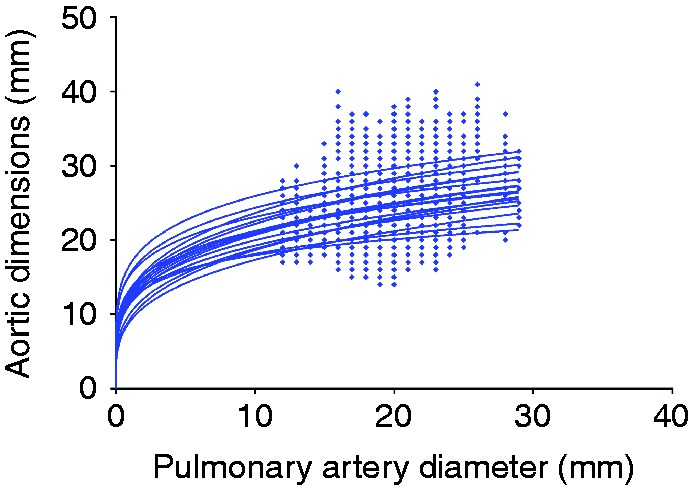
Scatter plots for all aortic dimensions and pulmonary artery diameter demonstrating the non-linear relationship.
Discussion
To the best of our knowledge, this is the first 2D echocardiographic study in an adult population to focus on timing and methods for deriving aortic dimensions while also establishing the allometric relationships to the body size. The main findings from this study are: i) systolic dimensions are significantly larger but with poorer reproducibility than those made in diastole, ii) the leading edge method consistently produces larger dimensions than the inner edge method and again demonstrates poorer reproducibility and iii) allometrically scaling to BSA0.6 across all ages and genders (with the exception of the STJ – in this case height0.6) or ratio scaling to height in the younger population (age <40) provides size-independent indices.
Impact of timing and methods
The timing of aortic dimensions is often a source of debate with the ASE/ACC guidance recommending that all measurements are made at the point when the aortic root is at its maximum diameter (2, 4). It is not specified whether this measurement should be made in diastole or systole. Although guidelines recommend that the maximum diameter is measured, it is interesting that the original work (3) and more recent studies have used end-diastolic measurements (6, 7, 15). Owing to the nature of expansion of the aorta during ventricular systole, it is not surprising that we observed a significantly larger dimension when compared with end-diastole, a difference that is likely to be greater in the young population than in the old population due to altered aortic compliance. Given that serial evaluation is so important in managing patients with aortic dilatation, categorical standardisation is extremely important (16). One advantage of this study is that it reflects the ‘real-world’ practice, where measures were made at different institutions on different equipments. On the other hand, diastolic measurements were more reproducible than systolic measurements and this is likely to be driven by the subjective nature of defining systole. In our study, we standardised this measurement as mid-S to terminal T-wave on the ECG to coincide with peak ejection; however, this also creates an element of subjectivity. In cases where measurements are made at the maximal diameter, the subjective nature is exacerbated and will differ from different locations at the same time point as blood moves through the vessel. It is also important to note that the degree of aortic expansion (and therefore systolic dimension) is dependent on the stroke volume and, therefore, absolute values are, in part, dependent on the overall left ventricular function, which may compound the poorer reproducibility in a serial assessment setting.
The method of measurement has often been one of contention with adult data often being measured by a leading edge technique (3, 6), while the ACC guidelines on thoracic aortic disease recommend an inner edge method (2). Although it has been suggested that, with the development of ultrasound technology, any difference should be negligible (4), this does not appear to be in keeping with our findings. In our study, the leading edge method produced larger dimensions, which is consistent with previous data using CT, which indicated that leading edge methods provide measurements that are ∼2 mm greater than the inner edge value (17). Compared with CT and cMR imaging, echocardiographically derived measurements of the aorta appear to correlate well; however, the absolute values do not consistently agree (18) and both the leading edge and inner edge methods underestimate their cMR/CT equivalent (17, 19). The disparity between methods suggests that these should not be used interchangeably. A recent work has produced normative echocardiographic values for the inner edge method (7); however, this needs to be developed further on a larger heterogeneous population.
Scaling
The association of aortic dimensions with body size has been extensively reported (6) and the ASE and ACC guidelines recommend indexing parameters to BSA. This has often been achieved by a simple linear scaling method that according to our data does not provide a size-independent index. This is not surprising in that BSA is a second-power measurement reflecting body mass (including fat mass) as well as height and is considered biologically a weak scalar (20). Following allometric scaling, a b exponent of BSA0.6 provided a size-independent index and, to the best of our knowledge, this is the first study to provide these data. Other works have assumed BSA0.5 due to the relationship of second power to first power ratio (6) and our findings support this concept. Other studies have also demonstrated similar BSA exponents for other linear dimensions of cardiac chambers with the RV, LA and LV, all requiring an index close to 0.5 (12, 20).
It is well established that the height is associated with the aortic size, but our data suggest that this is true for all aortic dimensions with the exception of the STJ. The relationship is linear and, therefore, ratiometric scaling produces a size-independent index. It is difficult, however, to explain the exceptional relationship to the STJ and, therefore, further work is warranted to investigate this further. The use of height as a scalar for cardiac dimensions had previously been reported and has been shown to be the most reliable method when indexing LV mass (4, 20). This linear relationship to height reduces with the advancing age, which makes the practical use of this scalar problematic in subjects over the age of 40 years. As this phenomenon is not observed with BSA, it would be pertinent to apply BSA0.6 across the age range. It is also important to note that the same BSA b exponent can be applied to both males and females, further supporting the clinical application of this scalar. Previously published normative data are presented as either absolute values or ratio scaled to BSA (4, 6, 7) and, therefore, it is clear that if BSA0.6 has to be adopted, a large population-based study incorporating ethnicity, age, gender and training volume is required.
The use of intrinsic cardiac dimensions as a means of scaling had previously been reported (21) with the ratio of pulmonary artery to ascending aorta being demonstrated as a useful metric in pulmonary hypertension (22). Our data demonstrate a variable and overall weak correlation between main PA dimension and the measures of aortic size across all methods of size determination. Although initial correlations are weak, the subsequent allometric scaling demonstrated a non-linear b exponent of PA0.25 and, therefore, this ratio may provide some potential.
Limitations
The focus of this study is to establish the impact of methodology and scaling on aortic dimensions rather than to provide further normative values and, therefore, we have not presented specific cut-off values. The sample was skewed to a younger population and it is clear from our work that a more substantive population encompassing a range of demographics is required to provide an accurate normal data set.
Recommendations
The findings from this study have raised a number of very important methodological considerations when establishing normal data sets and considering local and national standardisation.
Measurements of the aortic root are larger in systole but are less reproducible than those made at end-diastole. It should be clearly stated when an aortic root measurement has been made in the cardiac cycle.
The inner edge and leading edge methods are comparable in terms of reliability but provide significantly different values. A national and international consensus is required to standardise the methodology.
Scaling all linear aortic dimensions to BSA0.6 is encouraged.
Conclusion
Aortic dimensions vary across the cardiac cycle as well as when measured using the leading edge and inner edge techniques. The largest dimensions occur in systole while using the leading edge method; however, the most reliable dimensions are observed in end-diastole while using the inner edge method. There is an allometric relationship to BSA and, therefore, allometric scaling in the order of BSA0.6 provides a size-independent index that is not influenced by the age or gender.
Acknowledgements
The authors would like to thank Cardiac Risk in the Young for facilitating data collection and analysis.
Declaration of interest
The authors declare that there is no conflict of interest that could be perceived as prejudicing the impartiality of the research reported.
Funding
This research did not receive any specific grant from any funding agency in the public, commercial or not-for-profit sector.
References
- 1. Litmanovich D Bankier AA Cantin L Raptopoulos V Boiselle PM CT and MRI in diseases of the aorta American Journal of Roentgenology 193 2009. 928–940. 10.2214/AJR.08.2166 [DOI] [PubMed] [Google Scholar]
- 2. Hiratzka L Bakris G Beckman J Bersin R Carr V Casey DE Jr Eagle KA Hermann LK Isselbacher EM Kazerooni EA et al. ACF/AHA/AATS/ACR/ASA/SCA/SCAI/SIR/STS/SVM Guidelines for diagnosis and management of patients with thoracic aortic disease: executive summary Journal of the American College of Cardiology 55 2010. 1509–1544. 10.1016/j.jacc.2010.02.010 [DOI] [Google Scholar]
- 3. Roman M Devereux R Fox R O'Loughlin J Two-dimensional aortic root in dimensions in normal children and adults American Journal of Cardiology 64 1989. 507–512. 10.1016/0002-9149(89)90430-X [DOI] [PubMed] [Google Scholar]
- 4. Lang R Bierig M Devereux R Flachskampf F Foster E Pellika P Picard MH Roman MJ Seward J Shanewise JS et al. Recommendations for chamber quantification: a report from the American Society of Echocardiography's Guidelines and Standards Committee and the Chamber Quantification Writing Group, developed in conjunction with the European Association of Echocardiography, a branch of the European Society of Cardiology Journal of the American Society of Echocardiography 18 2005. 1440–1463. 10.1016/j.echo.2005.10.005 [DOI] [PubMed] [Google Scholar]
- 5. Gautier M Detaint D Fermanian C Aegerter P Delorme G Arnoult F Milleron O Raoux F Stheneur C Boileau C et al. Nonograms for aortic root diameters in children using two-dimensional echocardiography American Journal of Cardiology 105 2010. 888–894. 10.1016/j.amjcard.2009.11.040 [DOI] [PubMed] [Google Scholar]
- 6. Devereux R de Simone G Arnett D Best L Boerwinkle E Howard B Kitzman D Lee ET Mosley TH Jr Weder A et al. Normal limits in relation to age, body size and gender of two-dimensional echocardiographic aortic root dimensions in persons >15 years of age American Journal of Cardiology 110 2012. 1189–1194. 10.1016/j.amjcard.2012.05.063 [DOI] [PMC free article] [PubMed] [Google Scholar]
- 7. Mirea O Maffessanti F Gripari P Tamborini G Muratori M Fusini L Claudia C Fiorentini C Plesea IE Pepi M Effects of aging and body size on proximal and ascending aorta and aortic arch: inner edge-to-inner edge reference values in a large adult population by two-dimensional transthoracic echocardiography Journal of the American Society of Echocardiography 26 2013. 419–427. 10.1016/j.echo.2012.12.013 [DOI] [PubMed] [Google Scholar]
- 8. Batterham AM George KP Whyte G Sharma S Mckenna W Scaling cardiac structural data by body dimensions: a review of theory, practice, and problems International Journal of Sports Medicine 20 1999. 495–502. 10.1055/s-1999-8844 [DOI] [PubMed] [Google Scholar]
- 9. Dewey FE Rosenthal D Murphy DJ Jr Froelicher VF Ashley EA Does size matter?: clinical applications of scaling cardiac size and function for body size Circulation 117 2008. 2279–2287. 10.1161/CIRCULATIONAHA.107.736785 [DOI] [PubMed] [Google Scholar]
- 10. Rammos S Apostolopoulou SC Kramer HH Kozlik-Feldmann R Heusch A Laskari CV Anagnostopoulos C Normative angiographic data relating to the aorta and pulmonary trunk in children and adolescents Cardiology in the Young 15 2005. 119–124. 10.1017/S1047951105000272 [DOI] [PubMed] [Google Scholar]
- 11. Dubois D Dubois E A formula to estimate the approximate surface area if height and weight be known Archives of Internal Medicine 17 1916. 863–871. 10.1001/archinte.1916.00080130010002 [DOI] [Google Scholar]
- 12. Oxborough D Sharma S Shave R Whyte G Birch K Artis N Batterham AM George K The right ventricle of the endurance athlete: the relationship between morphology and deformation Journal of the American Society of Echocardiography 25 2012. 263–271. 10.1016/j.echo.2011.11.017 [DOI] [PubMed] [Google Scholar]
- 13. Glass N Discussion of calculation of power function with special reference to respiratory metabolism in fish Journal of the Fisheries Research Board of Canada 26 1969. 2643–2650. [Google Scholar]
- 14.Cohen J 1988 Statistical power analysis for the behavioural sciences. 2nd edn. New Jersey, USA: Lawrence Erlbaum.
- 15. Schaefer B Lewin M Stout K Gill E Prueitt A Byers P Otto CM The bicuspid aortic valve: an integrated phenotype classification of leaflet morphology and aortic root shape Heart 94 2008. 1634–1638. 10.1136/hrt.2007.132092 [DOI] [PubMed] [Google Scholar]
- 16. Son M Chang S Kwak J Lim H Park S Choi J Lee S Park S Kim D Oh J Comparative measurement of aortic root by transthoracic echocardiography in normal Korean population based on two different guidelines. Cardiovascular Ultrasound. 2013;11:28. doi: 10.1186/1476-7120-11-28. [DOI] [PMC free article] [PubMed] [Google Scholar]
- 17. Lin FY Devereux RB Roman MJ Meng J Jow VM Jacobs A Weinsaft JW Shaw LJ Berman DS Gilmore A et al. Assessment of the thoracic aorta by multidetector computed tomography: age- and sex-specific reference values in adults without evident cardiovascular disease Journal of Cardiovascular Computed Tomography 2 2008. 298–308. 10.1016/j.jcct.2008.08.002 [DOI] [PubMed] [Google Scholar]
- 18. Tsang J Lytwyn M Farag A Zeglinski M Wallace K DaSilva M Bohonis S Walker JR Tam JW Strzelczyk J et al. Multimodality imaging of aortic dimensions: a comparison of transthoracic echocardiography with multidetector row computed tomography Echocardiography 29 2012. 735–741. [DOI] [PubMed] [Google Scholar]
- 19. Bannas P Groth M Rybcynski M Sheikhzadeh S von Kodolitsch Y Graessner J Lund G Adam G Habermann CR Assessment of aortic dimensions in patients with marfan syndrome: intraindividual comparison of contrast-enhanced and non-contrast magnetic resonance angiography with echocardiography International Journal of Cardiology 167 2013. 190–196. 10.1016/j.ijcard.2011.12.041 [DOI] [PubMed] [Google Scholar]
- 20. Batterham A George K Modeling the influence of body size and composition on M-mode echocardiographic dimensions American Journal of Physiology 274 1998. 701–708. [DOI] [PubMed] [Google Scholar]
- 21. Batterham A Shave R Oxborough D Whyte G George K Longitudinal plane colour tissue-Doppler myocardial velocities and their association with left ventricular length, volume, and mass in humans European Journal of Echocardiography 9 2008. 542–546. 10.1093/ejechocard/jen114 [DOI] [PubMed] [Google Scholar]
- 22. Ng C Wells A Padley S ACT sign of chronic pulmonary arterial hypertension: the ratio of main pulmonary artery to aortic diameter Journal of Thoracic Imaging 14 1999. 270–278. 10.1097/00005382-199910000-00007 [DOI] [PubMed] [Google Scholar]


 This work is licensed under a