Abstract
Quantitative analysis is an important part of the morphological assessment of the diseased mitral valve. It can be used to describe valve anatomy, pathology, function and the mechanisms of disease. Echocardiography is the main source of indirect quantitative data that is comparable with direct anatomic or surgical measurements. Furthermore, it can relate morphology with function. This review provides an account of current mitral valve quantification techniques and clinical applications.
Keywords: mitral valve, quantification, morphology, echocardiography, 3D, repair
Introduction
Assessment of mitral valve morphology reveals the variety of normal and abnormal features, with or without clinical or haemodynamic consequences. Furthermore, morphology assessment provides an insight into the aetiology and severity of valve disease, being essential for management planning (1, 2, 3, 4). Quantitative analysis is an integral part of morphology assessment and provides objective evidence for the classification of findings within the normal or abnormal range and also for guiding invasive treatment. Cardiac imaging-based morphology assessment has enriched the knowledge obtained from the direct assessment of specimens and at the time of cardiac surgery. Cardiac computed tomography (5, 6) and cardiac magnetic resonance (7, 8) have been used for this purpose; however, the most extensive experience and the wider range of applications belong to echocardiography, which is the most readily available cardiac imaging modality for diagnosis, follow-up and procedure guidance.
Echocardiography has played a central role in the description of progressive morphology changes induced by disease and in the understanding of the relation of morphology with function. The role of echocardiography commenced with M-mode, continued with two-dimensional (2D) echocardiography and now achieves a very detailed electronic dissection of the mitral valve anatomy and motion with 3D echocardiography (3, 4, 9). Echocardiography offers not only live images of the beating heart for inspection but also the ability to perform quantitative analysis on frozen frames throughout the cardiac cycle and, more recently, dynamic quantification from moving images. Direct surgical measurements represent the gold standard; however, they are performed on the arrested heart, while echocardiographic measurements are performed under physiologic loading conditions.
The range of 3D echocardiography quantification packages, the multitude of possible measurements and the complex analysis presented in research papers are daunting for clinicians. However, clinical implementation gives quantitative analysis its main strength, and in reality, the practical use of these techniques is straightforward and quantitation can be simplified.
Quantitative mitral valve anatomy
The normal range of quantitative parameters allows us to appreciate the significance of disease-induced changes, to guide mitral valve repair or to help preserve adequate continuity with the papillary muscles when the valve is replaced. Normal valve direct measurements originate only from anatomy studies, because surgical measurements are always performed on abnormal valves when they are intervened on. Indirect measurement data originates mainly from a series of small echocardiographic studies (10). The accepted normal range has been adjusted as a result of imaging advances. For example, the normal mitral valve annulus area has now been found to be on average ∼10 cm2, rather than 4–6 cm2, as previously described (2, 9).
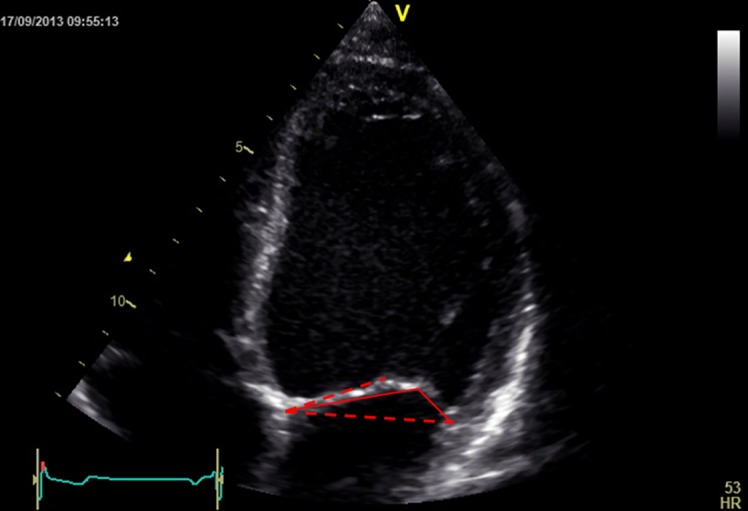
On transthoracic 2D echocardiography, we can measure the diameters of the annulus (anteroposterior in parasternal long axis view and inter-commissural in parasternal short axis view (p-SAX)) and calculate the area assuming an elliptic shape (10). The shape of the annulus is characterised by the ratio of the two diameters, as well as by the ratio of the anteroposterior diameter with the anterior leaflet length. The geometry of the subvalvular apparatus is characterised by the distance from the annulus to the respective and to the contralateral papillary muscle (Fig. 1) and by the inter-papillary distance. These are all measured in a two-chamber view visualising both papillary muscles (10). The distance between the papillary muscle tips and the annulus plane has been found to be the same in systole as in diastole in normal hearts, regardless of loading conditions (11). This ‘annulo-papillary balance’ avoids the tethering of the leaflets and is due to the fact that the apical displacement of the annulus equals papillary muscle shortening (12). The measurements of this distance are used to predict the neo-chords length needed to preserve left ventricular (LV) continuity in mitral valve replacement, a case in which the neo-chords are attached to the annulus rather than the leaflets. An anatomic study on normal hearts (13) found the papillary muscles to annulus distances to be shorter than the chord length, with no significant differences in chord length between the two papillary muscles, despite the more apical position of the posterior papillary muscle.
Figure 1.
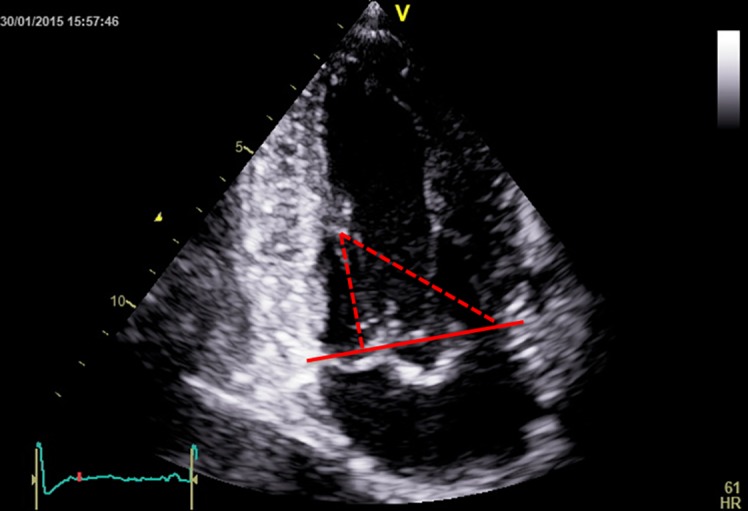
Papillary muscle to annulus plane (red continuous line) distances (red dotted lines).
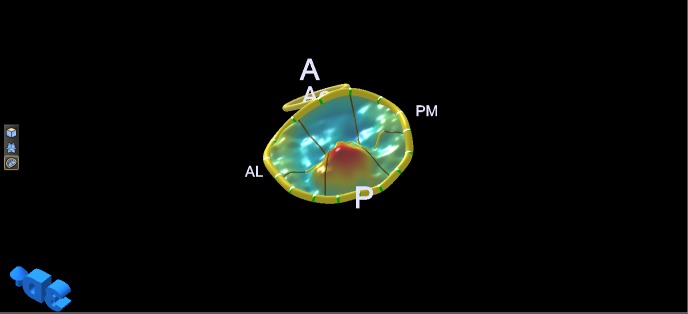
3D echocardiography provides volumetric measurements and the ability to measure parameters from 3D-guided 2D slices using a technique called multi-plane reconstruction (MPR). Integrated measurements obtained at end-systole with 3D transoesophageal echocardiography (TOE) have been used to generate static models of the valve morphology, which demonstrate the saddle shape of the annulus (Fig. 2), the shape of the leaflets, the closure line and the relative position of the papillary muscle tips (Fig. 3). The highest points of the saddle-shaped annulus are located anteriorly and posteriorly and the lowest points are located at the level of the commissures. Being non-planar, the annulus has both an actual 3D area and a projected area on the annulus plane (14). Measurements of diameters, perimeter, area and height (15) performed at end-systole and in diastole reveal dynamic changes throughout the cardiac cycle. This has led to the understanding that the mitral valve annulus bends along the commissural axis in systole, increasing its height, decreasing its projected area (9) and enhancing its saddle shape (16), which reduces stress on the valve leaflets (17). The actual area decreases as a result of posterior annulus circumferential length shortening, induced by contraction of circumferentially oriented atrial fibres at end-diastole and of helicoidally oriented myocardial fibres in systole (14).
Figure 2.
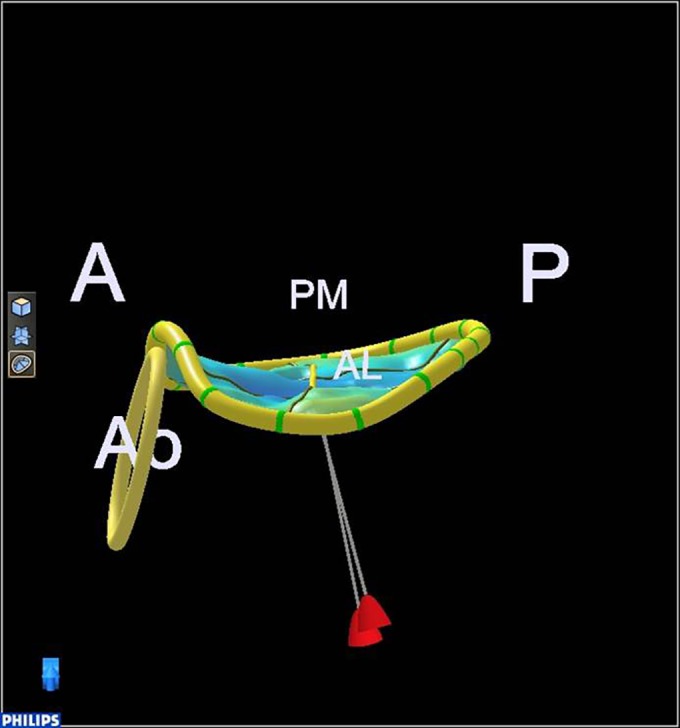
Normal annulus saddle shape. A, anterior; P, posterior; Ao, aortic valve; PM, postero-medial; AL, antero-lateral.
Figure 3.
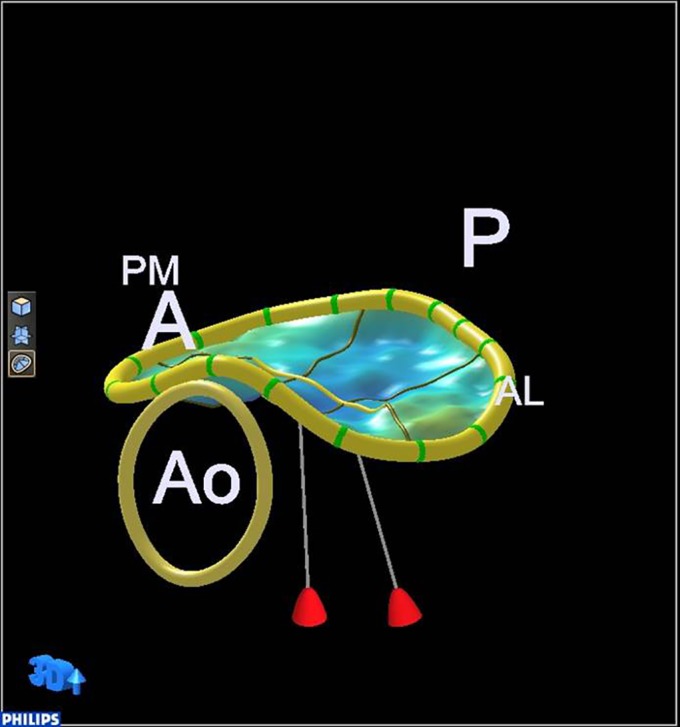
Normal annulus saddle and relative position of the papillary muscle tips. A, anterior; P, posterior; Ao, aortic valve; PM, postero-medial; AL, antero-lateral.
It has been demonstrated that, to avoid regurgitation, the total area of the leaflets has to be almost twice as large as the valve area (9), ensuring blood-tight closure through apposition and coaptation of the excessive leaflet tissue (18). The length of leaflet coaptation is usually ∼1 cm (14). The annular circumferential length of the leaflets is longer for the posterior leaflet (∼5 cm) and shorter for the anterior leaflet (∼3 cm); the radial length of the leaflets, however, is much shorter for the posterior leaflet and much longer for the anterior leaflet, which is also thicker (9). The anterior leaflet seems to cover the majority of the annulus plane surface in systole, even though the two leaflets have almost equal area (19). The middle scallop of the posterior leaflet (P2) is larger than the other two scallops in normal hearts (19).
A dynamic 3D mitral valve model was recently developed (20), which displays the mitral valve throughout the cardiac cycle. This is based on frame-by-frame, semi-automated quantification, with inspection and manual correction where needed. This dynamic quantification tool combines morphology with function. The measurements obtained are reproducible, except the systolic mitral valve orifice area (prone to error because of the low value) and the inter-commissural distance (prone to error because the commissures are not exact anatomic landmarks). The model has been validated on normal mitral valves, however its use on abnormal mitral valves may be more difficult. The static 3D model, despite having more operator interaction, can be inaccurate in cases of annular calcification, extensive prolapse and the coexistence of prolapse and tenting. It very much depends on operator understanding of valve morphology and correct tracing of valve components. The semi-automated nature of the dynamic model makes it less operator dependent and more reproducible (21). In the future, more complex quantitative algorithms, which take into consideration material properties and simulate biomechanics and fluid dynamics, will lead to more sophisticated biomechanical mitral valve models (21).
Quantitative mitral valve pathology
Multiple studies have compared surgical measurements with echocardiographic measurements, finding good correlation and defining a central role for echocardiography in procedure planning. Discrepancies are more likely for systolic echocardiographic measurements because diastolic measurements correspond better with measurements performed on the arrested heart.
Mitral stenosis
Mitral stenosis (MS) severity assessment, based on quantitative analysis of morphology, is well established in rheumatic disease. Commissural fusion gives the rheumatic valve a funnel shape, with a progressively smaller valve area from annulus to leaflet tips. The valve area measured with planimetry correlates best with the anatomic valve area of explanted valves and, consequently, it is the reference measure of MS severity. It is most accurately determined using 3D guided MPR (22). In calcific MS, the annulus is heavily calcified but the commissures may not be fused and the leaflets remain thin and can be difficult to render in 3D. The calcification extends from the annulus within one or both leaflets, at variable degrees, thereby distorting the valve orifice shape and this may make valve area measurements unreliable (22).
In MS, quantitative morphologic analysis plays little role in intervention planning, beyond severity assessment. Surgical intervention usually consists of valve replacement with excision of the thickened and calcified chords (13), so measurements are needed mainly to predict the length of the neo-chords as described in earlier.
Mitral regurgitation
Mitral regurgitation (MR) severity assessment is not based on quantitative analysis of morphology. Nevertheless, the severity of disease evaluation extends beyond that of regurgitation severity and encompasses morphologic characteristics of the valve. Consequently, quantitative morphologic analysis of the mitral valve plays a major role in intervention planning. It is used for predicting repair feasibility and complexity and therefore influences both surgical timing (23, 24) and surgeon selection. This is because the repair success rate depends not only on disease characteristics but also on specific mitral valve surgical expertise (2, 25, 26). Furthermore, 3D echocardiography quantitative analysis of morphology, combined with the surgical assessment of the valve, facilitates an individualised approach to mitral repair, resulting in an almost 100% success rate in degenerative disease (27). This quantitative-based approach to repair may benefit ischaemic MR as well because the non-individualised, standard undersized ring annuloplasty can have residual or recurring MR (25). Some 3D quantitative parameters of the valve (prolapsing height and anterior leaflet surface area) strongly predict complex repair success, irrespective of MR aetiology (1).
Primary MR
The most common cause of primary MR in developed countries is degenerative mitral valve disease (24). This may comprise fibroelastic deficiency (FED), Barlow's disease (BD) and an intermediate Forme-fruste with a spectrum of lesions (4) including leaflet tissue redundancy and prolapse, chord elongation or rupture and annulus dilatation and deformation. Repair complexity obviously depends on the complexity of valve lesions, which is more pronounced in BD.
Quantitative 3D echo analysis can differentiate between degenerative disease and normal valves based on a billowing height of >1.0 mm (28). Furthermore, 3D quantitative analysis can also differentiate between FED and BD based on a billowing (prolapsing) volume of 1.15 ml (28). This threshold for FED/BD differentiation is very low, selecting the valves with a very small prolapsing volume for which it predicts a straightforward repair, fulfilling the purpose of echocardiography. Surgical inspection is the gold standard for the classification of aetiology and complexity of repair; what is needed from echocardiography is high specificity, rather than high sensitivity for predicting a straightforward repair. This will prevent complex disease from reaching a surgeon without mitral valve expertise.
The prediction of repair complexity can be further refined both by using qualitative features (bi-leaflet and multi-segment prolapse) (1) and quantitative parameters obtained from 2D or 3D echocardiography (1, 3, 29, 30, 31). Complex repair is predicted by 3D echocardiography-derived parameters including larger prolapsing height, prolapsing volume and anterior leaflet surface area (1) together with larger annulus diameters (31). 3D TOE-based measurements of leaflet height and annulus diameters (anteroposterior, inter-commissural and anterolateral–posteromedial) correlate well with surgical measurements (31).
Quantitative parameters obtained from 2D or 3D echocardiography can also predict repair-induced systolic anterior motion (SAM) of the mitral valve, which could result in LV outflow tract obstruction. A large 3D-derived anterior leaflet surface area predicts SAM, particularly if an undersized annulus is used (28). Well-established 2D echocardiography predictors of SAM are a low anterior to posterior leaflet height ratio (<1.4), a large posterior leaflet height (>1.5 cm) and a short coaptation point to septum distance (<2.5 cm) (30).
The anterior leaflet height at A2 (middle scallop) helps select the appropriate ring size (32), and it is usually determined by the surgical measurement of the anterior leaflet (4). Post-repair, the presence of SAM is identified in the TOE 2D mid-oesophageal long-axis view (3). As previously mentioned, post-repair SAM is due to an undersized ring or an excessive residual posterior leaflet height (3). The excessive residual posterior leaflet displaces the coaptation point anteriorly, toward the septum and, consequently, a longer part of the anterior leaflet will be present below the coaptation point (30) leading to SAM. SAM may be resolved by further reducing the posterior leaflet height so as to displace the coaptation point posteriorly, away from the septum.
3D mitral valve (MV) quantification is performed at end-systole on TOE images (3). The quantification software available from most vendors is semi-automated. The annulus, aortic valve, commissures and papillary muscles tips are marked and an automatic tracing of the leaflets is generated. This can be corrected and the leaflets split into anterior and posterior by marking the coaptation points on 3D-guided 2D images (MPRs). With no further interaction from the operator, the software derives a 3D valve model and a series of measurements (annular diameters, circumference and area, annular non-planarity angle, the aortic to mitral valve annulus angle, leaflet surface areas and heights, total and per scallop prolapsing and tenting volumes and heights) (3).
2D measurements are made on the TOE long-axis or five-chamber mid-oesophageal view (3, 30). The lengths of the anterior and posterior leaflets are measured in systole, with the leaflets coapted, from annulus to coaptation for each leaflet, rather than in diastole with the leaflet straightened (30). The length of the anterior leaflet portion exceeding below the coaptation point (30) and the length of the anterior to posterior leaflet coaptation zone are also measured.
Quantification describes the valve characteristics reliably; 3D quantification has been found to have small inter- and intra-observer variability, although usually not enough to misclassify patients (28). Being reproducible, 3D quantification allows a comparison of serial findings and an accurate assessment of changes (25). Quantification has helped identify various pathological features, such as the failure of the annulus to accentuate its saddle shape during systole in degenerative mitral valve disease (31) and the phenomenon of papillary muscles traction in BD (33, 34). In this situation, the papillary muscles tips move toward the annulus rather than toward the LV apex during systole causing MR. Quantification also allows the differential diagnosis of prolapse aetiology (4) beyond the already mentioned billowing height and prolapsing volume. Barlow valves usually have multiple prolapsing scallops and are characterised by pronounced tissue redundancy (4) with atrialisation of leaflets, a larger total leaflet area and a larger area of each leaflet (28); the annulus is more dilated (usually >36 mm) (4), more circular in shape (inter-commissural to anteroposterior diameter ratio reduced to almost 1) and less non-planar (the non-planar angle is increased) (28). FED valves have one only prolapsing (or flail) scallop because of chordal elongation (or, respectively, rupture) with otherwise normal leaflet measurements (4); the annulus is normal in size (28–32 mm) and shape (4).
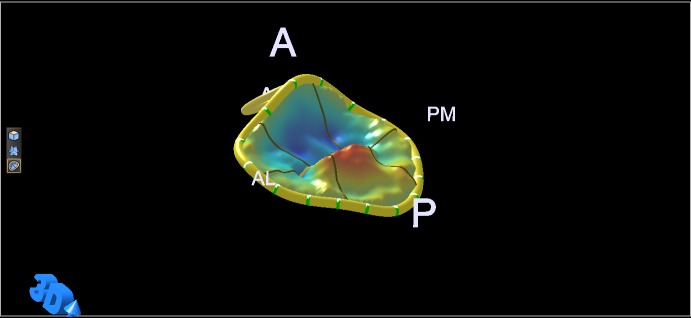
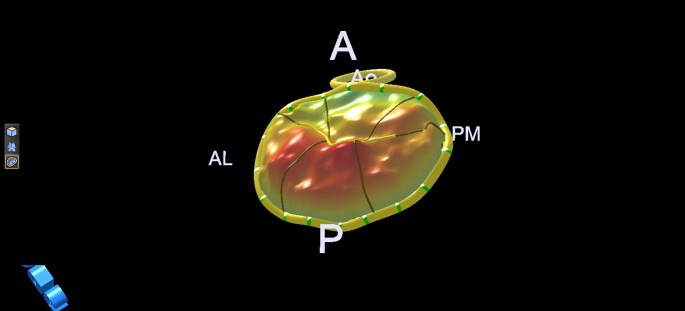
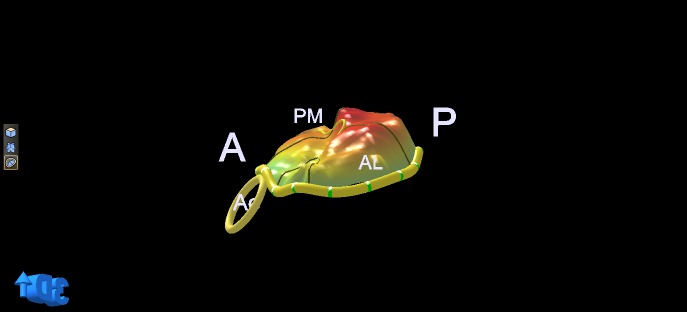
While qualitative morphologic analysis of the mitral valve with 3D or even 2D echocardiography (1) may be enough for aetiology diagnosis and repair complexity prediction in the hands of an experienced imaging cardiologist, 3D quantification is an essential tool for the less experienced. FED usually involves the middle scallop of the P2, and P2 has the greatest degree of prolapse in BD as well. On inspection, BD with multi-segmental prolapse and pronounced P2 prolapse (Fig. 4) can be misinterpreted as FED with lone P2 prolapse (Fig. 5), because relative to the other scallops, P2 protrudes more into the imaging plane and the eye interprets findings comparatively. Quantitative analysis can help differentiate between the two aetiologies. Furthermore, the 3D models generated from mitral valve quantification display the results in a colour-coded topographic map of leaflet displacement relative to the annulus (Figs 6, 7, 8, 9, 10 and 11), facilitating the recognition of pathology (25) and the communication of findings to the surgeon.
Figure 4.
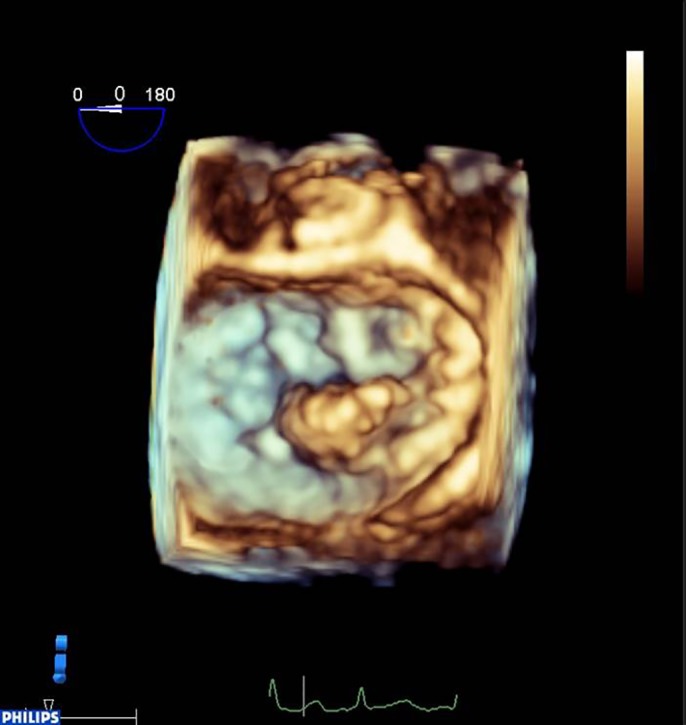
Predominant P2 prolapse.
Figure 5.
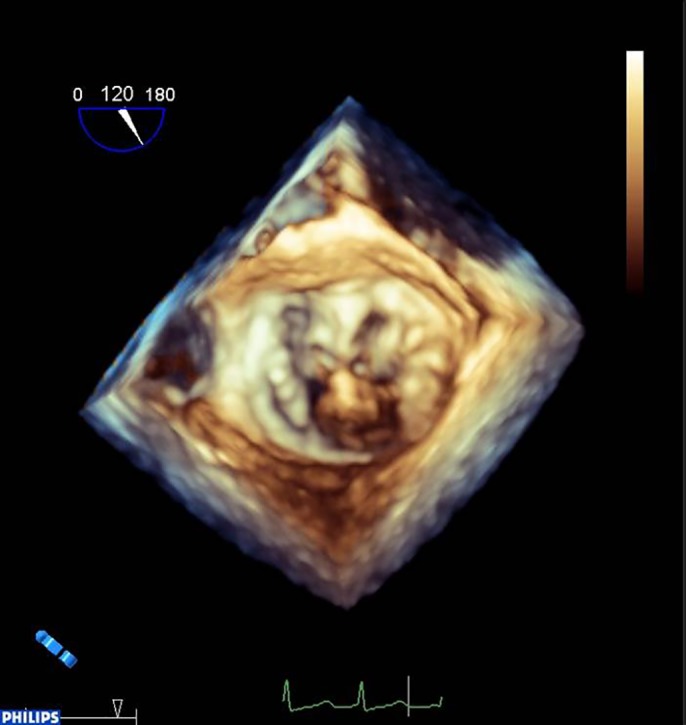
Lone P2 prolapse.
Figure 6.
3D model of the valve in Fig. 5 (lone P2 prolapse). A, anterior; P, posterior; Ao, aortic valve; PM, postero-medial; AL, antero-lateral.
Figure 7.
3D model of the valve in Fig. 4 (predominant P2 but also more extensive prolapse of the posterior leaflet and commissures). A, anterior; P, posterior; Ao, aortic valve; PM, postero-medial; AL, antero-lateral.
Figure 8.
3D model of Barlow valve with extensive prolapse.
Figure 9.
The 3D model from Fig. 8 displayed to reveal leaflet atrialisation.
Figure 10.
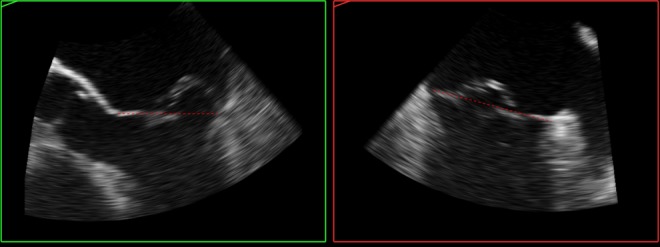
TOE 2D images (MPR) derived from the 3D dataset at Fig. 5 demonstrating single scallop prolapse and otherwise thin, normal leaflets not billowing above the annulus plane (red dotted line).
Figure 11.
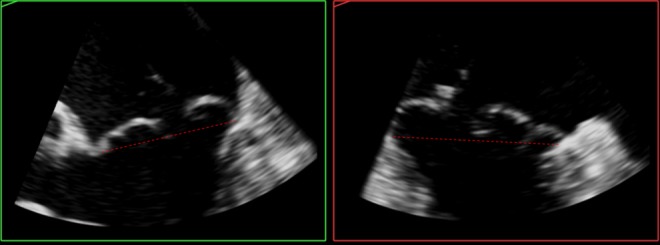
TOE 2D images (MPR) derived from the 3D dataset of the valve from Fig. 8 for an alternative demonstration of leaflet atrialisation, with extensive billowing above the annulus plane (red dotted line).
Quantification allows differential diagnosis between ‘indentations’ (<50% leaflet) and ‘clefts’ (>50% leaflet) seen on the 3D echocardiography mitral valve surgical view (25); the echocardiographic diagnosis of clefts is important because their detection is difficult on the arrested heart. Furthermore, quantification using 3D TOE allows an accurate measurement of the inter-trigonal diameter; the fibrous trigones are important surgical landmarks for the fixation of annuloplasty bands and rings (31). Last but not least, echocardiography provides systolic measurements, often more relevant to mitral valve function in regard with MR. For example, measurements aimed to predict neo-chordal length needed for mitral valve repair differ in systole from diastole (35). Diastolic measurements correlate with surgical measurements performed on arrested hearts. Nevertheless, systolic measurements predict the optimal neo-chord length that will restore valve competency (36). Unfortunately, chordal elongation is usually not diagnosed with echocardiography (32) or not reported and is frequently detected at the time of surgery (32).
In degenerative mitral valve disease, MR severity has been found to correlate with the following 3D echocardiography quantification parameters: annulus area, leaflet to annulus area ratio, leaflet prolapsing volume and height, papillary muscles to coaptation length and annulus saddle-shape flattening (reduced annulus height to commissural diameter ratio) (37). Annulus flattening is associated with an increased prevalence of chordal rupture or increased leaflet prolapsing volume in the absence of chordal rupture (37). Currently, annulus flattening is determined with quantitative analysis of 3D TOE images, so monitoring for surgical timing is not practical; nevertheless, future transthoracic mitral valve quantification advances may enable this to be performed without the need for TOE.
Secondary MR
Quantitative morphologic analysis based on 2D and 3D echocardiography has been used to describe the mitral valve in secondary MR. In secondary MR, the decision to intervene is based mostly on the MR severity and on the need for revascularisation, rather than on the valve morphology. Repair, usually offered in secondary MR of ischaemic aetiology at the time of surgical revascularisation, consists mainly of undersized annuloplasty (25, 38, 39), therefore limiting the role of quantitative parameters in procedure planning.
In secondary MR, the leaflets are normal but tethered because of LV remodelling and papillary muscle displacement. This can happen in both non-ischaemic dilated cardiomyopathy and in ischaemic cardiomyopathy (40). Only the posterior leaflet is tethered after inferior infarcts with regional but not global remodelling (40). Therefore there are two tethering patterns: symmetric (predominantly apical tethering of both leaflets) and asymmetric (predominantly posterior tethering of both leaflets) (41). As previously implied, the symmetric pattern occurs in non-ischaemic dilated cardiomyopathy and in ischaemic cardiomyopathy with significant LV remodelling encountered mainly after anterior infarcts (41). The asymmetric pattern occurs mainly after inferior infarcts (41).
Tethering is described quantitatively by the tenting volume (14) (3D echocardiography), tenting area (area between annulus plane and mitral valve leaflets in early systole) and the tenting height (also named coaptation height or coaptation depth and represents the distance from the annulus plane of the mitral valve to the leaflet coaptation point) (14, 40, 41). The tenting area (Fig. 12) and the tenting volume are measures of global tethering of the leaflets (14). Individual leaflet tethering is evaluated by measuring (or simply estimating) the tethering angle (Fig. 13) of the respective leaflet (14). This is because, depending on the distribution of the tethering forces on its length, the anterior leaflet can bend at a certain distance in-between its base and tip. So, the tethering of the anterior leaflet is characterised by two angles (Fig. 13): a proximal tethering angle and a distal tethering angle (14).
Figure 12.
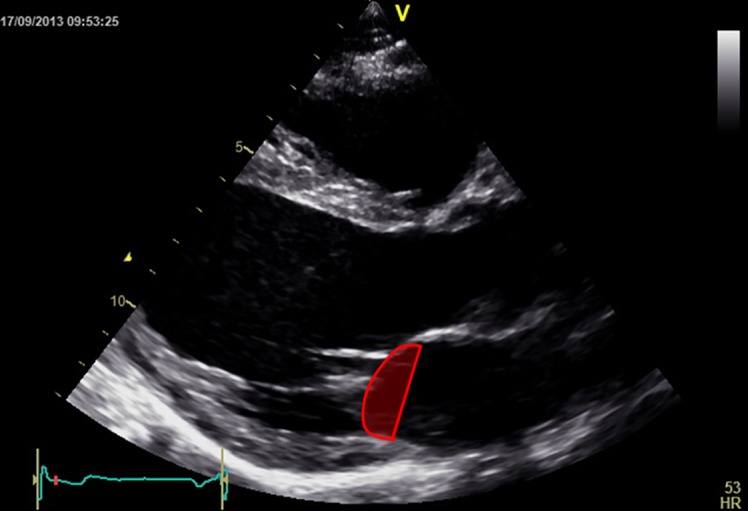
Tenting area.
Figure 13.
Tethering angles in valve with bent anterior leaflet. Red dotted lines define the annulus plane and the plane of the proximal anterior leaflet, and red continuous lines define the distal anterior leaflet and the posterior leaflet.
Global LV remodelling, which occurs in secondary MR, is described by LV volumes and sphericity index (short-to-long axis ratio). Local LV remodelling (41, 42) is described by the papillary muscle displacement from anatomic landmarks in early systole. These are posterior displacement from a line joining the septal insertions in p-SAX, lateral displacement from a central line perpendicular to the septal insertions line and displacement (distance) from each other. Posterior papillary muscle apical displacement is measured in the long axis from the papillary muscle head to the fixed intervalvular fibrosa. Similar degrees of posterior papillary muscle displacement have been described in both tethering types. However, higher anterior papillary muscle displacement occurs in the symmetric type (41).
Ischaemia- or infarction-induced changes in the annulo-papillary balance can provoke MR (12). Quantitative 3D echocardiography can be used to investigate these changes by assessing the apical displacement of the annulus and the annulus to papillary muscle tip distances.
Further mechanisms for secondary MR of ischaemic aetiology, including annular dilatation, reduced and delayed contraction of the posterior annulus (between the two commissures) and annulus flattening (increased non-planarity angle), which increases leaflet stress (14, 43). The annular non-planarity angle (angle between the anterior and the posterior part of the annulus relative to the inter-commissural diameter) and the circularity index (anteroposterior to anterolateral–posteromedial diameter ratio) were found to remain unchanged (44) after surgical revascularisation in patients with ischaemic mild-to-moderate MR.
Attempts to use quantification for intervention planning have been made with both 2D and 3D echocardiography. The coaptation depth is a measure of remodelling induced papillary muscle displacement and has been found to indicate (40) repair suitability if ≤10 mm. More recently, primarily the posterior leaflet angle and the anterior leaflet angle, the tenting height and the tenting volume derived from 3D echocardiography were also found to predict the complexity of repair (1). Parameters predicting residual or recurring MR post mitral valve repair with undersized annuloplasty are tenting height >1 cm, tenting area >2.5 cm2, posterior leaflet angle >45°, distal anterior leaflet angle >25° and asymmetric tethering (14, 39).
Quantitative analysis of morphology based on 3D echocardiography reveals evidence of mitral valve adaptation and leaflet growth (18, 45, 46). In dilated cardiomyopathy, annulus dilatation results in a larger mitral valve area to be covered by the leaflets and, additionally, the leaflets are tethered leading to MR due to incomplete valve closure. The mitral valve leaflet area was found to be 35% larger in dilated cardiomyopathy than in normal hearts, and furthermore, the degree of MR was found to correlate with the relative leaflet growth for the respective mitral valve area (45). Similar findings of leaflet growth and adaptation have been reported by other investigators, both in dilated cardiomyopathy and in aortic regurgitation-induced LV eccentric hypertrophy (46). Certainly, the valve leaflet area may simply be larger because of unfolding rather than leaflet growth.
Conclusion
Echocardiography provides easily accessible quantitative analysis of mitral valve morphology that can be obtained on the beating heart. This facilitates correlation of anatomy, function, pathology and malfunction to unravel their underlying mechanisms. Morphology quantification now has an established and evolving role in clinical practice, which has been primarily validated at the time of surgery and can guide interventions. Advances in transthoracic 3D echo and dynamic 3D quantification may add further value in the future.
Declaration of interest
The authors declare that there is no conflict of interest that could be perceived as prejudicing the impartiality of the review.
Funding
This review did not receive any specific grant from any funding agency in the public, commercial or not-for-profit sector.
References
- 1. Chikwe J Adams DH Su KN Anyanwu AC Lin HM Goldstone AB Lang RM Fischer GW Can three-dimensional echocardiography accurately predict complexity of mitral valve repair? European Journal of Cardio-Thoracic Surgery 41 2012. 518–524. 10.1093/ejcts/ezr040 [DOI] [PubMed] [Google Scholar]
- 2. Adams DH Anyanwu AC The cardiologist's role in increasing the rate of mitral valve repair in degenerative disease Current Opinion in Cardiology 23 2008. 105–110. 10.1097/HCO.0b013e3282f4fe47 [DOI] [PubMed] [Google Scholar]
- 3. Lang RM Salgo IS Anyanwu AC Adams DH The road to mitral valve repair with live 3D transesophageal echocardiography Medicamundi 52 2008. 37–42. [Google Scholar]
- 4. Adams DH Rosenhek R Falk V Degenerative mitral valve regurgitation: best practice revolution European Heart Journal 31 2010. 1958–1967. 10.1093/eurheartj/ehq222 [DOI] [PMC free article] [PubMed] [Google Scholar]
- 5. Shanks M Delgado V Ng ACT van der Kley F Schuijf JD Boersma E van de Veire NRL Nucifora G Bertini M de Roos A et al. Mitral valve morphology assessment: three-dimensional transesophageal echocardiography versus computed tomography Annals of Thoracic Surgery 90 2010. 1922–1929. 10.1016/j.athoracsur.2010.06.116 [DOI] [PubMed] [Google Scholar]
- 6. Delgado V Tops LF Schuijf JD de Roos A Brugada J Schlij MJ Assessment of mitral valve anatomy and geometry with multislice computed tomography JACC. Cardiovascular Imaging 2 2009. 556–565. 10.1016/j.jcmg.2008.12.025 [DOI] [PubMed] [Google Scholar]
- 7. Kaji S Nasu M Yamamuro A Tanabe K Nagai K Tani T Tamita K Shiratori K Kinoshita M Senda M et al. Annular geometry in patients with chronic ischemic mitral regurgitation: three-dimensional magnetic resonance imaging study Circulation 112 2005. I409–I414. 10.1161/CIRCULATIONAHA.104.525246 [DOI] [PubMed] [Google Scholar]
- 8. Myerson SG Heart valve disease: investigation by cardiovascular magnetic resonance. Journal of Cardiovascular Magnetic Resonance. 2012;14:7. doi: 10.1186/1532-429X-14-7. [DOI] [PMC free article] [PubMed] [Google Scholar]
- 9. Dal-Bianco JP Levine RA Anatomy of the mitral valve apparatus – role of 2D and 3D echocardiography Cardiology Clinics 31 2013. 151–164. 10.1016/j.ccl.2013.03.001 [DOI] [PMC free article] [PubMed] [Google Scholar]
- 10. Nordblom P Bech-Hanssen O Reference values describing the normal mitral valve and the position of the papillary muscles Echocardiography 24 2007. 665–672. 10.1111/j.1540-8175.2007.00474.x [DOI] [PubMed] [Google Scholar]
- 11. Komeda M Glasson JR Bolger AF Daughters GT Ingels NB Craig Miller D Papillary muscle–left ventricular wall “complex” Journal of Thoracic and Cardiovascular Surgery 113 1997. 292–301. 10.1016/S0022-5223(97)70326-X [DOI] [PubMed] [Google Scholar]
- 12. Silbiger JJ Novel pathogenetic mechanisms and structural adaptations in ischemic mitral regurgitation Journal of the American Society of Echocardiography 26 2013. 1107–1117. 10.1016/j.echo.2013.07.003 [DOI] [PubMed] [Google Scholar]
- 13. Sakai T Okita Y Ueda Y Tahata T Ogino H Matsuyama K Miki S Distance between mitral annulus and papillary muscles: anatomic study in normal human hearts Journal of Thoracic and Cardiovascular Surgery 118 1999. 636–641. 10.1016/S0022-5223(99)70008-5 [DOI] [PubMed] [Google Scholar]
- 14. Silbiger JJ Mechanistic insights into ischemic mitral regurgitation: echocardiographic and surgical implications Journal of the American Society of Echocardiography 24 2011. 707–719. 10.1016/j.echo.2011.04.001 [DOI] [PubMed] [Google Scholar]
- 15. Kovalova S Necas J RT-3D TEE: characteristics of mitral annulus using mitral valve quantification (MVQ) program Echocardiography 28 2011. 461–467. 10.1111/j.1540-8175.2010.01340.x [DOI] [PubMed] [Google Scholar]
- 16. Komoda T Hetzer R Oellinger J Sinlawski H Hofmeister J Hübler M Felix R Uyama C Maeta H Mitral annular flexibility Journal of Cardiac Surgery 12 1997. 102–109. 10.1111/j.1540-8191.1997.tb00103.x [DOI] [PubMed] [Google Scholar]
- 17. Salgo IS Gorman JH III Gorman RC Jackson BM Bowen FW Plappert T St John Sutton MG Edmunds LH Jr Effect of annular shape on leaflet curvature in reducing mitral leaflet stress Circulation 106 2002. 711–717. 10.1161/01.CIR.0000025426.39426.83 [DOI] [PubMed] [Google Scholar]
- 18. Chaput M Handschumacher MD Tournoux F Hua L Guerrero JL Vlahakes GJ Levine RA Mitral leaflet adaptation to ventricular remodeling: occurrence and adequacy in patients with functional mitral regurgitation Circulation 118 2008. 845–852. 10.1161/CIRCULATIONAHA.107.749440 [DOI] [PMC free article] [PubMed] [Google Scholar]
- 19. Ho SY Anatomy of the mitral valve Heart 88: Suppl IV 2002. iv5–iv10. 10.1136/heart.88.suppl_4.iv5 [DOI] [PMC free article] [PubMed] [Google Scholar]
- 20. Noack T Mukherjee C Kiefer P Emrich F Vollroth M Ionasec RI Voigt I Houle H Ender J Misfeld M et al. Four-dimensional modelling of the mitral valve by real-time 3D transoesophageal echocardiography: proof of concept Interactive Cardiovascular and Thoracic Surgery 20 2015. 200–208. 10.1093/icvts/ivu357 [DOI] [PubMed] [Google Scholar]
- 21. Noack T Kiefer P Ionasec R Voigt I Mansi T Vollroth M Hoebartner M Misfeld M Mohr FW Seeburger J New concepts for mitral valve imaging Annals of Cardiothoracic Surgery 2 2013. 787–795. 10.3978/j.issn.2225-319X [DOI] [PMC free article] [PubMed] [Google Scholar]
- 22. Baumgartner H Hung J Bermejo J Chambers JB Evangelista A Griffin BP Iung B Otto CM Pellikka PA Quiñones M Echocardiographic assessment of valve stenosis: EAE/ASE recommendations for clinical practice European Journal of Echocardiography 10 2009. 1–25. 10.1093/ejechocard/jen303 [DOI] [PubMed] [Google Scholar]
- 23. Vahanian A Alfieri O Andreotti F Antunes MJ Barón-Esquivias G Baumgartner H Borger MA Carrel TP De Bonis M Evangelista A et al. Guidelines on the management of valvular heart disease European Heart Journal 33 2012. 2451–2496. 10.1093/eurheartj/ehs109 [DOI] [PubMed] [Google Scholar]
- 24. Nishimura RA Otto CM Bonow RO Carabello BA Erwin JP Guyton RA O'Gara PT Ruiz CE Skubas NJ Sorajja P et al. 2014 AHA/ACC guideline for the management of patients with valvular heart disease Journal of the American College of Cardiology 63 2014. e57–e185. 10.1016/j.jacc.2014.02.536 [DOI] [PubMed] [Google Scholar]
- 25. Tsang W Lang RM Three-dimensional echocardiography is essential for intraoperative assessment of mitral regurgitation Circulation 128 2013. 643–652. 10.1161/CIRCULATIONAHA.112.120501 [DOI] [PubMed] [Google Scholar]
- 26. Anyanwu AC Bridgewater B Adams DH The lottery of mitral valve repair surgery Heart 96 2010. 1964–1967. 10.1136/hrt.2010.199620 [DOI] [PubMed] [Google Scholar]
- 27. Castillo JG Anyanwu AC Fuster V Adams DH A near 100% repair rate for mitral valve prolapse is achievable in a reference center: implications for future guidelines Journal of Thoracic and Cardiovascular Surgery 144 2012. 308–312. 10.1016/j.jtcvs.2011.12.054 [DOI] [PubMed] [Google Scholar]
- 28. Chandra S Salgo IS Sugeng L Weinert L Tsang W Takeuchi M Spencer KT O'Connor A Cardinale M Settlemier S et al. Characterization of degenerative mitral valve disease using morphologic analysis of real-time three-dimensional echocardiographic images. Objective insight into complexity and planning of mitral valve repair Circulation. Cardiovascular Imaging 4 2011. 24–32. 10.1161/CIRCIMAGING.109.924332 [DOI] [PubMed] [Google Scholar]
- 29. Ender J Sgouropoulou S Value of transesophageal echocardiography (TEE) guidance in minimally invasive mitral valve surgery Annals of Cardiothoracic Surgery 2 2013. 796–802. 10.3978/j.issn.2225-319X.2013.10.09 [DOI] [PMC free article] [PubMed] [Google Scholar]
- 30. Maslow AD Regan MM Haering JM Johnson RG Levine RA Echocardiographic predictors of left ventricular outflow tract obstruction and systolic anterior motion of the mitral valve after mitral valve reconstruction for myxomatous valve disease Journal of the American College of Cardiology 34 1999. 2096–2104. 10.1016/S0735-1097(99)00464-7 [DOI] [PubMed] [Google Scholar]
- 31. Biaggi P Jedrzkiewicz S Gruner C Meineri M Karski J Vegas A Tanner FC Rakowski H Ivanov J David TE et al. Quantification of mitral valve anatomy by three-dimensional transesophageal echocardiography in mitral valve prolapse predicts surgical anatomy and the complexity of mitral valve repair Journal of the American Society of Echocardiography 25 2012. 758–765. 10.1016/j.echo.2012.03.010 [DOI] [PubMed] [Google Scholar]
- 32. Berrebi A Mitral valve repair: echocardiography is its best friend Revista Española de Cardiología 64 2011. 554–556. 10.1016/j.rec.2011.03.017 [DOI] [PubMed] [Google Scholar]
- 33. Sanfilippo AJ Harrigan P Popovic AD Weyman AE Levine RA Papillary muscle traction in mitral valve prolapse: quantitation by two-dimensional echocardiography Journal of the American College of Cardiology 19 1992. 564–571. 10.1016/S0735-1097(10)80274-8 [DOI] [PubMed] [Google Scholar]
- 34. Lee TM Su SF Huang TY Chen MF Liau CS Lee YT Excessive papillary muscle traction and dilated mitral annulus in mitral valve prolapse without mitral regurgitation American Journal of Cardiology 78 1996. 482–485. 10.1016/0002-9149(97)00002-7 [DOI] [PubMed] [Google Scholar]
- 35. Weber A Hurni S Vandenberghe S Wahl A Aymard T Vogel R Carrel T Ideal site for ventricular anchoring of artificial chordae in mitral regurgitation Journal of Thoracic and Cardiovascular Surgery 143 2012. S78–S81. 10.1016/j.jtcvs.2011.09.031 [DOI] [PubMed] [Google Scholar]
- 36. Huang HL Xie XJ Fei HW Xiao XJ Liu J Zhuang J Lu C Real-time three-dimensional transesophageal echocardiography to predict artificial chordae length for mitral valve repair. Journal of Cardiothoracic Surgery. 2013;8:137. doi: 10.1186/1749-8090-8-137. [DOI] [PMC free article] [PubMed] [Google Scholar]
- 37. Lee AP Hsiung MC Salgo IS Fang F Xie JM Zhang YC Lin QS Looi JL Wan S Wong RH et al. Quantitative analysis of mitral valve morphology in mitral valve prolapse with real-time 3-dimensional echocardiography. Importance of annular saddle shape in the pathogenesis of mitral regurgitation Circulation 127 2013. 832–841. 10.1161/CIRCULATIONAHA.112.118083 [DOI] [PubMed] [Google Scholar]
- 38. Kang DH Kim MJ Kang SJ Song JM Song H Hong MK Choi KJ Song JK Lee JW Mitral valve repair versus revascularization alone in the treatment of ischemic mitral regurgitation Circulation 114 2006. I499–I503. 10.1161/CIRCULATIONAHA.105.611202 [DOI] [PubMed] [Google Scholar]
- 39. Ciarka A Braun J Delgado V Versteegh M Boersma E Klautz R Dion R Bax JJ Van de Veire N Predictors of mitral regurgitation in patients with heart failure undergoing mitral valve annuloplasty American Journal of Cardiology 106 2010. 395–401. 10.1016/j.amjcard.2010.03.042 [DOI] [PubMed] [Google Scholar]
- 40. Calafiore AM Di Mauro M Gallina S Di Giammarco G Iacò AL Teodori G Tavarozzi I Mitral valve surgery for chronic ischemic mitral regurgitation Annals of Thoracic Surgery 77 2004. 1989–1997. 10.1016/j.athoracsur.2003.11.017 [DOI] [PubMed] [Google Scholar]
- 41. Agricola E Oppizzi M Maisano F De Bonis M Schinkel AF Torracca L Margonato A Melisurgo G Alfieri O Echocardiographic classification of chronic ischemic mitral regurgitation caused by restricted motion according to tethering pattern European Journal of Echocardiography 5 2004. 326–334. 10.1016/j.euje.2004.03.001 [DOI] [PubMed] [Google Scholar]
- 42. Yiu SF Enriquez-Sarano M Tribouilloy C Seward JB Tajik AJ Determinants of the degree of functional mitral regurgitation in patients with systolic left ventricular dysfunction: a quantitative clinical study. Circulation. 2000;102:1400e6. doi: 10.1161/01.CIR.102.12.1400. [DOI] [PubMed] [Google Scholar]
- 43. Watanabe N Ogasawara Y Yamaura Y Wada N Kawamoto T Toyota E Akasaka T Yoshida K Mitral annulus flattens in ischemic mitral regurgitation: geometric differences between inferior and anterior myocardial infarction. A real-time 3-dimensional echocardiographic study Circulation 112 2005. 1458–1462. 10.1161/CIRCULATIONAHA.104.509760 [DOI] [PubMed] [Google Scholar]
- 44. Govindan S Hayward G Mahmood F Subramaniam B Echocardiographic quantification of mitral valvular response to myocardial revascularization Annals of Cardiac Anaesthesia 16 2013. 23–27. 10.4103/0971-9784.105366 [DOI] [PubMed] [Google Scholar]
- 45. Chaput M Handschumacher MD Guerrero JL Holmvang G Dal-Bianco JP Sullivan S Vlahakes GJ Hung J Levine RA Leducq Foundation MITRAL Transatlantic Network Mitral leaflet adaptation to ventricular remodeling prospective changes in a model of ischemic mitral regurgitation Circulation 120: Suppl 1 2009. S99–S103. 10.1161/CIRCULATIONAHA.109.844019 [DOI] [PMC free article] [PubMed] [Google Scholar]
- 46. Dal-Bianco JP Levine RA The mitral valve is an actively adapting tissue: new imaging evidence European Heart Journal Cardiovascular Imaging 16 2015. 286–287. 10.1093/ehjci/jeu300 [DOI] [PubMed] [Google Scholar]


 This work is licensed under a