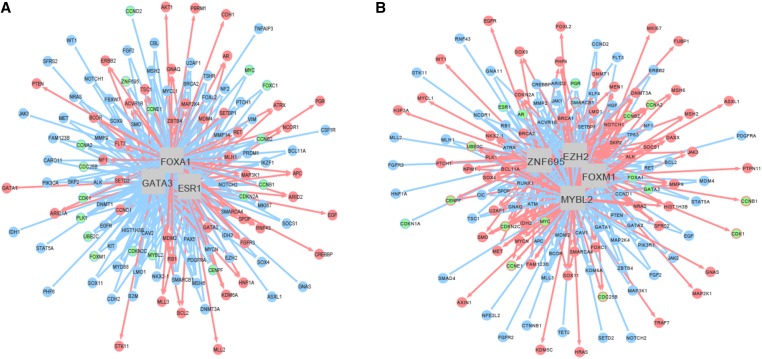
Figure 3.
Cross-subtype gene regulatory networks. The networks are derived from the TCGA RNA-Seq data with 646 primary breast tumor samples across the four major subtypes. The nodes in the circle represent target genes (regulons), and the edges connecting the MRs and the target genes indicate interactions between them. Red and blue colors denote up- and down-regulation, respectively. (A) A gene regulatory network illustrating the interactions between three representative group 1 MRs and regulons. Green nodes are either highlighted cell cycle genes or group 2 MRs. Other group 1 MRs, such as PGR, are up-regulated by the central regulators. However, group 2 MRs, such as FOXM1 and ZNF695, and cell cycle genes, such as CCNB1 and CDK1, are down-regulated by the central MRs. (B) A gene regulatory network illustrating the interactions between four group 2 MRs and regulons. Green nodes are highlighted for either cell cycle genes or group 1 MRs. Other group 2 MRs, such as SOX11 and the cell cycle genes, are up-regulated by the central MRs. However, group 1 MRs, such as ESR1 and AR, are down-regulated by the central MRs.

