Abstract
We describe recent upgrades to a 3D tracking microscope to include simultaneous Nipkow spinning disk imaging and time-gated single-particle tracking (SPT). Simultaneous 3D molecular tracking and spinning disk imaging enable the visualization of cellular structures and proteins around a given fluorescently labeled target molecule. The addition of photon time-gating to the SPT hardware improves signal to noise by discriminating against Raman scattering and short-lived fluorescence. In contrast to camera-based SPT, single-photon arrival times are recorded, enabling time-resolved spectroscopy (e.g., measurement of fluorescence lifetimes and photon correlations) to be performed during single molecule/particle tracking experiments.
Single-particle tracking (SPT) is a proven method for observing molecular dynamics in live cells.1,2 While initial SPT microscopy experiments followed 2D molecular or particle motion with CCD cameras, a number of techniques (both confocal and wide-field) have been developed to follow 3D particle/molecule motion.3–14 Three dimensional particle and molecule tracking methods have been recently reviewed elsewhere.15,16 In brief, for wide-field 3D tracking microscopy methods, out of plane (Z) information is obtained either by the use of multiple image planes, having a point spread function that encodes the Z position, or by very fast 3D whole-cell imaging.10,11,13 Wide-field based tracking methods have the distinct advantage that a large number of particles can be tracked simultaneously. The temporal resolution in wide-field methods is limited by the readout rate of the camera, which is typically tens of ms, but can be pushed to tens of μs with specialized cameras and very bright labels.17
In confocal-based 3D tracking approaches, 3D positional information can be obtained via a spatial modulation of the excitation beam (e.g., in orbital tracking methods), by having a probe volume with 3D position sensitivity, or through temporally encoding different excitation volumes in the sample.4–8,18–20 There are a number of advantages to confocal 3D tracking approaches. First, the temporal resolution of the trajectory is limited by the emission rate of the fluorophore (and not by a camera framing rate) and time-resolved spectroscopy can be performed on the fluorescent target being tracked.7 Additionally, confocal methods have the ability to track in high background environments due to the spatial filtering inherent in confocal imaging.21 Finally, whole cell photo-damage is minimized compared to wide-field approaches as only a small region around the target molecule/particle is excited during tracking.
A limitation of confocal-based 3D tracking methods is that they only follow one particle at a time. However, the environment surrounding this particle (including the motion of other particles/molecules in the same Z plane) can be obtained from concurrent wide-field or confocal scanning imaging recorded during the trajectory.22 For example, Welsher and Yang recently demonstrated two-photon multi-color fluorescence imaging during 3D tracking to obtain images of the cell during nanoparticle attachment and internalization.23
While combined fluorescence imaging with 3D single-particle tracking yields enhanced contextual information, labeling the cell with fluorescently labeled antibodies or fluorescent proteins can increase the background levels in the single-particle tracking channel, degrading signal to noise and localization accuracy.24 Additionally, for confocal feedback methods that move the sample stage, there is motion blur in the contextual image due to stage motion during image acquisition. In this note, we demonstrate methods to help alleviate both of the aforementioned problems of simultaneous fluorescence imaging and 3D single-particle tracking by confocal feedback (high backgrounds from fluorescently labeled cells and image blurring caused by stage motion). First, we discuss the use of time-gating to minimize the contribution of fluorescence background to the observed tracks.25,26 Second, we employ spinning disk imaging with short (10-50 ms) acquisition times to minimize motion blur effects.
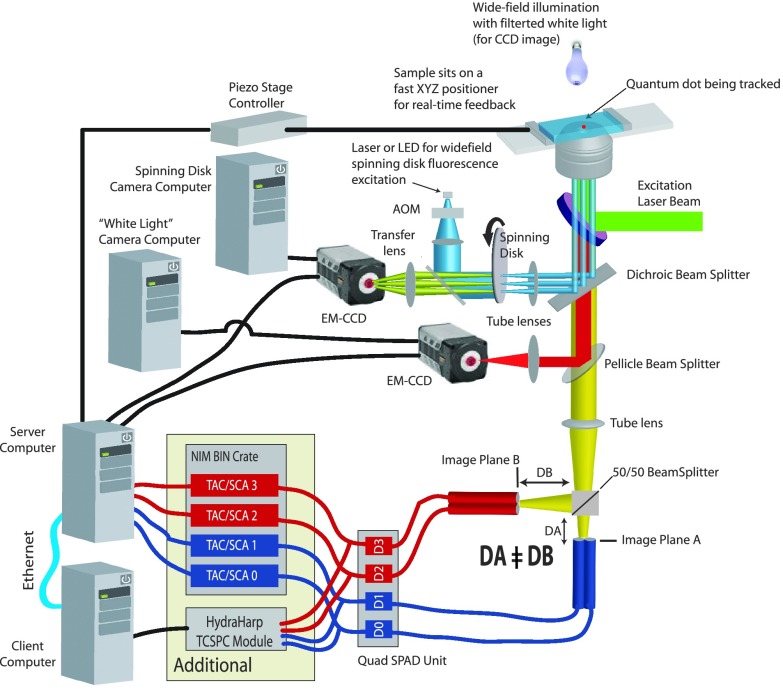
Our 3D tracking approach has been described in detail elsewhere.8,21,26–30 In brief, we use a custom stage scanning confocal microscope that employs 4 confocal detection volumes (arranged as a tetrahedron in sample space), yielding 3D position sensitivity. Active feedback of an XYZ piezo stage is performed once every 5 ms to keep the molecule or particle in the center of the tetrahedral probe volume to follow its 3D motion. A schematic of the tracking instrument is shown in Fig. 1. Primary changes over previous versions of this instrument include the addition of simultaneous spinning disk imaging and using four time-to-amplitude converter (TAC) modules for time-gated molecule or particle tracking.
FIG. 1.
Schematic of the tracking microscope. See text for details. Reproduced with permission from DeVore et al., Proc. SPIE 9338, 933812 (2015). Copyright 2015 SPIE.
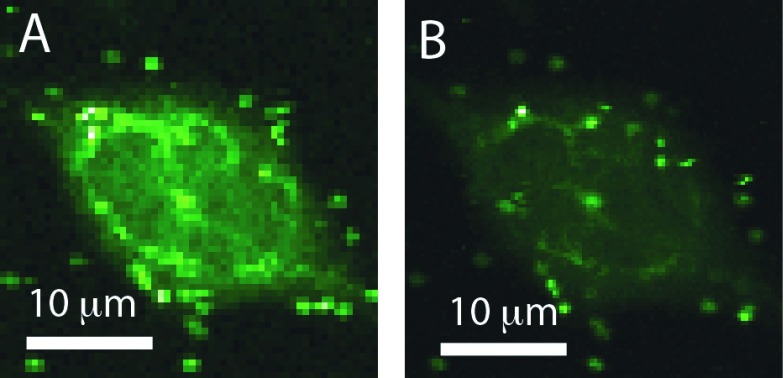
In time gating, pulsed excitation and time resolved detection are used to measure the arrival time of a detected photon with respect to the excitation laser pulse. For time gating, detected photons that arrive within a given time window following the excitation pulses are discarded in the analysis, which can substantially reduce background that has a shorter lifetime than the particle or target molecule being tracked. The benefits of time gating are perhaps best visualized in confocal imaging, as shown in Fig. 2 and demonstrated previously.25 For this image and the tracking data, the excitation source was a pulsed semiconductor diode laser (PicoQuant PC485B) operated at 10 MHz pulse repetition rate with a ∼100 ps pulse width. Approximately, 1 μW of laser power (∼100 W/cm2 intensity) was used for 3D tracking.
FIG. 2.
Raw (a) and time-gated (b) images of a rat mast cell fluorescently labeled with YFP-tubulin and quantum dot labeled IgE-FcεRI. Reduction of the shorter-lived YFP fluorescence by the time gate results in a more of punctate appearance of the longer-lived QD-IgE-FcεRI emission and improved particle tracking. Reproduced with permission from DeVore et al., Proc. SPIE 9338, 933812 (2015). Copyright 2015 SPIE.
For confocal imaging applications (such as Fig. 2 and Ref. 25), time-gating can be performed in a post-processing fashion (i.e., the arrival time of all detected photons is recorded and the image is constructed only from those photons detected in a certain time window). However, this post-processing approach lacks the speed needed for real-time 3D particle tracking at 200 Hz feedback (or faster) rates.
For fast, real-time time-gating, we employ four TAC modules that provide a single channel analyzer (SCA) pulse for each photon detected within a given time window. We have previously determined the optimal time-gate for single quantum dot tracking applications and have measured the signal lost due to the dead-time of the TAC, with photons arriving within 4 ns of the excitation laser pulse discarded.26 Furthermore, we use custom-synthesized non-blinking quantum dots as labels, whose suppressed blinking enables long trajectories and whose long fluorescence lifetime enables background rejection from fluorescent proteins by time-gating.26,30
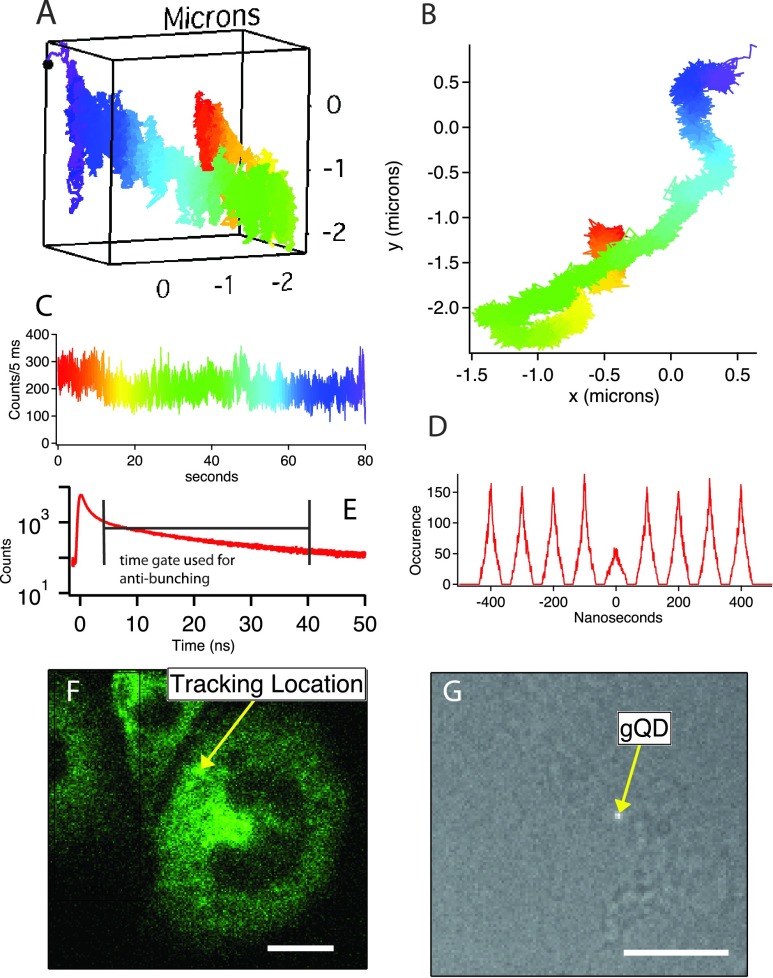
Fig. 3 shows a time-gated 3D trajectory of a single allergy receptor (FcεRI labeled with a quantum dot) on a stimulated rat mast cell (RBL-2H3) labeled with YFP-clathrin. Fig. 3(a) shows a 3D representation of the trajectory, color coded to denote the passage of time. Fig. 3(b) is an XY projection of the measured 3D trajectory. The motion itself appears highly compartmentalized or corralled to almost a one dimensional crevice, with the 3D representation showing this structure to be spread in Z by approximately 2 μm. A histogram of arrival times between detected photons (a photon pair correlation), Fig. 3(d), shows that this trajectory is unequivocally that of a single quantum dot, as the area of the central t = 0 peak in the pair correlation histogram is less than ½ the areas of the neighboring peaks.20 Fig. 3(f) shows a spinning disk fluorescence image of the cell (obtained at an integration time of 300 ms recorded during the trajectory), whereas Fig. 3(g) shows a single white light image recorded during the trajectory. Clearly the spinning disk fluorescence image of the cell (Fig. 3(f)) provides greater contextual information than the white light image, where it is difficult to even identify the cell outline.
FIG. 3.
Time-gated tracking of a single QD labeled IgE-FcεRI with simultaneous spinning disk imaging. Scale bar is 10 μm. See text for details.
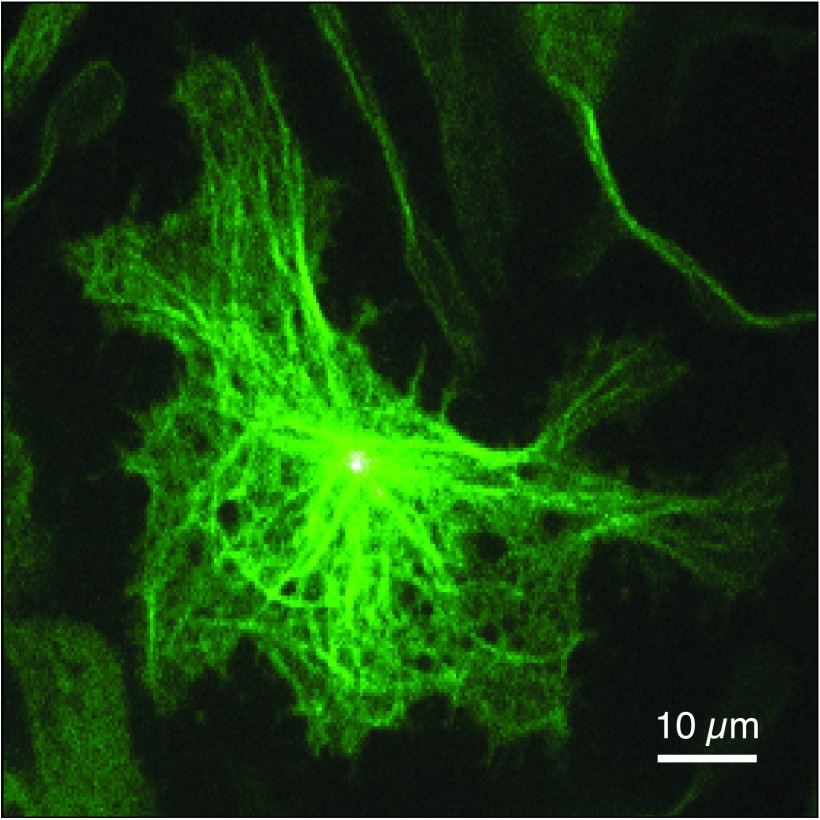
While the spinning disk image provided by LED excitation (Fig. 3(f)) enables visualizing the cellular outline, we have improved the clarity and contextual information of the spinning disk image by employing laser excitation and by labeling structural components of the cell (the cytoskeleton), see Fig. 4.
FIG. 4.
A spinning disk image of a rat mast cell labeled with GFP-tubulin obtained with 40 ms integration on the tracking microscope.
Using laser excitation substantially shortens the exposure time needed for fluorescence imaging over LED excitation (Fig. 3(e) was obtained in 300 ms, Fig. 4 was obtained in 40 ms). The overall light-dose to the cell is minimized by synchronizing laser excitation (via an acousto-optic modulator) with camera exposure. This shorter integration period substantially reduces image blur due to stage motion during 3D tracking experiments. For example, when tracking a receptor having a diffusion coefficient of ∼0.1 μm2/s as is typically encountered in the IgE-FcεRI system, the average distance moved by the stage to follow molecular motion over 300 ms (the integration time used for Fig. 3(e)) is ∼0.42 μm compared to ∼0.16 μm of motion for a 40 ms integration period.30 We emphasize 0.16 μm of motion is nearly imperceptible in a diffraction-limited image. The spinning disk imaging approach described here has better 3D sectioning capability than epi-fluorescence methods and has better timing resolution than confocal scanning based methods of obtaining cellular contextual information while tracking by active feedback.23 In future experiments, the short integration times of laser-based spinning disk imaging will provide 3D dynamic information regarding cell morphology during 3D particle tracking.
Acknowledgments
We acknowledge the National Institutes of Health (No. 5R01AI097154 to J.H.W.) for support of this work. This work was performed at the Center for Integrated Nanotechnologies, a U.S. Department of Energy, Office of Basic Energy Sciences user facility. Collaborative efforts were also supported by Nos. P50 GM065794 and R01AI051575 (B.S.W.), the New Mexico Spatiotemporal Modeling Center (No. P50GM0852673) and NIH No. R01GM100114 (D.S.L.), and a DOE Single Investigator Small Group Research Grant No. 2009LANL1096 (J.A.H.).
REFERENCES
- 1.Saxton M. J. and Jacobson K., Annu. Rev. Biophys. Biomol. Struct. 26, 373 (1997). 10.1146/annurev.biophys.26.1.373 [DOI] [PubMed] [Google Scholar]
- 2.Kusumi A., Tsunoyama T. A., Hirosawa K. M., Kasai R. S., and Fujiwara T. K., Nat. Chem. Biol. 10, 524 (2014). 10.1038/nchembio.1558 [DOI] [PubMed] [Google Scholar]
- 3.Barak L. S. and Webb W. W., J. Cell Biol. 90, 595 (1981). 10.1083/jcb.90.3.595 [DOI] [PMC free article] [PubMed] [Google Scholar]
- 4.Berg H. C., Rev. Sci. Instrum. 42, 868 (1971). 10.1063/1.1685246 [DOI] [PubMed] [Google Scholar]
- 5.Levi V., Ruan Q., and Gratton E., Biophys. J. 88, 2919 (2005). 10.1529/biophysj.104.044230 [DOI] [PMC free article] [PubMed] [Google Scholar]
- 6.Cang H., Wong C. M., Xu C. S., Rizvi A. H., and Yang H., Appl. Phys. Lett. 88, 223901 (2006). 10.1063/1.2204652 [DOI] [Google Scholar]
- 7.McHale K., Berglund A. J., and Mabuchi H., Nano Lett. 7, 3535 (2007). 10.1021/nl0723376 [DOI] [PubMed] [Google Scholar]
- 8.Lessard G. A., Goodwin P. M., and Werner J. H., Appl. Phys. Lett. 91, 2224106 (2007). 10.1063/1.2819074 [DOI] [Google Scholar]
- 9.Kao H. P. and Verkman A. S., Biophys. J. 67, 1291 (1994). 10.1016/S0006-3495(94)80601-0 [DOI] [PMC free article] [PubMed] [Google Scholar]
- 10.Ram S., Prabhat P., Chao J., Ward E. S., and Ober R. J., Biophys. J. 95, 6025 (2008). 10.1529/biophysj.108.140392 [DOI] [PMC free article] [PubMed] [Google Scholar]
- 11.Thompson M. A., Lew M. D., Badieirostami M., and Moerner W. E., Nano Lett. 10, 211 (2010). 10.1021/nl903295p [DOI] [PMC free article] [PubMed] [Google Scholar]
- 12.Juette M. F. and Bewersdorf J., Nano Lett. 10, 4657 (2010). 10.1021/nl1028792 [DOI] [PubMed] [Google Scholar]
- 13.Chen B.-C., Legant W. R., Wang K., Shao L., Milkie D. E., Davidson M. W., Janetopoulos C., Wu X. S., Hammer J. A., Liu Z., English B. P., Mimori-Kiyosue Y., Romero D. P., Ritter A. T., Lippincott-Schwartz J., Fritz-Laylin L., Mullins R. D., Mitchell D. M., Bembenek J. N., Reymann A.-C., Böhme R., Grill S. W., Wang J. T., Seydoux G., Tulu U. S., Kiehart D. P., and Betzig E., Science 346, 1257998 (2014). 10.1126/science.1257998 [DOI] [PMC free article] [PubMed] [Google Scholar]
- 14.Shechtman Y., Weiss L. E., Backer A. S., Sahl S. J., and Moerner W. E., Nano Lett. 15, 4194 (2015). 10.1021/acs.nanolett.5b01396 [DOI] [PMC free article] [PubMed] [Google Scholar]
- 15.Cang H., Xu C. S., and Yang H., Chem. Phys. Lett. 457, 285 (2008). 10.1016/j.cplett.2008.03.098 [DOI] [Google Scholar]
- 16.Cognet L., Leduc C., and Lounis B., Curr. Opin. Chem. Biol. 20, 78 (2014). 10.1016/j.cbpa.2014.04.015 [DOI] [PubMed] [Google Scholar]
- 17.Hiramoto-Yamaki N., Tanaka K. A. K., Suzuki K. G. N., Hirosawa K. M., Miyahara M. S. H., Kalay Z., Tanaka K., Kasai R. S., Kusumi A., and Fujiwara T. K., Traffic 15, 583 (2014). 10.1111/tra.12163 [DOI] [PMC free article] [PubMed] [Google Scholar]
- 18.Dupont A. and Lamb D. C., Nanoscale 3, 4532 (2011). 10.1039/c1nr10989h [DOI] [PubMed] [Google Scholar]
- 19.Germann J. A. and Davis L. M., Opt. Express 22, 5641 (2014). 10.1364/OE.22.005641 [DOI] [PubMed] [Google Scholar]
- 20.Perillo E. P., Liu Y.-L., Huynh K., Liu C., Chou C.-K., Hung M.-C., Yeh H.-C., and Dunn A. K., Nat. Commun. 6, 7874 (2015). 10.1038/ncomms8874 [DOI] [PMC free article] [PubMed] [Google Scholar]
- 21.Wells N. P., Lessard G. A., and Werner J. H., Anal. Chem. 80, 9830 (2008). 10.1021/ac8021899 [DOI] [PMC free article] [PubMed] [Google Scholar]
- 22.Cang H., Xu C. S., Montiel D., and Yang H., Opt. Lett. 32, 2729 (2007). 10.1364/OL.32.002729 [DOI] [PubMed] [Google Scholar]
- 23.Welsher K. and Yang H., Nat. Nanotechnol. 9, 198 (2014). 10.1038/nnano.2014.12 [DOI] [PubMed] [Google Scholar]
- 24.Thompson R. E., Larson D. R., and Webb W. W., Biophys. J. 82, 2775 (2002). 10.1016/S0006-3495(02)75618-X [DOI] [PMC free article] [PubMed] [Google Scholar]
- 25.Dahan M., Laurence T., Pinaud F., Chemla D. S., Alivisatos A. P., Sauer M., and Weiss S., Opt. Lett. 26, 825 (2001). 10.1364/OL.26.000825 [DOI] [PubMed] [Google Scholar]
- 26.DeVore M. S., Stich D. G., Keller A. M., Ghosh Y., Goodwin P. M., Phipps M. E., Stewart M. H., Cleyrat C., Wilson B. S., Lidke D. S., Hollingsworth J. A., and Werner J. H., Proc. SPIE 9338, 933812 (2015). 10.1117/12.2082943 [DOI] [PMC free article] [PubMed] [Google Scholar]
- 27.Lessard G. A., Goodwin P. M., and Werner J. H., Proc. SPIE 6092, 609205 (2006). 10.1117/12.650191 [DOI] [Google Scholar]
- 28.Wells N. P., Lessard G. A., Goodwin P. M., Phipps M. E., Cutler P. J., Lidke D. S., Wilson B. S., and Werner J. H., Nano Lett. 10, 4732 (2010). 10.1021/nl103247v [DOI] [PMC free article] [PubMed] [Google Scholar]
- 29.Han J. J., Kiss C., Bradbury A. R. M., and Werner J. H., ACS Nano 6, 8922 (2012). 10.1021/nn302912j [DOI] [PubMed] [Google Scholar]
- 30.Keller A. M., Ghosh Y., DeVore M. S., Phipps M. E., Stewart M. H., Wilson B. S., Lidke D. S., Hollingsworth J. A., and Werner J. H., Adv. Funct. Mater. 24, 4796 (2014). 10.1002/adfm.201400349 [DOI] [PMC free article] [PubMed] [Google Scholar]


