

Abstract
Aims
To conduct a patient-level meta-analysis of the EDITION 1, 2 and 3 studies, which compared the efficacy and safety of new insulin glargine 300 U/ml (Gla-300) with insulin glargine 100 U/ml (Gla-100) in people with type 2 diabetes (T2DM) on basal and mealtime insulin, basal insulin and oral antihyperglycaemic drugs, or no prior insulin, respectively.
Methods
The EDITION studies were multicentre, randomized, open-label, parallel-group, phase IIIa studies, with similar designs and endpoints. A patient-level meta-analysis of the studies enabled these endpoints to be examined over 6 months in a large population with T2DM (Gla-300, n = 1247; Gla-100, n = 1249).
Results
No significant study-by-treatment interactions across studies were found, enabling them to be pooled. The mean change in glycated haemoglobin was comparable for Gla-300 and Gla-100 [each −1.02 (standard error 0.03)%; least squares (LS) mean difference 0.00 (95% confidence interval (CI) −0.08 to 0.07)%]. Annualized rates of confirmed (≤3.9 mmol/l) or severe hypoglycaemia were lower with Gla-300 than with Gla-100 during the night (31% difference in rate ratio over 6 months) and at any time (24 h, 14% difference). Consistent reductions were observed in percentage of participants with ≥1 hypoglycaemic event. Severe hypoglycaemia at any time (24 h) was rare (Gla-300: 2.3%; Gla-100: 2.6%). Weight gain was low (<1 kg) in both groups, with less gain with Gla-300 [LS mean difference −0.28 kg (95% CI −0.55 to −0.01); p = 0.039]. Both treatments were well tolerated, with similar rates of adverse events.
Conclusion
Gla-300 provides comparable glycaemic control to Gla-100 in a large population with a broad clinical spectrum of T2DM, with consistently less hypoglycaemia at any time of day and less nocturnal hypoglycaemia.
Keywords: basal insulin, insulin glargine, insulin therapy
Introduction
Type 2 diabetes (T2DM) is a complex, heterogeneous disorder 1. The requirement to initiate insulin therapy in people with T2DM depends on behavioural and disease characteristics, e.g. individual lifestyle and disease stage 2. Initially, people with T2DM often achieve glycaemic control without insulin, by making lifestyle changes or by taking one or more oral antihyperglycaemic drugs; however, as the disease progresses, exogenous insulin therapy is required in many patients. Often basal insulin therapy alone is the preferred initial insulin regimen, because it has a lower risk for inducing hypoglycaemia and causes less weight gain compared with premixed insulin or multiple daily injection therapy (basal plus bolus therapy) 3. In advanced disease stages, additional therapy (e.g. with rapid-acting insulin or glucagon-like peptide-1 receptor agonists) may be needed in order to effectively manage disease 2. A basal insulin should therefore be effective across a wide spectrum of disease stages, from insulin-naïve people to those receiving combination therapy, with minimal disruption to daily life.
The clinical development programme for new insulin glargine 300 U/ml (Gla-300) covers a broad range of T2DM disease stages. Three phase IIIa studies compared the efficacy and safety of Gla-300 with insulin glargine 100 U/ml (Gla-100) in differing populations of people with T2DM 4–6. Two of these studies enrolled high basal insulin users; the first, EDITION 1, included participants with T2DM not adequately controlled with basal and mealtime insulin 4, while EDITION 2 included participants who had previously received basal insulin in combination with oral antihyperglycaemic drugs 5. In EDITION 3, participants were insulin-naïve, and had received only oral antihyperglycaemic drugs 6. The results of these three studies showed that Gla-300 and Gla-100 provided comparable glycaemic control, along with a lower risk of hypoglycaemia with Gla-300, over 6 months of treatment 4–6. This is attributed to the more constant and prolonged pharmacokinetic and pharmacodynamic profile of Gla-300 compared with Gla-100 7.
While the clinical characteristics of Gla-300 have been described in the individual EDITION studies, it is important to investigate whether these results are robust in a T2DM population with a broader clinical spectrum, more closely reflecting the patient spectrum in clinical practice. Similarities between study endpoints and study designs for the three EDITION studies have enabled a patient-level meta-analysis to be carried out. The prespecified analysis included the EDITION 2 and EDITION 3 studies only, but consistent design and results allowed the pooling of all three studies, comprising a pooled population of almost 2500 people. In the present paper, the results of the patient-level meta-analysis of the three studies in T2DM are reported, including measures of glycaemic control, hypoglycaemia and body weight over 6 months. The prespecified pooled analysis of the EDITION 2 and EDITION 3 studies only is also reported to demonstrate consistency.
Research Design and Methods
Study Design and Participants
The prespecified pooled analysis included participants from EDITION 2 and EDITION 3 only, because treatment with rapid-acting insulin in EDITION 1 may have confounded specificity of the results for basal insulin treatment; however, the consistent study results suggested that a pooled analysis should include all three studies. Therefore an additional post-trial pooled analysis that also included participants from EDITION 1 was performed. Data from both pooled analyses are reported.
EDITION 1, 2 and 3 were multicentre, randomized, open-label, two-arm, parallel-group, phase IIIa studies (NCT01499082, NCT01499095, NCT01676220) that have been described previously 4–6. Protocols for all three studies were approved by the appropriate ethics committees and the studies were conducted according to Good Clinical Practice and the Declaration of Helsinki. All participants provided written, informed consent. The studies all included a 2-week screening phase, a 6-month treatment period and a 6-month safety extension period; data from the first 6-month treatment period are reported here. All participants were ≥18 years of age with a diagnosis of T2DM (according to WHO criteria) 8.
Inclusion/exclusion criteria have been previously published 4–6; key criteria are shown in Table S1. In summary, in EDITION 1, inclusion criteria included current basal therapy with ≥42 U/day of either Gla-100 or neutral protamine Hagedorn (NPH) insulin, together with prandial insulin therapy, with or without metformin, for at least 1 year. In EDITION 2, inclusion criteria included at least 6 months on basal insulin treatment (recent use within last 4 weeks of ≥42 U/day of either Gla-100 or NPH insulin in combination with oral antihyperglycaemic drugs). In EDITION 3, participants were required to have used oral antihyperglycaemic drugs for at least 6 months before screening and were insulin-naïve. Exclusion criteria included glycated haemoglobin (HbA1c) <7.0% for all three studies, HbA1c >10.0% for EDITION 1 and 2, and >11.0% for EDITION 3.
Treatment
Participants in all studies were randomized (1 : 1) to receive once-daily subcutaneous injections of either Gla-300 (Sanofi, Paris, France; using a modified SoloSTAR® pen-injector in EDITION 1 and 2, and a modified Tactipen® injector in EDITION 3) or Gla-100 [Lantus® (Sanofi) using a SoloSTAR® pen]. The accuracy of the modified version of the SoloSTAR® device was adequate for use with Gla-300 at doses above 39 U. The modified Tactipen® used in EDITION 3 allowed smaller increment steps (1.5 U) compared with the modified SoloSTAR® pen (3 U), to enable dosing for an insulin-naïve population with a wide range of insulin requirements. All participants were titrated to a fasting self-monitored plasma glucose (SMPG) target of 4.4–5.6 mmol/l (80–100 mg/dl).
Endpoints of Patient-level Meta-analysis
Both pooled analyses were carried out for the following efficacy endpoints: change in HbA1c from baseline to month 6; proportion of participants with HbA1c <7.0% (<53 mmol/mol) at month 6; change in average pre-injection SMPG from baseline to month 6; and change in laboratory-measured fasting plasma glucose from baseline to month 6.
Prespecified safety and tolerability endpoints included percentages of participants having at least one nocturnal (00:00–05:59 hours) hypoglycaemic event or hypoglycaemic event at any time of day (24 h) and annualized rates (events per participant-year), by study period, and the cumulative mean number of hypoglycaemic events per participant. The prespecified definition of the nocturnal window (00:00–05:59 hours) was chosen to exclude potential confounders relating to daytime activities and meal intake. All hypoglycaemic events were categorized according to the American Diabetes Association definitions 9: (i) severe hypoglycaemia (an event requiring the assistance of another person to actively administer carbohydrate, glucagon or other resuscitative actions); (ii) documented symptomatic hypoglycaemia [an event during which typical symptoms of hypoglycaemia are confirmed by a measured plasma glucose concentration of ≤3.9 mmol/l (≤70 mg/dl)]; (iii) and asymptomatic hypoglycaemia confirmed by a measured plasma glucose concentration of ≤3.9 mmol/l (≤70 mg/dl). For the main analysis of hypoglycaemic outcomes, the confirmed (with or without symptoms) and severe categories were combined.
The pooled analysis of EDITION 1, 2 and 3 also evaluated insulin dose, variability of pre-injection SMPG, change in body weight and adverse events.
Data Analysis and Statistics
Methods were consistent with those of the EDITION studies and have been reported previously 3–5. Change in HbA1c, and all other efficacy measures except insulin dose, was analysed using a mixed model for repeated measurements (MMRM). Insulin dose was measured descriptively. The percentage of participants reporting ≥1 hypoglycaemic event was analysed using the Cochran–Mantel–Haenszel method. The annualized rate of hypoglycaemia (events per participant-year) was analysed using an overdispersed Poisson regression model. Cumulative mean number of hypoglycaemic events by participant was analysed using Nelson–Aelen estimates. The percentage of participants with ≥1 event and the annualized rates of hypoglycaemia were also examined by age subgroup (>65 years of age vs ≤65 years of age); subgroup-by-treatment interaction was calculated based on a logistic model with subgroup, treatment, randomization strata of screening HbA1c (<8.0 and ≥8.0%) and the interaction subgroup-by-treatment as fixed effects. Body weight was assessed using an analysis of covariance (ancova) model, from baseline to last on-treatment value. Adverse events were analysed descriptively. For each endpoint, homogeneity of treatment effect across all three studies was assessed.
Efficacy endpoints used the modified intention-to-treat (mITT) population, defined as all randomized participants who received at least one dose of study drug and had both a baseline and ≥1 post-baseline assessment. If a participant discontinued treatment prematurely, or for all participants rescued during the 6-month on-treatment period (EDITION 2 and 3 only), time windows were applied to retrieve assessments performed at premature end-of-treatment and pre-rescue visits for the MMRM analyses. The safety population included all participants randomized and exposed to ≥1 dose of study drug.
Results
Study Population
Of the 2496 participants included in the pooled analysis of all three EDITION T2DM studies, 1247 were randomized to Gla-300 and 1249 were randomized to Gla-100. The mITT population included 1239 and 1235 participants receiving Gla-300 and Gla-100, respectively. Baseline characteristics from the individual study populations and the pooled analysis population (all three studies) are shown in Table1. Baseline characteristics of the EDITION 2 and EDITION 3 pool are reported in Table S2.
Table 1.
Summary of baseline characteristics for individual studies and pooled analysis of all three studies (randomized population)
| Patient-level meta-analysis | EDITION 1 | EDITION 2 | EDITION 3 | |||||
|---|---|---|---|---|---|---|---|---|
| Gla-300 (n = 1247) | Gla-100 (n = 1249) | Gla-300 (n = 404) | Gla-100 (n = 403) | Gla-300 (n = 404) | Gla-100 (n = 407) | Gla-300 (n = 439) | Gla-100 (n = 439) | |
| Age, years | 58.7 (9.3) | 58.5 (9.5) | 60.1 (8.5) | 59.8 (8.7) | 57.9 (9.1) | 58.5 (9.2) | 58.2 (9.9) | 57.2 (10.3) |
| Gender: male, n (%) | 657 (52.7) | 649 (52.0) | 217 (53.7) | 210 (52.1) | 187 (46.3) | 185 (45.5) | 253 (57.6) | 254 (57.9) |
| Body weight, kg | 99.9 (22.8) | 99.9 (21.7) | 106.2 (21.5) | 106.4 (20.0) | 98.7 (22.3) | 98.0 (20.8) | 95.1 (23.3) | 95.6 (22.6) |
| BMI, kg/m2 | 34.7 (6.9) | 34.8 (6.4) | 36.6 (6.8) | 36.6 (6.1) | 34.8 (6.6) | 34.8 (6.1) | 32.8 (6.9) | 33.2 (6.6) |
| Duration of diabetes, years | 12.7 (7.2) | 12.6 (7.5) | 15.6 (7.2) | 16.1 (7.8) | 12.7 (7.1) | 12.5 (7.0) | 10.1 (6.5) | 9.6 (6.2) |
| Duration of basal insulin treatment, years | 5.24 (4.51)* | 5.15 (4.33)* | 6.7 (4.7) | 6.5 (4.8) | 3.78 (3.73) | 3.83 (3.34) | N/A | N/A |
| Prior use of insulin glargine, n (%) | 677 (54.3) | 707 (56.6) | 373 (92.3) | 369 (91.6) | 304 (75.2) | 337 (82.8) | N/A | N/A |
| Prior use of biguanides, n (%) | 1010 (81.0) | 1022 (81.8) | 227 (56.2) | 236 (58.6) | 388 (96.0) | 383 (94.1) | 394 (90.6) | 402 (92.0) |
| Prior use of sulphonylureas | 276 (22.1) | 269 (21.5) | 1 (0.2) | 0 | 18 (4.5) | 12 (2.9) | 257 (59.1) | 256 (58.6) |
| Prior use of DPP-4 inhibitors | 123 (9.9) | 149 (11.9) | 0 | 0 | 33 (8.2) | 51 (12.5) | 90 (20.7) | 98 (22.4) |
| Prior use of GLP-1 agonists | 0 | 2 (0.2) | 0 | 0 | 0 | 3 (0.7) | 0 | 2 (0.5) |
| HbA1c, mmol/mol | 67.3 (10.1) | 67.4 (9.9) | 65.6 (8.5) | 65.7 (8.4) | 66.8 (9.4) | 66.3 (8.4) | 69.5 (11.4) | 70.1 (11.7) |
| HbA1c, % | 8.31 (0.92) | 8.32 (0.91) | 8.15 (0.78) | 8.16 (0.77) | 8.26 (0.86) | 8.22 (0.77) | 8.51 (1.04) | 8.57 (1.07) |
Values are mean (s.d.) unless otherwise stated. BMI, body mass index; DPP-4, dipeptidyl peptidase-4; GLP-1, glucagon-like peptide-1; mITT, modified intention-to-treat; s.d., standard deviation.
Excludes participants from EDITION 3 (insulin-naïve).
Homogeneity of Treatment Effect
The study-by-treatment interaction for each endpoint was found to be non-significant.
Glycaemic Control
In the pooled dataset of all three studies, the mean decrease in HbA1c level was similar in the two treatment groups (Figure 1A). The least squares (LS) mean [standard error (s.e.)] change in HbA1c from baseline to month 6 was comparable for Gla-300 and Gla-100 [each −1.02 (0.03)%; LS mean difference 0.00, 95% confidence interval (CI) −0.08 to 0.07%]. The proportion of participants who reached target HbA1c after 6 months of treatment was similar in both treatment groups; 449 participants (36.2%) on Gla-300 and 438 participants (35.5%) on Gla-100 attained an HbA1c target of <7.0%.
Figure 1.

(A) Glycated haemoglobin (HbA1c), (B) Laboratory-measured fasting plasma glucose (FPG), (C) Insulin dose [modified intention-to-treat (mITT) population and (D) body weight (safety population) by visit during the 6-month treatment period for pooled analysis of all three studies. Gla-100, insulin glargine 100 U/ml; Gla-300, insulin glargine 300 U/ml; LS, least squares; BL, baseline; M, month; s.e, standard error; W, week. LOV, last on-treatment value defined as the last measurement made prior to or on the day of the last investigational product intake during the main 6-month on-treatment period.
Laboratory-measured fasting plasma glucose decreased in both groups (Figure 1B); LS mean (s.e.) change at month 6 was −2.04 (0.07) mmol/l with Gla-300 and −2.26 (0.07) mmol/l with Gla-100 (LS mean difference 0.21, 95% CI 0.03–0.40 mmol/l). Average pre-injection SMPG also decreased in both treatment groups, and reductions from baseline to month 6 were similar for Gla-300 and Gla-100 [LS mean (s.e.) change −1.43 (0.08) and −1.34 (0.08) mmol/l; LS mean difference −0.09, 95% CI −0.31 to 0.14 mmol/l]. There was also no between-treatment difference in the variability of pre-injection SMPG at month 6; LS mean (s.e.) at month 6 was 20.0 (0.32)% with Gla-300 and 20.0 (0.33)% with Gla-100 (LS mean difference 0.02%, 95% CI −0.89 to 0.93).
Similar results for glycaemic control were observed in the pooled dataset of EDITION 2 and EDITION 3 (Table S3).
Hypoglycaemia
In the pooled analysis of EDITION 1, 2 and 3, over the 6-month treatment period, the cumulative number of confirmed [≤3.9 mmol/l (≤70 mg/dl)] or severe hypoglycaemic events per participant was lower with Gla-300 compared with Gla-100 at any time of day (24 h; Figure 2A). The annualized rate (events per participant-year) of confirmed [≤3.9 mmol/l (≤70 mg/dl)] or severe hypoglycaemia at any time of day (24 h) over the 6-month study period was 15.22 with Gla-300 and 17.73 with Gla-100 (rate ratio 0.86, 95% CI 0.77–0.97; p = 0.0116), corresponding to a relative difference of 14% in favour of Gla-300.
Figure 2.
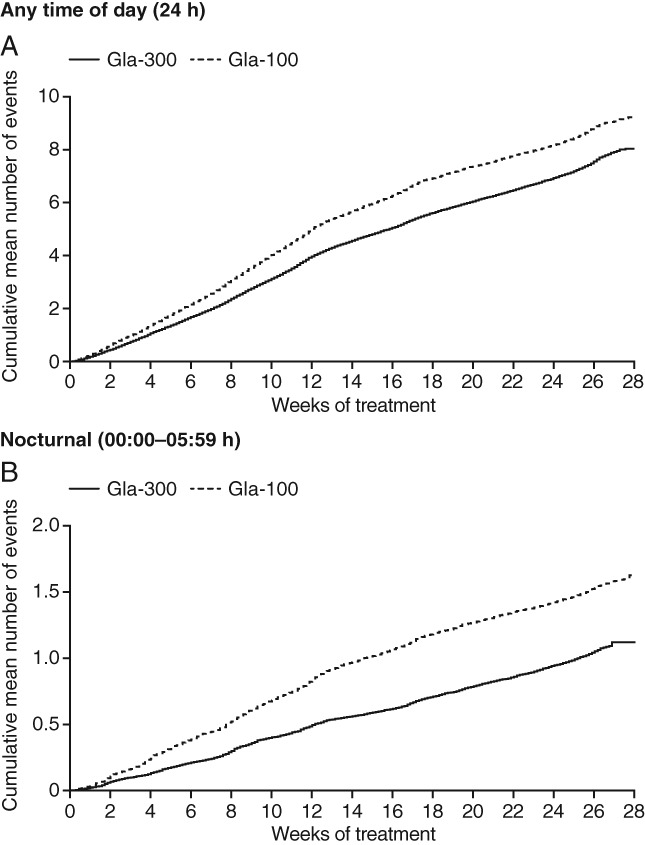
Cumulative mean number of confirmed [≤3.9 mmol/l (≤70 mg/dl)] or severe hypoglycaemic events (A) at any time of day (24 h) and (B) during the night (00:00–05:59 hours) for pooled analysis of all three studies (safety population). Gla-100, insulin glargine 100 U/ml; Gla-300, insulin glargine 300 U/ml.
The cumulative mean number of nocturnal confirmed [≤3.9 mmol/l (≤70 mg/dl)] or severe hypoglycaemic events was lower with Gla-300 than Gla-100 (Figure 2B). Similarly, annualized rates of nocturnal events over the 6-month study period were lower with Gla-300 (2.10 vs 3.06, rate ratio 0.69, 95% CI 0.57–0.84; p = 0.0002), showing a relative difference in rate of 31% in favour of Gla-300.
When analysed by study period, the reduction in annualized rate with Gla-300 compared with Gla-100 was even apparent during the first 8 weeks of treatment, as well as during the maintenance period (week 9 to month 6; Figure 3A, B).
Figure 3.

Annualized rates and percentage of participants with ≥1 hypoglycaemic event (A) at any time of day (24 h) and (B) during the night (00:00–05:59 hours) for pooled analysis of all three studies (safety population). Gla-100, insulin glargine 100 U/ml; Gla-300, insulin glargine 300 U/ml; CI, confidence interval; BL, baseline; W, week; M, month.
The distribution of annualized rates of confirmed [≤3.9 mmol/l (≤70 mg/dl)] or severe hypoglycaemic events over 24 h is reported in Figure 4. A lower rate of hypoglycaemia was shown during the night and beyond the predefined nocturnal period (00:00–05:59 hours) with Gla-300 compared with Gla-100. Events were most frequently reported between 06:00 and 14:00 hours [4777 (8.14 events per participant-year) in the Gla-300 group and 5925 (10.13 events per participant-year) in the Gla-100 group, corresponding to a reduction of 20% in favour of Gla-300], and particularly between 06:00 and 10:00 hours.
Figure 4.
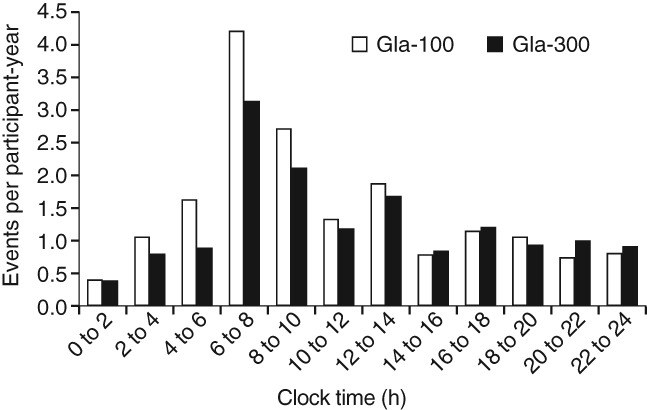
Annualized rates (events per participant-year) of confirmed [≤3.9 mmol/l (≤70 mg/dl)] or severe hypoglycaemia during 6 months of treatment by time of the day for pooled analysis of all three studies (safety population). Gla-100, insulin glargine 100 U/ml; Gla-300, insulin glargine 300 U/ml.
Reductions in the percentage of participants experiencing ≥1 confirmed [≤3.9 mmol/l (≤70 mg/dl)] or severe hypoglycaemic event at any time of day (24 h) and during the night with Gla-300 compared with Gla-100 were consistent with the annualized rates (Figure 3A, B). The number of participants who would need to be treated with Gla-300 in order to prevent 1 participant having a confirmed [≤3.9 mmol/l (≤70 mg/dl)] or severe hypoglycaemic event compared with treatment with Gla-100 was 16.
Rates and percentages of participants with confirmed [≤3.9 mmol/l (≤70 mg/dl)] or severe hypoglycaemic events were comparable between those ≥65 years of age and those <65 years and no significant heterogeneity of treatment effect was observed (all p > 0.05).
Consistent results for confirmed [≤3.9 mmol/l (≤70 mg/dl)] or severe hypoglycaemia were observed in the pooled analysis of the EDITION 2 and EDITION 3 studies (Figures S1 and S2).
Other Categories of Hypoglycaemia
Over the 6-month treatment period, the annualized rate of documented [≤3.9 mmol/l (≤70 mg/dl)] symptomatic hypoglycaemic events was lower for Gla-300 compared with Gla-100, both at any time of day (24 h; Figure 3A) and during the night (Figure 3B). A consistently lower percentage of participants reported ≥1 documented [≤3.9 mmol/l (≤70 mg/dl)] symptomatic hypoglycaemic event with Gla-300 versus Gla-100 (Figure 3A, B).
Similar results were observed in the EDITION 2 and 3 pooled analysis (Figures S1 and S2). Consistent reductions were shown with Gla-300 compared with Gla-100 for both confirmed or severe and documented symptomatic hypoglycaemia when the stricter threshold of <54 mg/dl (<3.0 mmol/l) was applied (Table S4).
Severe Hypoglycaemia
Severe hypoglycaemia was rare in both treatment groups. In the pooled analysis of all three studies, the number of participants with ≥1 event at any time of day (24 h) was 28 (2.3%) with Gla-300 and 33 (2.6%) with Gla-100 (relative risk 0.85, 95% CI 0.52–1.39); there were 0.11 events per participant-year in both groups (rate ratio 0.98, 95% CI 0.51–1.86; Table S4).
Insulin Dose
Basal insulin dose increased in both treatment groups over the 6-month study period (Figure 1C). The mean (standard deviation) basal insulin dose at month 6 was 0.85 (0.36) U/kg/day with Gla-300 and 0.76 (0.32) U/kg/day with Gla-100, representing a 12% higher dose with Gla-300.
Body Weight
There was a slight weight gain with Gla-300 and Gla-100 [LS mean (s.e.) change 0.51 (0.10) and 0.79 (0.10) kg, respectively, in the pooled analysis of EDITION 1, 2 and 3], but with less weight gain in Gla-300 treated participants (LS mean difference −0.28, 95% CI −0.55 to −0.01; p = 0.039; Figure 1D).
Adverse Events
No between-treatment differences in safety profile were identified, with similar rates of adverse events reported across all three studies. Treatment-emergent adverse events (TEAEs) were reported by 712 (57.3%) participants in the Gla-300 group and 669 (53.7%) participants in the Gla-100 group. The most common TEAEs were infections and infestations, nervous system disorders, gastrointestinal disorders, musculoskeletal and connective tissue disorders, and general disorders and administration site conditions.
Injection site reactions were reported for 30 (2.4%) participants in the Gla-300 group and 39 (3.1%) participants in the Gla-100 group. Serious TEAEs were reported by 65 (5.2%) and 62 (5.0%) participants in the Gla-300 and Gla-100 groups, respectively (Table S5). Overall, 17 (1.4%) and 16 participants (1.3%) discontinued treatment because of a TEAE in the Gla-300 and Gla-100 groups, respectively, while 4 participants (0.3%) in the Gla-300 group and 3 (0.2%) in the Gla-100 had a TEAE leading to death. No deaths were considered related to study medication. Anti-insulin antibody findings were similar between treatment groups and across the three studies.
Discussion
In this large, broad population of participants with T2DM, Gla-300 was shown to be as effective as Gla-100 in improving glycaemic control over 6 months. In addition, Gla-300 resulted in a reduction in hypoglycaemic events at any time of day (24 h), as well as during the night, and slightly lower weight gain compared with Gla-100. Results were consistent in the prespecified pooled analysis where participants from the EDITION 1 study using rapid-acting insulin analogues were excluded. These findings were made possible through the similar study designs of the three phase IIIa EDITION studies 4–6, and confirm the consistency of the findings across these individual studies, which also showed comparable glycaemic control and a lower risk of hypoglycaemia with Gla-300 compared with Gla-100.
In the overall pooled analysis, the relative difference in rate of confirmed [≤3.9 mmol/l (≤70 mg/dl)] or severe hypoglycaemia at any time of day (24 h) in favour of Gla-300 was 14% over the entire 6 months of treatment. The corresponding difference was 5% in EDITION 1 (probably as a result of the use of rapid-acting insulin analogues) 4, but was higher for EDITION 2 and 3 (23 and 25%) 5,6, suggesting that the pooled analysis results were mainly driven by the size of the reductions observed in EDITION 2 and EDITION 3 for that period. The reductions in risk of participants experiencing ≥1 hypoglycaemic event seen in the pooled analysis were consistent with the annualized rates, although the contribution of each individual study to these findings appeared to be similar (relative risk reductions of 7, 10 and 12% were seen in EDITION 1, 2 and 3, respectively, over the 6-month treatment period) 4–6.
Even greater relative differences in annualized rate of confirmed or severe hypoglycaemia in favour of Gla-300 were observed during the night (31% during the entire 6 months of treatment). Corresponding differences for the 6-month period were 25, 48 and 2% in EDITION 1, 2 and 3, respectively, suggesting that the reduction seen in the pooled analysis was mainly driven by the findings of EDITION 1 and 2. Again, percentages of participants experiencing ≥1 hypoglycaemic event during the night were consistent with the annualized rates, and were supported by all three of the individual studies (reductions of 22, 29 and 24% over the 6-month treatment period, for EDITION 1, 2 and 3, respectively) 4–6.
In the pooled analysis of all three studies, reductions in annualized rate even occurred during the first 8 weeks of the study, when most of the insulin dose increase took place (relative reductions of 23% in the first 8 weeks and 9% in the maintenance period for anytime hypoglycaemia and 42% in the first 8 weeks compared with 25% in the maintenance period for nocturnal hypoglycaemia). Concern over hypoglycaemia is often a barrier to effective dose adjustment 10–12. The lower risk of hypoglycaemia during the titration period with Gla-300 could therefore afford a smoother start to the therapy and lead to improved confidence in increasing the dose for both physicians and people with diabetes, allowing optimum doses to be reached sooner.
The variations seen between the individual EDITION studies reflect the differences in the populations studied; for example, participants in EDITION 3 had fewer characteristics that are predictive of hypoglycaemia 13, compared with EDITION 1 and 2, as they were insulin-naïve, probably retaining greater endogenous insulin secretion, and with a shorter diabetes duration 4–6. Despite these variations, the benefits of Gla-300 over Gla-100 are clearly apparent in the large pooled analysis population representing a broad spectrum of T2DM disease stages. These findings suggest that the benefits of Gla-300 observed in higher basal insulin users in EDITION 1 and 2 are translatable to people with less advanced disease.
Over the course of 24 h, the period during which the most confirmed [≤3.9 mmol/l (≤70 mg/dl)] or severe hypoglycaemic events were reported was between 06:00 and 08:00 hours, with fewer events for Gla-300 compared with Gla-100, showing that the benefits of Gla-300 over Gla-100 extend beyond the predefined ‘nocturnal’ period (00:00–05:59 hours). Indeed, a difference in favour of Gla-300 was apparent up to 14:00 hours. Daytime hypoglycaemia interferes with daily activities such as working, attending school or driving, which causes serious social disruptions for people with diabetes 14. The reduction in hypoglycaemia seen with Gla-300 during the morning and early afternoon may therefore help to lessen the impact of diabetes on daily activities. This effect may be attributable to the more stable and prolonged pharmacokinetic and pharmacodynamic profiles of Gla-300 compared with Gla-100 7, which suggests potential for more people to achieve good glycaemic control with once-daily injection. Once-daily administration coupled with a reduced rate of hypoglycaemia may help to reduce the burden of diabetes disease management, improving adherence to insulin regimens and increasing treatment persistence 11. This could ultimately improve long-term blood glucose control for those people with diabetes who are failing to achieve glycaemic targets with current treatment options.
Severe hypoglycaemia was rare in both treatment groups in the pooled population of all three EDITION studies. The annualized rates of 0.11 events per participant-year are similar to those reported in observational studies in T2DM 15,16, which range from 0.1 to 0.2 events per participant-year.
Reductions in the rate of hypoglycaemia compared with Gla-100 have also been reported with other longer-acting basal insulins. In a meta-analysis of five studies in T2DM, of 26–52 weeks’ duration, differences in annualized rate ratios of confirmed hypoglycaemia in favour of insulin degludec compared with Gla-100 were reported, both at any time (17%) and during the night (32%) 17. Although these are consistent with the 14 and 31% reductions seen for confirmed (≤3.9 mmol/l) or severe hypoglycaemia in the present analysis, it should be noted that in the insulin degludec studies, confirmed hypoglycaemia was defined as episodes confirmed by a plasma glucose of <3.1 mmol/l (<56 mg/dl), or severe hypoglycaemia. Additionally, participants were titrated to a different glycaemic target [4.0 to <5.0 mmol/l (>70 to <90 mg/dl)] compared with the EDITION studies, and the study populations and characteristics of the participants were also different. Finally, other measures of hypoglycaemia, such as percentage of participants with one or more event, are not reported for the insulin degludec pooled analysis. These differences make it difficult to draw comparisons between these two meta-analyses, or with pooled analyses for other insulins such as Gla-100 18, for which the data reported also differ from the present analysis.
Basal insulin dose increased in both treatment groups over the 6-month study period, particularly in the first 12 weeks of treatment. The basal insulin dose in the Gla-300 group at 6 months was 12% greater than in the Gla-100 group, a finding that has been consistently observed in all three EDITION studies. The cause of the difference in insulin dosage is currently speculative. Metabolite M1 is the main active molecule circulating after injection of both Gla-300 and Gla-100 19; however, an effect at the subcutaneous depot seems likely. It is possible that a longer residence time for Gla-300 in the subcutaneous space (consistent with the more stable and prolonged pharmacokinetic and pharmacodynamic profiles of Gla-300 vs Gla-100 7) might lead to an increase of enzymatic inactivation by tissue peptidases at the injection site. This observation suggests a somewhat lower bioavailability of Gla-300 compared with Gla-100.
Despite the higher dose of Gla-300 versus Gla-100, comparable glycaemic control was achieved with less hypoglycaemia. Along with these benefits in hypoglycaemia, participants who received Gla-300 had less weight gain compared with those who received Gla-100. The reason for this is unknown, and further analyses are warranted.
While the benefits of Gla-300 over Gla-100 have been demonstrated in the individual EDITION studies, there was some variation in baseline characteristics between the populations, which could be considered a limitation of this pooled analysis; however, the size of the population increases the validity of the results, and overcomes in part a limitation of the individual EDITION studies – the generalizability of the results to other populations with T2DM, as the characteristics of the population have been broadened by pooling. Other populations, such as different ethnic groups, still need to be considered. The pooled analysis is also strengthened by the similarities between the EDITION studies in terms of design. Limitations of the design for these studies include the open-label nature of the treatment and the short duration. Additionally, the pooled analysis of all three studies was not pre-planned; however, the results are supported by the prespecified analysis of the EDITION 2 and 3 studies only. The subgroup analyses by age group are post hoc and should be interpreted with caution.
In conclusion, Gla-300, in a broad population of almost 2500 people with T2DM, provides comparable glycaemic control to that provided by Gla-100, with less hypoglycaemia at any time of day (24 h), and a more pronounced reduction in hypoglycaemia during the night, and during the first 8 weeks.
Acknowledgments
This study was sponsored by Sanofi. The authors thank the study participants, trial staff, and investigators for their participation. The authors would also like to thank Cassandra Pessina (Sanofi) for critical review of the manuscript, and for assistance with management of the manuscript development. Editorial and writing assistance was provided by Rachel Wright of Fishawack Communications Ltd and was funded by Sanofi.
Conflict of Interest
R. Ritzel is a consultant for Sanofi, Novo Nordisk, Merck (MSD) and Eli Lilly, and has served on the Speaker’s bureau for Sanofi, Novo Nordisk, Novartis, Eli Lilly, Merck (MSD), Bristol-Myers Squibb and AstraZeneca. R. Roussel is on the advisory panel for Sanofi and Jannsen, is a board member of the AstraZeneca/Bristol-Myers Squibb Alliance, has received research support from Sanofi, and has served on the Speaker’s bureau for Merck (MSD), Novartis, Jannsen and Sanofi. G. B. Bolli has received honoraria for advising and lecturing from Eli Lilly, Novartis and Sanofi. L. Vinet is a consultant for Sanofi. C. Brulle-Wohlhueter and S. Glezer are employees of Sanofi. H. Yki-Järvinen has received honoraria for speaking from Eli Lilly, Boehringer Ingelheim, Sanofi and Merck (MSD).
Sanofi was the sponsor of the study, and was responsible for the design and coordination of the trial. Sanofi monitored the clinical sites and collected and managed the data. All authors participated in the development of the analysis plan and interpretation of the results, and in writing, reviewing and editing the manuscript. Statistical analyses were performed by L. V. and Emmanuelle Boelle (Sanofi).
Supporting Information
Figure S1. Annualized rates and percentage of participants with ≥1 hypoglycaemic event at any time of day (24 h) for pooled analysis of EDITION 2 and EDITION 3 only (safety population).
Figure S2. Annualized rates and percentage of participants with ≥1 nocturnal (00:00–05:59 hours) hypoglycaemic event for pooled analysis of EDITION 2 and EDITION 3 only (safety population).
Table S1. Key inclusion and exclusion criteria.
Table S2. Summary of baseline characteristics in the EDITION 2 and EDITION 3 pooled analysis (safety population).
Table S3. EDITION 2 and EDITION 3 pooled analysis: summary of efficacy results (modified intention-to-treat population).
Table S4. Other definitions of hypoglycaemia: events at any time of day (24 h) and during the night (00:00–05:59 hours) from baseline to month 6 for pooled analysis of all three studies (safety population).
Table S5. Summary of serious treatment-emergent adverse events for pooled analysis of all three studies (safety population).
References
- Polonsky KS. The past 200 years in diabetes. N Engl J Med. 2012;367:1332–1340. doi: 10.1056/NEJMra1110560. [DOI] [PubMed] [Google Scholar]
- Inzucchi SE, Bergenstal RM, Buse JB, et al. Management of hyperglycemia in type 2 diabetes: a patient-centered approach: position statement of the American Diabetes Association (ADA) and the European Association for the Study of Diabetes (EASD) Diabetes Care. 2012;35:1364–1379. doi: 10.2337/dc12-0413. [DOI] [PMC free article] [PubMed] [Google Scholar]
- Holman RR, Farmer AJ, Davies MJ, et al. Three-year efficacy of complex insulin regimens in type 2 diabetes. N Engl J Med. 2009;361:1736–1747. doi: 10.1056/NEJMoa0905479. [DOI] [PubMed] [Google Scholar]
- Riddle MC, Bolli GB, Ziemen M, Muehlen-Bartmer I, Bizet F, Home PD. New insulin glargine 300 units/mL versus glargine 100 units/mL in people with type 2 diabetes using basal and mealtime insulin: glucose control and hypoglycemia in a 6-month randomized controlled trial (EDITION 1) Diabetes Care. 2014;37:2755–2762. doi: 10.2337/dc14-0991. [DOI] [PubMed] [Google Scholar]
- Yki-Jarvinen H, Bergenstal R, Ziemen M, et al. New insulin glargine 300 units/mL versus glargine 100 units/mL in people with type 2 diabetes using oral agents and basal insulin: glucose control and hypoglycemia in a 6-month randomized controlled trial (EDITION 2) Diabetes Care. 2014;37:3235–3243. doi: 10.2337/dc14-0990. [DOI] [PubMed] [Google Scholar]
- Bolli GB, Riddle MC, Bergenstal RM, et al. New insulin glargine 300 U/ml compared with glargine 100 U/ml in insulin-naive people with type 2 diabetes on oral glucose-lowering drugs: a randomized controlled trial (EDITION 3) Diabetes Obes Metab. 2015;17:386–394. doi: 10.1111/dom.12438. [DOI] [PMC free article] [PubMed] [Google Scholar]
- Becker RH, Dahmen R, Bergmann K, Lehmann A, Jax T, Heise T. New insulin glargine 300 units.mL-1 provides a more even activity profile and prolonged glycemic control at steady state compared with insulin glargine 100 units.mL-1. Diabetes Care. 2015;38:637–643. doi: 10.2337/dc14-0006. [DOI] [PubMed] [Google Scholar]
- WHO. Definition, Diagnosis and Classification of Diabetes Mellitus and its Complications: Report of a WHO Consultation. Part 1: Diagnosis and Classification of Diabetes Mellitus. Geneva: World Health Organization; 1999. [Google Scholar]
- American Diabetes Association. Defining and reporting hypoglycemia in diabetes: a report from the American Diabetes Association Workgroup on Hypoglycemia. Diabetes Care. 2005;28:1245–1249. doi: 10.2337/diacare.28.5.1245. [DOI] [PubMed] [Google Scholar]
- Davies M. The reality of glycemic control in insulin treated diabetes: defining the clinical challenges. Int J Obes Relat Metab Disord. 2004;28(Suppl. 2):S14–22. doi: 10.1038/sj.ijo.0802745. [DOI] [PubMed] [Google Scholar]
- Peyrot M, Barnett AH, Meneghini LF, Schumm-Draeger PM. Insulin adherence behaviours and barriers in the multinational Global Attitudes of Patients and Physicians in Insulin Therapy study. Diabet Med. 2012;29:682–689. doi: 10.1111/j.1464-5491.2012.03605.x. [DOI] [PMC free article] [PubMed] [Google Scholar]
- Leiter LA, Yale J-F, Chiasson J-L, Harris S, Kleinstiver P, Sauriol L. Assessment of the impact of fear of hypoglycemic episodes on glycemic and hypoglycemia management. Can J Diabetes. 2005;29:186–192. [Google Scholar]
- Tschope D, Bramlage P, Binz C, Krekler M, Deeg E, Gitt A. Incidence and predictors of hypoglycaemia in type 2 diabetes – an analysis of the prospective DiaRegis registry. BMC Endocr Disord. 2012;12:23. doi: 10.1186/1472-6823-12-23. [DOI] [PMC free article] [PubMed] [Google Scholar]
- Hopkins D. Exercise-induced and other daytime hypoglycemic events in patients with diabetes: prevention and treatment. Diabetes Res Clin Pract. 2004;65:S35–39. doi: 10.1016/j.diabres.2004.07.009. (Suppl. 1) [DOI] [PubMed] [Google Scholar]
- Leese GP, Wang J, Broomhall J, et al. Frequency of severe hypoglycemia requiring emergency treatment in type 1 and type 2 diabetes: a population-based study of health service resource use. Diabetes Care. 2003;26:1176–1180. doi: 10.2337/diacare.26.4.1176. [DOI] [PubMed] [Google Scholar]
- UK Hypoglycaemia Study Group. Risk of hypoglycaemia in types 1 and 2 diabetes: effects of treatment modalities and their duration. Diabetologia. 2007;50:1140–1147. doi: 10.1007/s00125-007-0599-y. [DOI] [PubMed] [Google Scholar]
- Ratner RE, Gough SC, Mathieu C, et al. Hypoglycaemia risk with insulin degludec compared with insulin glargine in type 2 and type 1 diabetes: a pre-planned meta-analysis of phase 3 trials. Diabetes Obes Metab. 2013;15:175–184. doi: 10.1111/dom.12032. [DOI] [PMC free article] [PubMed] [Google Scholar]
- Rosenstock J, Dailey G, Massi-Benedetti M, Fritsche A, Lin Z, Salzman A. Reduced hypoglycemia risk with insulin glargine: a meta-analysis comparing insulin glargine with human NPH insulin in type 2 diabetes. Diabetes Care. 2005;28:950–955. doi: 10.2337/diacare.28.4.950. [DOI] [PubMed] [Google Scholar]
- Steinstraesser A, Schmidt R, Bergmann K, Dahmen R, Becker RHA. Investigational new insulin glargine 300 U/ml has the same metabolism as insulin glargine 100 U/ml. Diabetes Obes Metab. 2014;16:873–876. doi: 10.1111/dom.12283. [DOI] [PMC free article] [PubMed] [Google Scholar]
Associated Data
This section collects any data citations, data availability statements, or supplementary materials included in this article.
Supplementary Materials
Figure S1. Annualized rates and percentage of participants with ≥1 hypoglycaemic event at any time of day (24 h) for pooled analysis of EDITION 2 and EDITION 3 only (safety population).
Figure S2. Annualized rates and percentage of participants with ≥1 nocturnal (00:00–05:59 hours) hypoglycaemic event for pooled analysis of EDITION 2 and EDITION 3 only (safety population).
Table S1. Key inclusion and exclusion criteria.
Table S2. Summary of baseline characteristics in the EDITION 2 and EDITION 3 pooled analysis (safety population).
Table S3. EDITION 2 and EDITION 3 pooled analysis: summary of efficacy results (modified intention-to-treat population).
Table S4. Other definitions of hypoglycaemia: events at any time of day (24 h) and during the night (00:00–05:59 hours) from baseline to month 6 for pooled analysis of all three studies (safety population).
Table S5. Summary of serious treatment-emergent adverse events for pooled analysis of all three studies (safety population).