

Abstract
Background
Variation in medical practice has identified opportunities for quality improvement in patient care. The degree of variation in the use of antibiotics in children's hospitals is unknown.
Methods
We conducted a retrospective cohort study of 556,692 consecutive pediatric inpatient discharges from 40 freestanding children's hospitals between January 1, 2008 and December 31, 2008. We used the Pediatric Health Information System to acquire data on antibiotic use and clinical diagnoses.
Results
Overall, 60% of children received at least one antibiotic agent during their hospitalization, including more than 90% of patients who had surgery, underwent central venous catheter placement, had prolonged ventilation, or remained in the hospital for greater than 14 days. Even after adjustment for both hospital-level and patient-level demographic and clinical characteristics, antibiotic use varied substantially across hospitals as both the proportion of children exposed to antibiotics (38 to 72%) and the number of days children received antibiotics (368 to 601 antibiotic days per 1000 patient days) ranged broadly. In general, hospitals using more antibiotics also used a higher proportion of broad-spectrum antibiotics.
Conclusions
Children's hospitals vary substantially in their use of antibiotics, to a degree unexplained by patient or hospital-level factors typically associated with the need for antibiotic therapy, revealing an opportunity to improve the use of these drugs.
Keywords: antimicrobials, children, hospital, variability
The inappropriately excessive use of antimicrobials, particularly systemic antibiotic agents, is a major public health and patient safety issue. Most hospitalized patients receive antibiotics [1-4] and roughly one half of all antibiotic use is unnecessary [5]. Antibiotic overuse promotes the emergence and expansion of antibiotic-resistant organisms [5, 6], and infections due to resistant pathogens have a significant impact on patient morbidity and mortality [7-9], costing an estimated $4-5 billion annually [10]. Moreover, the range and frequency of adverse drug effects due to antibiotic use have been well documented [11-17].
Professional guidelines strongly recommend the judicious use of antibiotics to prevent the emergence and transmission of multi-drug resistant organisms [6]. Further, the Infectious Diseases Society of America has urged action to combat the epidemic of antibiotic-resistant infections and has published guidelines for developing institutional programs to enhance antimicrobial stewardship [5, 18]. Supported by many professional organizations, including the Pediatric Infectious Diseases Society, the primary goal of these guidelines is to optimize clinical outcomes while reducing the drug toxicity and antimicrobial resistance associated with the excessive use of these agents. [5]
Establishing specific prescribing benchmarks to guide antimicrobial stewardship programs for hospitalized children relies upon comparing use across equivalent institutions to identify high impact targets for improvement. To begin this process, we constructed a large, geographically diverse cohort to describe the variability in antibiotic use in U.S. children's hospitals. The results of our analyses will help identify high impact targets for focused efforts to optimize use of these agents in children.
Methods
Study Design and Data Source
We conducted a retrospective cohort study of pediatric inpatients using the Pediatric Health Information System (PHIS), an administrative database managed by the Child Health Corporation of America (CHCA, Shawnee Mission, KS) containing inpatient data from more than 40 freestanding U.S. children's hospitals. We included all patients discharged from the 40 PHIS hospitals that contributed pharmacy data between January 1, 2008 and December 31, 2008. The PHIS database contains detailed information for each patient hospitalization, including demographics, diagnoses, medications, procedures and laboratory tests. Member hospitals represent 17 of the 20 major metropolitan areas across the United States, with only one children's hospital representing each city. Based on estimates from The National Association of Children's Hospitals and Related Institutions (Alexandria, VA), 70% of freestanding pediatric acute care hospital admissions in the U.S. are reported in the PHIS database.
Data quality and reliability are assured through a joint effort between CHCA, a data manager (Thomson-Reuters, Durham, NC), and participating hospitals. PHIS data are de-identified at the time of submission (before data extraction and analysis) and are accepted into the database only when classified errors occur in fewer than 2% of a hospital's quarterly data. During the study, 100% of drug use data from all 1hospitals that submit resource utilization data was included.
Independent Variables
Institution-level variables included geographic location, average daily census, and number of staffed beds. Patient-level variables identified for each hospital admission included age (0 – 29 days, 30 – 364 days, 1 – 4 years, 5 – 11 years, and 12 – 17 years), sex, race (non-Hispanic White, non-Hispanic Black, Hispanic, Asian and other) and discharge disposition. Resource use data included length of hospital stay and case mix index (CMI), a widely used surrogate for severity of illness and risk of mortality. CMI in PHIS is based on All Patient Refined Diagnosis Related Groups (APR-DRG) categories and severity levels and is calculated by Thomson-Reuters as the ratio of the average charge for patients in a particular APR-DRG category/severity level combination to the average charge for all patients using their national pediatric database. Mechanical ventilation status (Y/N), ventilation days (0, 1 – 3, 4 - 18, > 18 days) and ICU stay (Y/N) were based upon charge data.
International Classification of Disease, Ninth Revision (ICD-9) diagnosis or procedure codes were used to identify the occurrence of infection (defined by the presence or absence of any code(s) for microbial, fungal, viral, or parasitic infections), surgery (Y/N), and central-line catheter placement (Y/N). The presence of concurrent chronic illnesses was assessed using an established and validated method for characterizing ICD-9-based pediatric complex chronic conditions (CCCs), represented by nine categories: neuromuscular, cardiovascular, respiratory, renal, gastrointestinal, hematologic or immunologic, metabolic, malignancy, and genetic or other congenital defect conditions, described by Feudtner et. al [19].
Dependent Variables
For this study, we defined antibiotic use by the presence of hospital billing data for any systemic antibacterial drug. We considered vancomycin, cefepime, piperacillin/tazobactam, ticarcillin/clavulanate, carbepenems (imipenem, meropenem, ertapenem), fluoroquinolones (ciprofloxacin, levofloxacin, moxifloxacin, gatifloxacin), and linezolid “broad-spectrum” agents. Although classifying antibiotics by breadth of activity is inherently subjective and, consequently, reasonably debated, our intent was to identify drugs most commonly used to empirically treat critically ill patients, or those used for the targeted or empiric therapy of antibiotic-resistant infections. Dependent variables included receipt of any systemic antibiotic agent or broad-spectrum antibiotic agent (Y/N), and the number of days receiving any antibiotic agent or broad-spectrum antibiotic agent.
Statistical Analysis
Categorical variables were summarized using frequencies and percents for all patients included in the study, including 1) the proportion of patients in each group receiving any antibiotics and 2) the proportion of antibiotic orders that were broad-spectrum (as defined above). Adjusted hospital-specific use rates (percentage of patients receiving antibiotic agents or per 1000 patient days) were calculated using generalized linear mixed effects models, controlling for hospital clustering and allowing for the presence of correlated data (within hospitals), non-constant variability (across hospitals), and responses that are not normally distributed. Quasi-likelihood estimation for proportions with unknown distributions was used to model the duration of antibiotic use, defined as the proportion of total days of an admission that a patient received antibiotic therapy, for all patients and for only those patients receiving antibiotic agents. Proportional use and 95% confidence intervals are reported by hospital. Discharge level resource utilization was controlled for by use of length of stay (LOS) as an independent variable.
SAS 9.1 (SAS Institute, Cary, NC) was used for all analyses and p < 0.001 was considered statistically significant due to the large sample sizes used to conduct the analysis.
Results
A total of 556,692 discharges from 40 children's hospitals from January 1, 2008 through December 31, 2008 were analyzed. Hospital characteristics including census region, average daily census, and number of beds are summarized in Table 1. The demographic and clinical characteristics of these children and the hospitals from which they were discharged, as well as the proportion of children with each of these characteristics who were given antibiotics are displayed in Table 2.
Table 1. Hospital characteristics.
| Number of Hospitals | 40 | |
|---|---|---|
| Census Region | ||
| North East | 5 (12.5%) | |
| South | 15 (37.5%) | |
| North Central | 11 (27.5%) | |
| West | 9 (22.5%) | |
| Average Daily Census | ||
| <150 | 10 (25.0%) | |
| 150-200 | 17 (42.5%) | |
| >200 | 13 (32.5%) | |
| Number of Beds | ||
| <200 | 9 (22.5%) | |
| 200-300 | 22 (55.0%) | |
| >300 | 9 (22.5%) |
Table 2. Unadjusted antibiotic use across children's hospitals, by demographic and clinical variables used for adjustment in the multivariable model.
| Descriptor | Overall (%) | Received any Antibiotic (%) | Antibiotics Received that were Broad-Spectrum (%) |
|---|---|---|---|
| Total | 556692 | 336088 (60.4) | 70037 (20.8) |
| Infection Diagnosis | 208268 (37.4) | 162256 (77.9) | 46730 (28.8) |
| ICU Stay | 104728 (18.8) | 81599 (77.9) | 27825 (34.1) |
| Female | 249979 (44.9) | 152207 (60.9) | 31202 (20.5) |
| Surgical Status | 143294 (25.7) | 128644 (89.8) | 27015 (21) |
| Central-Line Catheter | 41844 (7.5) | 39431 (94.2) | 20386 (51.7) |
| Non-Hispanic White | 265595 (49) | 159038 (59.9) | 35147 (22.1) |
| Non-Hispanic Black | 115027 (21.2) | 65707 (57.1) | 12222 (18.6) |
| Hispanic | 104113 (19.2) | 66719 (64.1) | 13611 (20.4) |
| Asian | 13405 (2.5) | 8053 (60.1) | 1667 (20.7) |
| Other | 43679 (8.1) | 26944 (61.7) | 5470 (20.3) |
| Ventilation Days | |||
| 0 Days | 533351 (95.8) | 315099 (59.1) | 60499 (19.2) |
| 1 - 3 Days | 13059 (2.3) | 11137 (85.3) | 3876 (34.8) |
| 4 - 18 Days | 8075 (1.5) | 7668 (95.0) | 3949 (51.5) |
| > 19 Days | 2207 (0.4) | 2184 (99.0) | 1795 (82.2) |
| Disposition | |||
| Home | 527623 (95) | 314217 (59.6) | 60015 (19.1) |
| Died | 4513 (0.8) | 3997 (88.6) | 2666 (66.7) |
| Other | 23168 (4.2) | 17266 (74.5) | 7131 (41.3) |
| CCC Diagnoses | |||
| Neurologic | 49046 (8.8) | 32143 (65.5) | 10543 (32.8) |
| Cardiovascular | 49531 (8.9) | 36525 (73.7) | 12711 (34.8) |
| Respiratory | 15702 (2.8) | 11526 (73.4) | 4495 (39) |
| Renal | 9274 (1.7) | 8013 (86.4) | 1827 (22.8) |
| Gastrointestinal | 11473 (2.1) | 8616 (75.1) | 2947 (34.2) |
| Metabolic | 9364 (1.7) | 6333 (67.6) | 2831 (44.7) |
| Hemat./Immun. | 8613 (1.5) | 5513 (64.0) | 2145 (38.9) |
| Malignancy | 44849 (8.1) | 33062 (73.7) | 12365 (37.4) |
| Congential/Genetic | 25355 (4.6) | 19412 (76.6) | 5416 (27.9) |
| Length of Stay | |||
| 1 - 2 Days | 194643 (35) | 86435 (44.4) | 7174 (8.3) |
| 3 - 7 Days | 269811 (48.5) | 171273 (63.5) | 27575 (16.1) |
| 8 - 14 Days | 51252 (9.2) | 41030 (80.1) | 13950 (34) |
| > 14 Days | 40986 (7.4) | 37350 (91.1) | 21140 (56.6) |
| Age Group | |||
| 0 - 29 Days | 120044 (21.6) | 68167 (56.8) | 16019 (23.5) |
| 30 Days - 364 Days | 62008 (11.1) | 39541 (63.8) | 7987 (20.2) |
| 1 - 4 Years | 98726 (17.7) | 59695 (60.5) | 11641 (19.5) |
| 5 - 11 Years | 145259 (26.1) | 89572 (61.7) | 18273 (20.4) |
| 12 - 17 Years | 130655 (23.5) | 79113 (60.6) | 15506 (19.6) |
| Census Region | |||
| North East | 69230 (12.4) | 43442 (62.8) | 10122 (23.3) |
| South | 218457 (39.2) | 132246 (60.5) | 26846 (20.3) |
| North Central | 157805 (28.3) | 92380 (58.5) | 18199 (19.7) |
| West | 111200 (20) | 68020 (61.2) | 14828 (21.8) |
| Case Mix Index | |||
| Low | 99525 (17.9) | 30384 (30.5) | 1914 (6.3) |
| Moderately Low | 165430 (29.7) | 88580 (53.5) | 10984 (12.4) |
| Moderately High | 149834 (26.9) | 94295 (62.9) | 14710 (15.6) |
| High | 141903 (25.5) | 122829 (86.6) | 42130 (34.3) |
Unadjusted analyses revealed that 60% of hospitalized children received at least one dose of an antibiotic, and, on average, antibiotics were given for 468 per 1000 patient days. Antibiotics were ordered for at least 90% of patients who had surgery, underwent central venous catheter placement, had prolonged ventilation, or remained in the hospital for greater than 14 days. Of children who received antibiotics, broad-spectrum agents were chosen more often in those who stayed in the intensive care unit, received prolonged ventilation, underwent central venous catheter placement, had a longer length of stay, or received care in an institution with a higher CMI (Table 2).
To compare use across hospitals, we adjusted for the patient-level and hospital-level characteristics listed in Table 2. After adjusting for these factors, significant variability in antibiotic use remained. To illustrate this, we employed two different measures of adjusted antibiotic use. First, considering the proportion of children who were prescribed an antibiotic at any point during their hospitalization, the adjusted institutional rate of antibiotic use was calculated (overall use). As illustrated in Figure 1a (x-axis), adjusted use ranged from 38% to 72% of admissions. By this measure, children admitted to the highest-using quartile of hospitals were, on average, 27% more likely to receive an antibiotic than those admitted to the bottom quartile of hospitals, and children admitted to the highest-using 10% of hospitals were, on average, 44% more likely to receive an antibiotic than those admitted to the lowest-using 10% of hospitals.
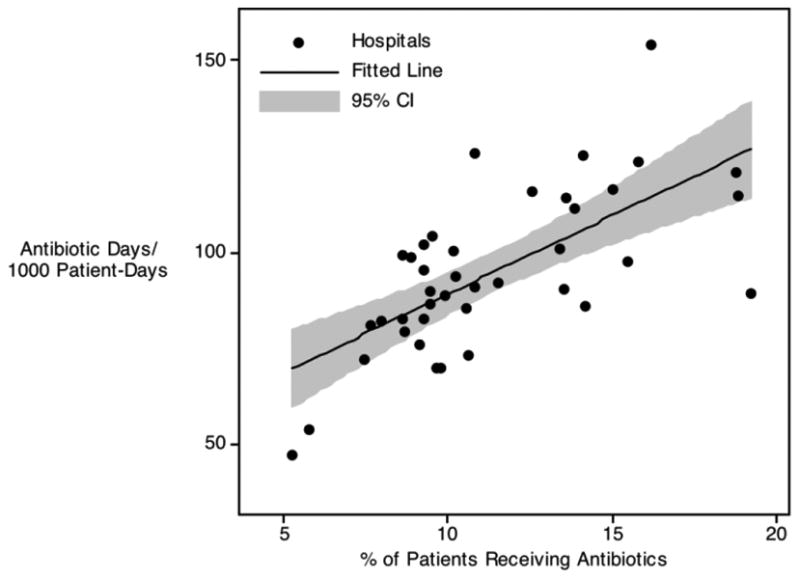
Figure 1. Adjusted Antibiotic Use per 1000 patient days vs. Any Use During a Hospitalization.
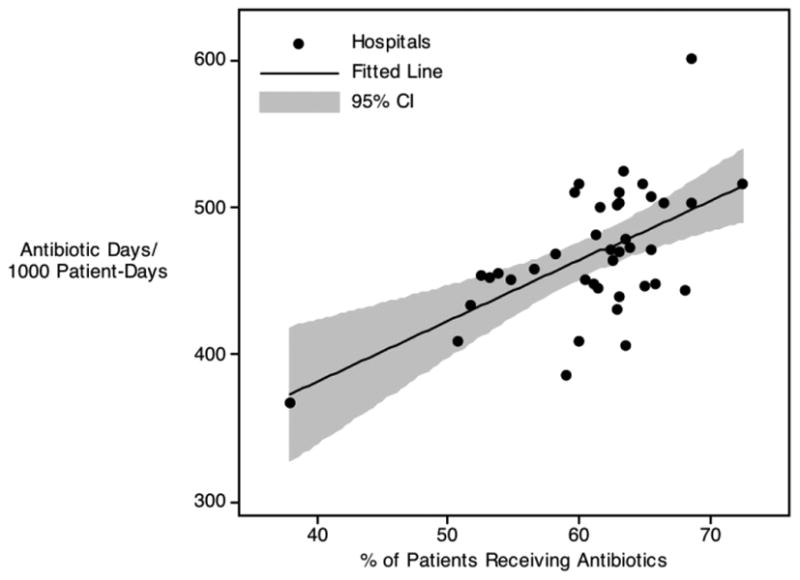
a. All Antibiotics
b. Broad Spectrum Antibiotics
Second, accounting for the same patient-level and hospital-level variables, we calculated the adjusted days of antibiotic exposure in children (Figure 1a; y-axis). Using this metric, adjusted use ranged from 368 to 601 per 1000 patient days. By this measure, children admitted to the highest-using quartile of hospitals were 25% more likely to receive an antibiotic than those admitted to the bottom quartile of hospitals, and children admitted to the highest-using 10% of hospitals were 37% more likely to receive an antibiotic than those admitted to the lowest-using 10% of hospitals. Examining the relationship between overall use and days of therapy revealed a positive correlation between these two metrics; thus, in general, hospitals that exposed more individual patients to antibiotics also exposed their patients to more days of therapy (Figure 1a; p < 0.001).
To further explore the differences in antibiotic use across institutions, we repeated these adjusted analyses considering exposure to broad-spectrum antibiotic agents (as a subset of children exposed to antibiotics). As illustrated in Figure 1b, variation in the use of broad-spectrum antibiotics mirrored that seen with overall antibiotic use, as measured by both overall use and days of therapy. As was the case when considering all antibiotic classes, the relationship between overall use and days of therapy with broad-spectrum antibiotics again revealed a positive correlation between these two metrics (Figure 1b; p < 0.001). Furthermore, there was a positive correlation between the proportion of children prescribed any antibiotics and the proportion given broad-spectrum agents (p = 0.017) suggesting that, in general, institutions prescribing more antibiotics also used more broad-spectrum antibiotics (inconsistent with the notion that more overall antibiotic exposure was compensated for by the preferred use of narrow-spectrum therapy). Although all patient and clinical variables listed in Table 2 were adjusted for in these analyses, the standardized beta coefficients derived from these adjustments revealed that performance of a surgical procedure (0.32), presence of an infection code (0.32), and hospital CMI (0.18) were most influential; all other standardized beta values were ≤ 0.7.
Discussion
To our knowledge, this study is the first to compare antibiotic use across children's hospitals. We found that 60% of hospitalized children are prescribed at least one antibiotic, and that antibiotics were given for an average of 468/1000 inpatient days. When examined by hospital, however, significant variability in antibiotic use becomes apparent: after extensive adjustment for both patient and hospital level characteristics, children at some institutions were 44% more likely to receive antibiotics or, using an alternative metric, were exposed to antibiotics for 37% more days when compared with other institutions.
Although outpatient antibiotic prescribing has been relatively well characterized [20-25], the data describing inpatient antibiotic use are limited. Antibiotic use has been measured among networks of hospitals, including Centers for Disease Control and Prevention (CDC) initiatives such as the National Nosocomial Infection Surveillance (NNIS) System [26] and Project Intensive Care Antimicrobial Resistance Epidemiology (ICARE) [27]; however, these programs analyzed exclusively intensive care unit (ICU) admissions and a relatively small proportion of children. Further, antibiotic use in these reports is quantified as “defined daily doses” per 1000 patient days, a metric unsuitable for children since children's medications are dosed based on weight. More recently, number of days of therapy (DOT) has been proposed as an alternative measure of antimicrobial utilization that may allow more appropriate comparisons of antimicrobial use between adults and children [1]. Adopting this approach, investigators found that 60% of hospitalized adults received at least one dose of antibiotic therapy and that inpatients received an average of 776 per 1000 patient days of therapy. Comparing use across these hospitals in a subsequent analysis, the same group reported that the proportion of inpatients that received at least one dose of an antibiotic agent during their hospitalization demonstrated a range across hospitals of 44.4%-73.6%, while the mean total rate of antibiotic use ranged between 454 and 1,153 per 1000 patient days (multiple antibiotics on the same day each count individually as a “day of therapy,” allowing the total DOT numerator to exceed 1,000) [2]. Again, however, these studies analyzed adult patients, without subset analyses of children.
Only two studies have focused exclusively on antibiotic use in hospitalized children. A point prevalence survey, including only ICU patients, identified that approximately 71% of NICU patients and 43% of PICU patients were receiving antibiotics at the time of the survey [28]. The lone pediatric-specific study of all hospitalized children (not confined to the ICU) described discharges from 20 academic hospitals throughout the United States [29]. This study identified a mean of 33% of children as exposed to at least one antibiotic during their hospitalization and roughly 550 DOTs per 1,000 patient days. These academic hospitals, however, served primarily adult patients and, after excluding adults from the analysis, there were 30-fold less children/year than were included in our study of 40 freestanding children's hospitals. Furthermore, the analysis did not compare antibiotic use between institutions.
The striking variability in antibiotic use revealed by our analysis persisted despite adjustment for patient characteristics associated with an increased need for antibiotic therapy or prophylaxis (infection diagnosis, surgical procedures, ICU stay, ventilator days, and underlying chronic conditions) as well as for hospital characteristics (summarized by the Case Mix Index) suggestive of an institution that may provide more advanced care to a generally sicker population and, therefore, require more empiric or targeted antibiotic therapy. Furthermore, our analysis included children admitted to exclusively freestanding children's hospitals over an entire year, representing a relatively homogeneous group of centers with respect to the need and expertise available for the treatment of infectious diseases. Additionally, hospitals that exposed a higher proportion of patients to antibiotics also used more days of therapy, a relationship inconsistent with the notion that institutions at which more patients are exposed to antibiotics use these drugs for shorter periods of time, or visa versa. Also, hospitals using more antibiotics—measured either by overall use or days of therapy—tended to (aggregately) use more vancomycin, cefepime, piperacillin/tazobactam, ticarcillin/clavulanate, carbepenems, fluoroquinolones, and linezolid as a proportion of total antibiotic use than lower-using centers, negating the possibility that antibiotic quantity was generally offset by limiting patient exposure to these broad-spectrum drugs (and the associated increased antibiotic resistance pressure and cost).
Although it is unclear what factors specifically drove increased antibiotic use within higher-using hospitals, variability was apparent in both the percentage of children receiving an antibiotic agent at any time during their hospitalization as well as in total days of antibiotics received. Thus, either a lower threshold to institute treatment with antibiotics or a longer length of therapy for a given condition (or both) could have contributed. Notably, many children receiving antibiotic agents did not have a diagnosis code for infection. Although some of these patients may have received appropriate surgical prophylaxis, variability in the threshold to begin (or continue) antibiotics for conditions ultimately not diagnosed as infectious could account for this phenomenon.
Although not surprising, such profound variability in antibiotic use is troubling. If variability remains after normalizing for differences in illness severity and patient complexity, it follows that either children at some hospitals are undertreated with antibiotics and, therefore, are unnecessarily at risk of treatment failure or, the more likely alternative, that some hospitalized children receive excessive antibiotic therapy and, therefore, are unnecessarily at risk of developing antibiotic-resistant infections and drug-related adverse effects while incurring inappropriate hospital costs. In addition to highlighting the need to establish effective antibiotic stewardship programs in children's hospitals, a setting in which there remains considerable opportunity for improvement [30], these data provide further impetus to perform comparative effectiveness studies to determine the appropriate therapy—particularly with respect to duration of antibiotic therapy—for common, pediatric infections [31]. More detailed analyses of these data to identify specific agents and indications associated with the greatest variability will provide high impact targets for improvement.
Our study has limitations. The PHIS database offers the unique advantage of detailed, national-level, pediatric data from the majority of U.S. metropolitan areas. PHIS provides up to 21 diagnosis codes per hospitalization, providing more diagnosis data per patient than most administrative data sets. This database, however, may not be generalizable to non-tertiary care, freestanding children's hospitals. For example, due to referral bias, PHIS may over represent the true incidence of some medically complicated or severe infections. Also, administrative data sources such as PHIS are limited with specific regard to the possibility of miscoded or inaccurate information. Though generally specific, ICD-9-CM-based identification may not have ideal sensitivity. This study, however, did not rely heavily on ICD-9-based coding, including the dependent and the majority of independent variables, and the use of ICD-9 codes to identify chronic complex conditions has been validated [19]. Additionally, all data benefited from an established mechanism of validity and reliability checks performed by the data vendor. Antibiotic use data is derived from antibiotic orders; therefore, any drugs that were ordered and not administered to children would misclassify those children with respect to antibiotic use. These data represent only aggregate antibiotic orders, so we cannot make inferences concerning the variability in use of different classes of antibiotic agents.
In summary, we found that the majority of patients admitted to children's hospitals were exposed to antibiotics. Individual hospitals varied significantly, however, in their use of antibiotic agents. Establishing benchmarks for antibiotic use will help to inform hospital and public policy aimed to treat children with known or presumed infections judiciously.
Footnotes
All Authors have no conflict of interest
Contributor Information
Jeffrey S Gerber, Divisions of Infectious Diseases, University of Pennsylvania School of Medicine, Philadelphia, PA, Center for Pediatric Clinical Effectiveness, University of Pennsylvania School of Medicine, Philadelphia, PA, The Children's Hospital of Philadelphia; Department of Pediatrics, University of Pennsylvania School of Medicine, Philadelphia, PA.
Jason G Newland, Division of Infectious Diseases, Children's Mercy Hospital, Kansas City, MO.
Susan E Coffin, Divisions of Infectious Diseases, University of Pennsylvania School of Medicine, Philadelphia, PA, Center for Pediatric Clinical Effectiveness, University of Pennsylvania School of Medicine, Philadelphia, PA, The Children's Hospital of Philadelphia; Department of Pediatrics, University of Pennsylvania School of Medicine, Philadelphia, PA, Center for Clinical Epidemiology and Biostatistics, University of Pennsylvania School of Medicine, Philadelphia, PA.
Matt Hall, Child Health Corporation of America, Shawnee Mission, KS.
Cary Thurm, Child Health Corporation of America, Shawnee Mission, KS.
Priya A Prasad, Divisions of Infectious Diseases, University of Pennsylvania School of Medicine, Philadelphia, PA.
Chris Feudtner, Center for Pediatric Clinical Effectiveness, University of Pennsylvania School of Medicine, Philadelphia, PA, General Pediatrics, University of Pennsylvania School of Medicine, Philadelphia, PA, The Children's Hospital of Philadelphia; Department of Pediatrics, University of Pennsylvania School of Medicine, Philadelphia, PA, Center for Clinical Epidemiology and Biostatistics, University of Pennsylvania School of Medicine, Philadelphia, PA.
Theoklis E Zaoutis, Divisions of Infectious Diseases, University of Pennsylvania School of Medicine, Philadelphia, PA, Center for Pediatric Clinical Effectiveness, University of Pennsylvania School of Medicine, Philadelphia, PA, The Children's Hospital of Philadelphia; Department of Pediatrics, University of Pennsylvania School of Medicine, Philadelphia, PA, Center for Clinical Epidemiology and Biostatistics, University of Pennsylvania School of Medicine, Philadelphia, PA.
References
- 1.Polk RE, Fox C, Mahoney A, Letcavage J, MacDougall C. Measurement of adult antibacterial drug use in 130 US hospitals: comparison of defined daily dose and days of therapy. Clin Infect Dis. 2007 Mar 1;44(5):664–70. doi: 10.1086/511640. [DOI] [PubMed] [Google Scholar]
- 2.MacDougall C, Polk RE. Variability in rates of use of antibacterials among 130 US hospitals and risk-adjustment models for interhospital comparison. Infect Control Hosp Epidemiol. 2008 Mar;29(3):203–11. doi: 10.1086/528810. [DOI] [PubMed] [Google Scholar]
- 3.Pakyz A, Powell JP, Harpe SE, Johnson C, Edmond M, Polk RE. Diversity of antimicrobial use and resistance in 42 hospitals in the United States. Pharmacotherapy. 2008 Jul;28(7):906–12. doi: 10.1592/phco.28.7.906. [DOI] [PubMed] [Google Scholar]
- 4.Pakyz AL, MacDougall C, Oinonen M, Polk RE. Trends in antibacterial use in US academic health centers: 2002 to 2006. Arch Intern Med. 2008 Nov 10;168(20):2254–60. doi: 10.1001/archinte.168.20.2254. [DOI] [PubMed] [Google Scholar]
- 5.Dellit TH, Owens RC, McGowan JE, Jr, et al. Infectious Diseases Society of America and the Society for Healthcare Epidemiology of America guidelines for developing an institutional program to enhance antimicrobial stewardship. Clin Infect Dis. 2007 Jan 15;44(2):159–77. doi: 10.1086/510393. [DOI] [PubMed] [Google Scholar]
- 6.Shlaes DM, Gerding DN, John JF, Jr, et al. Society for Healthcare Epidemiology of America and Infectious Diseases Society of America Joint Committee on the Prevention of Antimicrobial Resistance: guidelines for the prevention of antimicrobial resistance in hospitals. Clin Infect Dis. 1997 Sep;25(3):584–99. doi: 10.1086/513766. [DOI] [PubMed] [Google Scholar]
- 7.Paterson DL. “Collateral damage” from cephalosporin or quinolone antibiotic therapy”. Clin Infect Dis. 2004 May 15;38(Suppl 4):S341–5. doi: 10.1086/382690. [DOI] [PubMed] [Google Scholar]
- 8.Cosgrove SE. The relationship between antimicrobial resistance and patient outcomes: mortality, length of hospital stay, and health care costs. Clin Infect Dis. 2006 Jan 15;42(Suppl 2):S82–9. doi: 10.1086/499406. [DOI] [PubMed] [Google Scholar]
- 9.Macgowan AP. Clinical implications of antimicrobial resistance for therapy. J Antimicrob Chemother. Nov;200862(Suppl 2):ii105–14. doi: 10.1093/jac/dkn357. [DOI] [PubMed] [Google Scholar]
- 10.Medicine lo., editor. Antimicrobial Resistance: Issues and Options. Vol. 1988 Washington: National Academy Press; [Google Scholar]
- 11.Bartlett JG. Clinical practice. Antibiotic-associated diarrhea. N Engl J Med. 2002 Jan 31;346(5):334–9. doi: 10.1056/NEJMcp011603. [DOI] [PubMed] [Google Scholar]
- 12.Bartlett JG. Narrative review: the new epidemic of Clostridium difficile-associated enteric disease. Ann Intern Med. 2006 Nov 21;145(10):758–64. doi: 10.7326/0003-4819-145-10-200611210-00008. [DOI] [PubMed] [Google Scholar]
- 13.Park-Wyllie LY, Juurlink DN, Kopp A, et al. Outpatient gatifloxacin therapy and dysglycemia in older adults. N Engl J Med. 2006 Mar 30;354(13):1352–61. doi: 10.1056/NEJMoa055191. [DOI] [PubMed] [Google Scholar]
- 14.Gholami K, Parsa S, Shalviri G, Sharifzadeh M, Assasi N. Anti-infectives-induced adverse drug reactions in hospitalized patients. Pharmacoepidemiol Drug Saf. 2005 Jul;14(7):501–6. doi: 10.1002/pds.1099. [DOI] [PubMed] [Google Scholar]
- 15.Budnitz DS, Pollock DA, Weidenbach KN, Mendelsohn AB, Schroeder TJ, Annest JL. National surveillance of emergency department visits for outpatient adverse drug events. JAMA. 2006 Oct 18;296(15):1858–66. doi: 10.1001/jama.296.15.1858. [DOI] [PubMed] [Google Scholar]
- 16.Shehab N, Patel PR, Srinivasan A, Budnitz DS. Emergency department visits for antibiotic-associated adverse events. Clin Infect Dis. 2008 Sep 15;47(6):735–43. doi: 10.1086/591126. [DOI] [PubMed] [Google Scholar]
- 17.Gandhi TK, Weingart SN, Borus J, et al. Adverse drug events in ambulatory care. N Engl J Med. 2003 Apr 17;348(16):1556–64. doi: 10.1056/NEJMsa020703. [DOI] [PubMed] [Google Scholar]
- 18.Spellberg B, Guidos R, Gilbert D, et al. The epidemic of antibiotic-resistant infections: a call to action for the medical community from the Infectious Diseases Society of America. Clin Infect Dis. 2008 Jan 15;46(2):155–64. doi: 10.1086/524891. [DOI] [PubMed] [Google Scholar]
- 19.Feudtner C, Christakis DA, Connell FA. Pediatric deaths attributable to complex chronic conditions: a population-based study of Washington State, 1980-1997. Pediatrics. 2000 Jul;106(1 Pt 2):205–9. [PubMed] [Google Scholar]
- 20.Nyquist AC, Gonzales R, Steiner JF, Sande MA. Antibiotic prescribing for children with colds, upper respiratory tract infections, and bronchitis. JAMA. 1998 Mar 18;279(11):875–7. doi: 10.1001/jama.279.11.875. [DOI] [PubMed] [Google Scholar]
- 21.Finkelstein JA, Metlay JP, Davis RL, Rifas-Shiman SL, Dowell SF, Platt R. Antimicrobial use in defined populations of infants and young children. Arch Pediatr Adolesc Med. 2000 Apr;154(4):395–400. doi: 10.1001/archpedi.154.4.395. [DOI] [PubMed] [Google Scholar]
- 22.Nash DR, Harman J, Wald ER, Kelleher KJ. Antibiotic prescribing by primary care physicians for children with upper respiratory tract infections. Arch Pediatr Adolesc Med. 2002 Nov;156(11):1114–9. doi: 10.1001/archpedi.156.11.1114. [DOI] [PubMed] [Google Scholar]
- 23.McCaig LF, Besser RE, Hughes JM. Trends in antimicrobial prescribing rates for children and adolescents. JAMA. 2002 Jun 19;287(23):3096–102. doi: 10.1001/jama.287.23.3096. [DOI] [PubMed] [Google Scholar]
- 24.Steinman MA, Gonzales R, Linder JA, Landefeld CS. Changing use of antibiotics in community-based outpatient practice, 1991-1999. Ann Intern Med. 2003 Apr 1;138(7):525–33. doi: 10.7326/0003-4819-138-7-200304010-00008. [DOI] [PubMed] [Google Scholar]
- 25.Grijalva CG, Nuorti JP, Griffin MR. Antibiotic prescription rates for acute respiratory tract infections in US ambulatory settings. JAMA. 2009 Aug 19;302(7):758–66. doi: 10.1001/jama.2009.1163. [DOI] [PMC free article] [PubMed] [Google Scholar]
- 26.National Nosocomial Infections Surveillance (NNIS) System Report, data summary from January 1992 through June 2004, issued October 2004. Am J Infect Control. 2004 Dec;32(8):470–85. doi: 10.1016/S0196655304005425. [DOI] [PubMed] [Google Scholar]
- 27.Fridkin SK, Steward CD, Edwards JR, et al. Surveillance of antimicrobial use and antimicrobial resistance in United States hospitals: project ICARE phase 2. Project Intensive Care Antimicrobial Resistance Epidemiology (ICARE) hospitals. Clin Infect Dis. 1999 Aug;29(2):245–52. doi: 10.1086/520193. [DOI] [PubMed] [Google Scholar]
- 28.Grohskopf LA, Huskins WC, Sinkowitz-Cochran RL, Levine GL, Goldmann DA, Jarvis WR. Use of antimicrobial agents in United States neonatal and pediatric intensive care patients. Pediatr Infect Dis J. 2005 Sep;24(9):766–73. doi: 10.1097/01.inf.0000178064.55193.1c. [DOI] [PubMed] [Google Scholar]
- 29.Pakyz AL, Gurgle HE, Ibrahim OM, Oinonen MJ, Polk RE. Trends in antibacterial use in hospitalized pediatric patients in United States academic health centers. Infect Control Hosp Epidemiol. 2009 Jun;30(6):600–3. doi: 10.1086/597545. [DOI] [PubMed] [Google Scholar]
- 30.Hersh AL, Beekmann SE, Polgreen PM, Zaoutis TE, Newland JG. Antimicrobial stewardship programs in pediatrics. Infect Control Hosp Epidemiol. 2009 Dec;30(12):1211–7. doi: 10.1086/648088. [DOI] [PubMed] [Google Scholar]
- 31.Rice LB. The Maxwell Finland Lecture: for the duration-rational antibiotic administration in an era of antimicrobial resistance and clostridium difficile. Clin Infect Dis. 2008 Feb 15;46(4):491–6. doi: 10.1086/526535. [DOI] [PubMed] [Google Scholar]