

Abstract
INTRODUCTION
It is unclear whether white matter hyperintensities (WMH), MRI markers of small-vessel cerebrovascular disease, promote neurodegeneration and associated clinical decline in Alzheimer’s disease (AD), or simply co-occur with recognized pathogenic processes.
METHODS
In 169 patients with mild cognitive impairment (MCI), followed for 3 years, we examined the association of 1) baseline regional WMH and cerebral spinal fluid (CSF) derived total-tau with entorhinal cortex atrophy rates, as a marker of AD-related neurodegeneration, and conversion to AD; and 2) baseline regional WMH with change in total-tau level.
RESULTS
In participants with low baseline total-tau, higher regional WMH volumes were associated with faster entorhinal cortex atrophy. Higher parietal WMH volume predicted conversion to AD in those with high total-tau. Higher parietal and occipital WMH volumes predicted increasing total-tau.
DISCUSSION
White matter hyperintensities affect AD clinical and pathological processes both directly and interacting with tau.
Keywords: white matter hyperintensities, CSF tau, Alzheimer’s disease, mild cognitive impairment
Introduction
There has been an increased interest in the potential contributions of small vessel cerebrovascular disease to the clinical presentation and pathogenesis of Alzheimer’s Disease (AD). Despite consistent observations supporting the role of vascular factors in AD [1–5], they have not been incorporated into the prevailing pathogenic models nor into newly implemented research criteria for AD and its antecedent conditions [6] [7] [8]. It is unclear whether cerebrovascular disease represents an independent pathological factor that confers additive risk for clinical severity and course, whether it is a result of AD pathology, and/or whether it plays a primary role by promoting AD-related neurodegenerative changes. Understanding the role of cerebrovascular disease in AD is especially critical as it could clarify the prospect of vascular risk reduction as a preventive strategy for AD.
Small vessel cerebrovascular disease typically manifests as white matter hyperintensities (WMH), areas of increased signal on T2-weighted MRI. In addition to being present in most individuals by the mid-sixties [9] and correlating reliably with cognitive functioning in normal aging [10], we and others have shown that WMH may play a specialized role in AD. White matter hyperintensity volume is elevated among individuals at risk for AD by virtue of being diagnosed with mild cognitive impairment (MCI; [5]); predicts rate of cognitive decline in MCI [11] and in AD [12]; and increases risk for future development of AD [13]. Furthermore, WMH distributed in the parietal lobes, in particular, increase risk for later development of AD [14], progress more rapidly among individuals who develop AD [15], and are associated with genetic risk for AD [16], although there is also evidence that WMH distributed in anterior regions is associated with cognitive impairment and markers of AD pathology [17–19]. The purpose of the current study was to examine whether WMH, as a marker of small vessel cerebrovascular disease, confers risk for regional brain atrophy reflective of AD-related neurodegenerative changes independently or interactively with cerebrospinal fluid markers of tau pathology. We also examined whether WMH predicts change in diagnostic status and longitudinal increase in CSF tau. Based on our previous observations with parietal lobe WMH and a recent report that showed that parietal WMH and tau have synergistic effects on predicting progression from MCI to AD [20], we hypothesized that parietal lobe WMH in particular would modify the effect of tau pathology on brain atrophy and clinical decline among individuals at risk for AD.
Materials and methods
1.1. Overview
Using data from the Alzheimer’s Disease Neuroimaging Initiative (ADNI), we examined whether regional WMH volumes are related to the biological or clinical markers implicated in current hypothetical pathogenic models of AD [21] [22]. Our primary question was whether regional WMH confer independent or synergistc effects on neurodegeneration with regard to tau pathology. Secondary questions addressed whether WMH has a similar effect on progression from MCI to AD and whether baseline measures of WMH predict increase in CSF tau over time. For markers of neurodegeneration, we chose entorhinal cortex volume as the main outcome because of its well-established role as a structural biomarker for AD that is important for memory function and vulnerable to neurofibrillary tangle pathology early in the pathogenic process [23]. We examined progression from MCI to AD status as the primary clinical outcome. Finally, we examined the possibility that WMH promotes the progression of AD pathology by testing whether regional WMH volumes predict subsequent changes in tau pathology. Additional analyses with Aβ42 as covariates tested whether the effect of WMH and their interaction with total tau was independent of markers of amyloid pathology.
1.2. Dataset
Analyses for the current study used data from first phase of the ADNI (ADNI-1) (www.adni.loni.usc.edu). The ADNI was launched in 2003 by the National Institute on Aging (NIA), the National Institute of Biomedical Imaging and Bioengineering (NIBIB), the Food and Drug Administration (FDA), private pharmaceutical companies and non-profit organizations, as a $60 million, 5-year public-private partnership. The primary goal of ADNI has been to test whether serial MRI, PET, other biological markers, and clinical and neuropsychological assessment can be combined to measure the progression of mild cognitive impairment (MCI) and early Alzheimer’s disease (AD). Determination of sensitive and specific markers of very early AD progression is intended to aid researchers and clinicians to develop new treatments and monitor their effectiveness, as well as lessen the time and cost of clinical trials.
The Principal Investigator of this initiative is Michael W. Weiner, MD, VA Medical Center and University of California – San Francisco. ADNI is the result of efforts of many co-investigators from a broad range of academic institutions and private corporations, and subjects have been recruited from over 50 sites across the U.S. and Canada. The initial goal of ADNI was to recruit 800 subjects but ADNI has been followed by ADNI-GO and ADNI-2. To date these three protocols have recruited over 1500 adults, ages 55 to 90, to participate in the research, consisting of cognitively normal older individuals, people with early or late MCI, and people with early AD. The follow up duration of each group is specified in the protocols for ADNI-1, ADNI-2 and ADNI-GO. Subjects originally recruited for ADNI-1 and ADNI-GO had the option to be followed in ADNI-2. For up-to-date information, see www.adni-info.org.
1.3. Participants
Data from subjects diagnosed with amnestic MCI were downloaded from the ADNI website (www.adni.loni.usc.edu) and included demographic, cognitive, CSF biomarkers at baseline and longitudinal structural MRI scans data (n=186). The ADNI study was designed to parallel procedures employed in a clinical trial and thus only included participants who were in good medical health. Individuals were excluded from participation if they had significant vascular disease history, defined as a modified Hachinski score greater than 4 [26]. Diagnosis of MCI was based on standard research criteria and included age between 55 and 90, a memory complaint (study subject or informant), objective evidence of abnormal memory, Clinical Dementia Rating (CDR, [27]) score of 0.5, with a memory domain score of at least 0.5, Mini Mental State Examination (MMSE, [28]) score between 24 and 30 (inclusive), general cognition preserved such that a diagnosis of AD could not be made, stable medication, and not depressed (Geriatric Depression Scale [29] score of less than 6). Recruitment and diagnostic procedures have been reported in detail previously [30]. For the current analyses, participants were included if they had diagnosis of MCI at baseline, demographic variables, APOE genotype, CSF biomarkers (Aβ42, t-tau), and WMH assessment at baseline and longitudinal MRI scans. Seventeen subjects were excluded because of radiological evidence of infarcts resulting in a final sample size was of 169 individuals. A subset of these subjects had longitudinal t-tau data available (n= 67).
1.4. Neuroimaging acquisition
A standardized MRI protocol for image acquisition was implemented across ADNI sites, which was validated across platforms [31]. All data acquisition was performed on 1.5 Tesla systems. T1-weighted volumetric magnetization prepared rapid gradient echo sequences were acquired in the sagittal orientation. A proton density/T2-weighted fast spin echo sequence was acquired in the axial orientation. Sites included in the ADNI protocol were required to pass rigorous scanner validation tests and scan acquisitions for each subject included a fluid-filled phantom. Details of the validation procedures are provided elsewhere (www.adni.loni.usc.edu).
1.5. Predictors
1.5.1. White matter hyperintensities
Detailed description of WMH volumetric quantification has been provided previously [32]. Briefly, the T1-, T2-, and PD-weighted MRI scans were co-registered and skull-stripped [33,34]. After bias field correction [35], WMH were detected based on corresponding PD, T1, and T2 intensities, the prior probability of WMH, and the conditional probability of WMH based on the presence of WMH at neighboring voxels. Total WMH volumes were derived by summing and multiplying the number of labeled voxels by voxel dimensions. Regional WMH volumes, from frontal, temporal, parietal, and occipital lobes, were derived for the baseline scans. Total and regional WMH volumes were natural log-transformed before analysis.
1.5.2. Cerebrospinal fluid biomarkers
Cerebrospinal fluid samples were collected at study baseline by lumbar puncture, and shipped to the ADNI Biomarker Core laboratory at the University of Pennsylvania Medical Center for long-term storage at −80° C. Details regarding the assay technology, validation and quality control can be found online in a data primer for these CSF analyses (www.adni.loni.usc.edu). The established CSF AD biomarkers Aβ42, t-tau and phosphorylated tau (p-tau) were measured using the multiplex xMAP Luminex platform (Luminex Corp, Austin, TX) with the INNOBIA AlzBio3 kit (Innogenetics, Ghent, Belgium). The biomarkers considered in the present study (Aβ42 and t-tau), were treated as dichotomous variables by dividing values according to established diagnostic thresholds validated in the ADNI cohort (i.e. for total tau=93 pg/ml) [36]. In addition to baseline CSF biomarkers, we examined longitudinal CSF t-tau assessment over 3 years of follow-up available for a subset of patients (n= 67).
1.6. Outcomes
1.6.1. Neuroimaging outcomes
Structural MRI parcellation and segmentation data were downloaded from the ADNI website. ADNI structural MRI data were analyzed with the longitudinal processing stream in FreeSurfer version 4.3 (https://surfer.nmr.mgh.harvard.edu) at University of California, San Francisco after the T1-weighted MRI scans were converted to NiFTI format and pre-processed at Mayo Clinic [37]. FreeSurfer was used to derive entorhinal cortex volume and total intracranial volume.
1.6.2. Clinical outcomes
All subjects were diagnosed with MCI at baseline. The main clinical/diagnostic outcome was time to conversion to AD.
1.7. Covariates and APOE genotyping
Sex, number of years of education, and age at baseline were included as covariates in all the models presented. In addition, all models were adjusted by total cranial volume at baseline to correct for individual differences in head size. APOE genotyping was based on allelic combinations of single-nucleotide polymorphisms rs7412 and rs429358.
1.8. Statistical analysis
Analyses were restricted to ADNI-1 phase, which includes up to 36 months of follow-up data at 6-month intervals.
General Estimating Equation (GEE) analysis was used to investigate the impact of baseline regional WMH volumes and t-tau on rate of entorhinal cortex atrophy. This method takes into account that each subject has multiple visits and that measurements over time are likely to be correlated; furthermore, GEE allows for missing values and violation of normality [39]. Separate GEE models were run for each baseline regional WMH volume, time (in months from baseline), and their interaction as predictors (Model 1). Cerebrospinal fluid-derived measures of t-tau at baseline, time, and their interaction were entered as predictors in Model 2. A third series of models tested the two-and three-way interactions of baseline regional WMH volumes, baseline t-tau and time controlling for the main effects of each predictor (Model 3). Significant interaction terms with time would indicate that regional WMH volume or t-tau predicts the rate of entorhinal cortex atrophy. A significant three-way interaction would suggest that t-tau levels predict rates of atrophy and that this effect is modified by regional WMH burden, or equivalently that regional WMH volumes predict the rates of atrophy and that this effect is modified by t-tau levels. We included in a separate model CSF Aβ42 as an additional covariate to test if it had any confounding and/or modifying effects on the interaction between WMH volumes and t-tau (Model 3b). Similarly, this analysis was repeated after restricting the subject group to individuals defined as “amyloid positive” (n=124) by cutpoints established in ADNI [36]. Finally, GEE analysis was again used to investigate whether regional WMH volumes at baseline could impact rate of change of t-tau over time. All analyses involving t-tau levels as a baseline predictor employed a dichotomized variable as explained in section 1.5.2.
Cox proportional hazards models were constructed to examine the impact of baseline regional WMH volumes on progression to AD. Additional analyses were carried out to include t-tau and its interaction with the baseline regional WMH volumes. We used the enter selection method and the importance of predictive factors was assessed with Wald-type test statistics, the hazard ratio, and its 95% confidence interval for survival. Alpha levels were set a priori at 0.05.
Results
Clinical and demographic data are reported in Table 1
Table 1.
Demographic and baseline characteristics of participants included in the study, all diagnosed with mild cognitive impairment at baseline.
| Characteristic | Value | |
|---|---|---|
| Subjects (n) | 169 | |
| Sex (% women) | 33.1 | |
| Mean (SD) age at baseline, years | 73.8 (7) | |
| Mean (SD) education, years | 15.7 (3) | |
| APOE status (% of participants with ε4) | 53.8 | |
| Entorhinal cortex volume (SD) at baseline, mm3 | 1718 (400) | |
| median frontal WMH (IQR), cm3 | 0.09 (0) | |
| median temporal WMH (IQR), cm3 | 0.01 (0) | |
| median parietal WMH (IQR), cm3 | 0.04 (0.1) | |
| median occipital WMH (IQR), cm3 | 0.05 (0) | |
| median total WMH (IQR), cm3 | 0.24 (0.5) | |
| t-tau | median value (IQR) | 86 (59) |
| Subjects (n) with high versus low t-tau | 97 vs. 72 | |
| Number of subjects converting to Alzheimer’s disease over the follow-up interval | 79 | |
NOTE: SD=standard deviation; IQR= interquartile range; WMH= white matter hyperintensities; t-tau=CSF total-tau.
Rate of entorhinal cortex atrophy
Results of the primary GEE analyses are presented in Table 2. Participants with high baseline t-tau showed faster atrophy rates compared with those with low t-tau as expected (significant baseline t-tau*time interaction). However, baseline regional WMH volumes modified the effect of t-tau on entorhinal cortex atrophy rates; those with lower baseline t-tau and higher frontal and parietal WMH volumes had disproportionately greater entorhinal cortex atrophy rates compared with those with low baseline t-tau and lower regional WMH volumes (significant baseline t-tau*baseline regional WMH*time interaction). For graphical purposes (Figure 1), we dichotomized subjects in high and low baseline parietal lobe WMH volumes and plotted rates of entorhinal cortex atrophy, stratifying by baseline t-tau level. The results did not change when Aβ42 was introduced as an additional covariate (Table 2, Model 3b); similarly, when restricting the analyses to individuals defined as amyloid positive, the t-tau*parietal WMH*time interaction the effect was almost identical (β=−1.29, CI:−3.00–0.43).
Table 2.
Predicting entorhinal cortex atrophy. The table displays results from GEE analyses that determined whether baseline measures of regional WMH and/or tau (predictors) are associated with longitudinal change in entorhinal cortex atrophy (outcome). Two-way interactions with time indicate that the rate of entorhinal cortex atrophy varies as a function of each unit measurement of the predictor. For example, the significant interaction between tau and time (Model 2) indicates that entorhinal cortex volume declines on average 5.14mm3 per month less in the low tau group compared with the high tau group (reference). When three-interactions are considered, the rate of change over time in entorhinal cortex volume is a function of increasing WMH increase in the low t-tau group as compared to the high t-tau group (reference group). In Model 1, separate GEE analyses were run for each baseline regional WMH volume. Model 2 considered baseline t-tau levels as a primary predictor of entorhinal cortex atrophy. Model 3 included separate GEE analyses that examined the interactions between baseline regional WMH and t-tau on entorhinal cortex volume.
| Predictors | Model 1* | Model 2* | Model 3* | Model 3b† | ||||
|---|---|---|---|---|---|---|---|---|
| β | p | β | p | β | p | β | p | |
| Time * frontal WMH | 0 | 0.99 | ||||||
| Time * temporal WMH | −0.20 | 0.51 | ||||||
| Time * parietal WMH | 0.07 | 0.83 | ||||||
| Time * occipital WMH | −0.19 | 0.58 | ||||||
| Time * t-tau c | 5.14 | 0.001 | ||||||
| Time * frontal WMH * t-tau ‡ | −2.21 | 0.005 | −2.06 | 0.007 | ||||
| Time * temporal WMH * t-tau ‡ | −1.02 | 0.07 | −1.01 | 0.07 | ||||
| Time * parietal WMH * t-tau ‡ | −1.51 | 0.009 | −1.44 | 0.010 | ||||
| Time * occipital WMH * t-tau ‡ | −0.65 | 0.25 | −0.56 | 0.32 | ||||
adjusted for sex, age, education, APOE, intracranial volume
adjusted for sex, age, education, APOE, intracranial volume, Aβ-42
high t-tau is the reference group
NOTE: p=p-value
Figure 1.
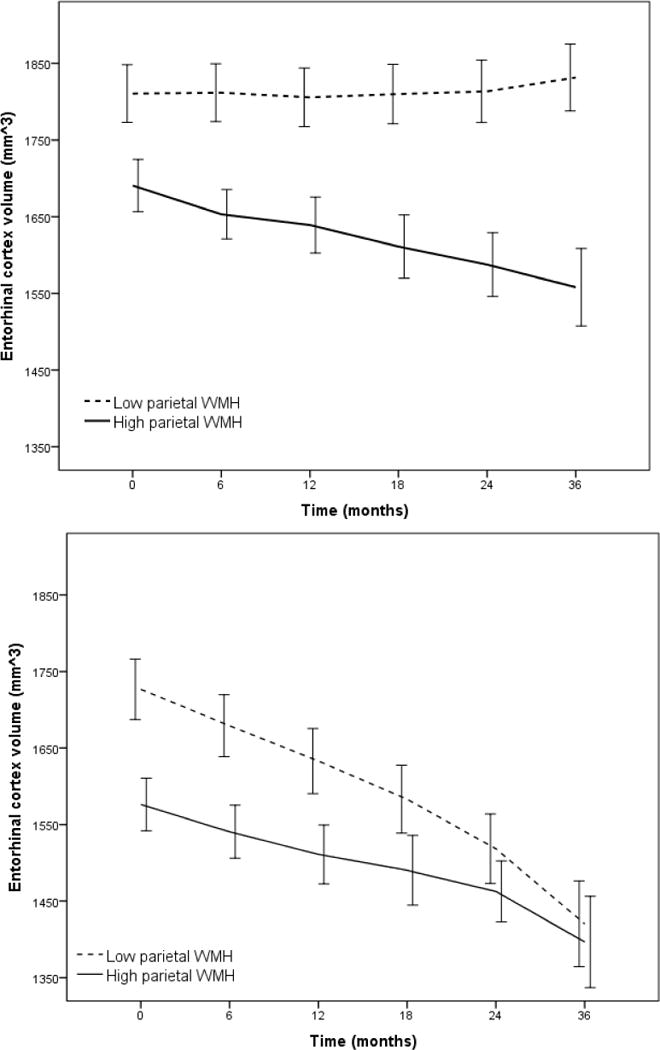
Rate of atrophy of entorhinal cortex volume stratified by total CSF t-tau level (Low t-tau top panel, High t-tau bottom panel) as a function of parietal white matter hyperintensity (WMH) volume dichotomized by mean log WMH value (for visualization purposes). Entorhinal cortex atrophy was particularly precipitous among individuals with low baseline CSF t-tau. Error bars are 95% confidence intervals.
Progression to clinical AD
Among regional WMH volumes, only baseline parietal WMH volume predicted conversion to AD at a trend level (HR=1.07, CI=0.99–1.16; p=0.077). When baseline t-tau level and its interaction with baseline parietal lobe WMH volumes were introduced, the model predicted time to conversion to AD (HR=1.25, CI=1.02–1.54; p=0.035); those with high t-tau levels had a 25% increase in the risk of incident AD for every cm3 increase in parietal lobe WMH compared with participants with low t-tau. None of the other baseline regional WMH volumes interacted with t-tau to predict progression to AD and none of the covariates were associated with incident AD. The results were unchanged after introducing Aβ42 as an additional covariate. Also, the results were specific for the parietal lobe; for example, when considering the total WMH volume, the interaction between WMH volume and tau levels on progression to clinical AD was not significant (HR=1.26, CI=0.96–1.64, p=0.09). Figure 2 displays the results of the Cox regression analysis.
Figure 2.
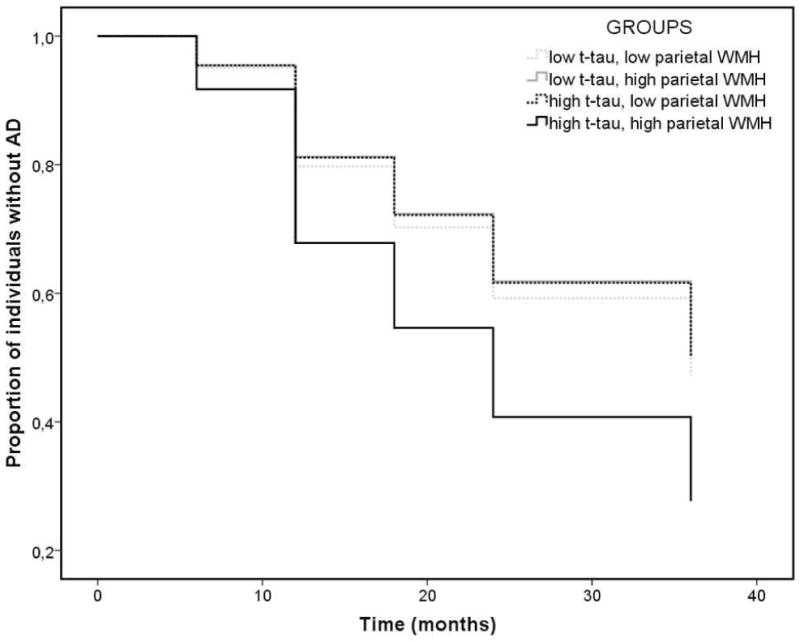
Cox regression survival analysis: time to event (conversion from MCI to AD status) as a function of parietal white matter hyperintensity (WMH) volume and t-tau. Compared with participants with low t-tau, those with high t-tau had a 25% increase in the risk of incident AD for every 1 cm3 increase in parietal lobe WMH. High and low t-tau groups are defined by cut score of 93 mg/ml, according to previous studies in ADNI [36]. High and low parietal lobe WMH groups are defined by the mean log parietal lobe WMH volume for graphical purposes only.
Rate of change of CSF t-tau
Parietal and occipital WMH volumes at baseline were associated with rate of change of t-tau, which increased on an average of 0.21 pg/ml per year over 3 years (β= 0.21, p=0.04). Figure 3 displays t-tau change over 36 months as a function of baseline parietal lobe WMH volume. On the contrary, t-tau at baseline did not predict WMH change over time (β= 0.009, p=0.27).
Figure 3.
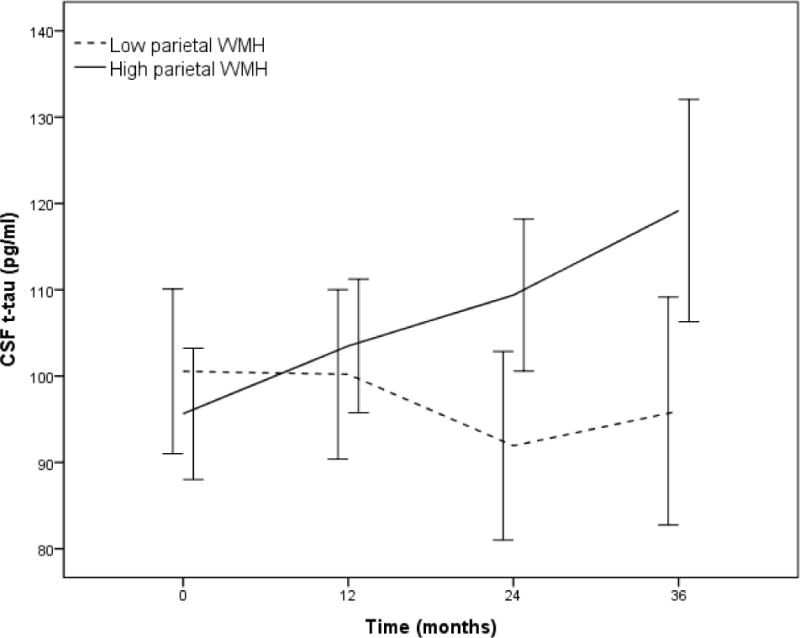
Rate of change of CSF total-tau (t-tau) level over 36-months stratified by mean log parietal lobe white matter hyperintensity (WMH) volume (for descriptive purposes). Individuals with higher baseline parietal lobe WMH had more rapid increase in CSF t-tau than those with lower amounts of parietal lobe WMH. Error bars are 95% confidence intervals.
Discussion
We examined whether regional WMH volume predicts neurodegeneration and change in clinical status independently or synergistically with respect to markers of tau pathology among individuals with MCI. Several important findings were observed. As expected, greater tau predicted greater rate of entorhinal cortex atrophy, but this association was modified by WMH burden; participants with lower levels of tau pathology had a higher rate of atrophy if they also had increased WMH burden.
Consistent with current pathogenic models of AD [21] [22], increased tau burden is clearly a primary source of neurodegeneration, but when tau levels are low, regionally distributed WMH burden has an important impact on neurodegeneration. However, elevated WMH, particularly in the parietal lobes, also predicted progression from MCI to AD and this association was particularly strong among individuals with high levels of tau; those with both high tau and high parietal lobe WMH were at particularly high risk of conversion to AD. Taken together, the findings suggest that regionally distributed WMH influence AD in two ways: first, by promoting neurodegenerative changes directly and second, by potentiating the effect of tau on clinical conversion (Figure 4). Two notable observations in this study help explain the nature of the interaction between tau pathology and WMH. First, we showed that WMH predict the increase in CSF tau over time, but tau levels do not predict the accumulation of WMH over time. Second, careful examination of the interaction between tau levels and parietal lobe WMH volumes on progression of entorhinal cortex atrophy, displayed in Figure 1, suggests a biological ordering where the effect of WMH on entorhinal cortex atrophy precedes the effect of tau on entorhinal cortex atrophy. That is, among individuals with lower levels of tau, only those with higher amounts of parietal lobe WMH have reliable decline in entorhinal cortex volume. On the other hand, among those with high levels of tau both those with high and low parietal WMH volumes show a similarly precipitous decline in entorhinal cortex volume; in addition, their baseline entorhinal cortex volumes (i.e., the intercept in the lower panel of Figure 1) are similar to the entorhinal cortex volumes observed at the last follow-up visit for individuals with low levels of tau (i.e. values at 36-month interval in the top panel of Figure 1). We therefore speculate that accumulating parietal lobe WMH is a relatively early phenomenon that promotes neurodegeneration among individuals with MCI and that t-tau and WMH do not necessarily represent two independent sources of impairment that have additive impact, but rather are biologically linked. It should be noted that research on the ordering of the biological and clinical changes in AD are inherently biased by the measurement precision of relevant variables; it is possible that the measurement of WMH in ADNI, which was not designed to examine cerebrovascular disease, may be less precise than other biological markers.
Figure 4.
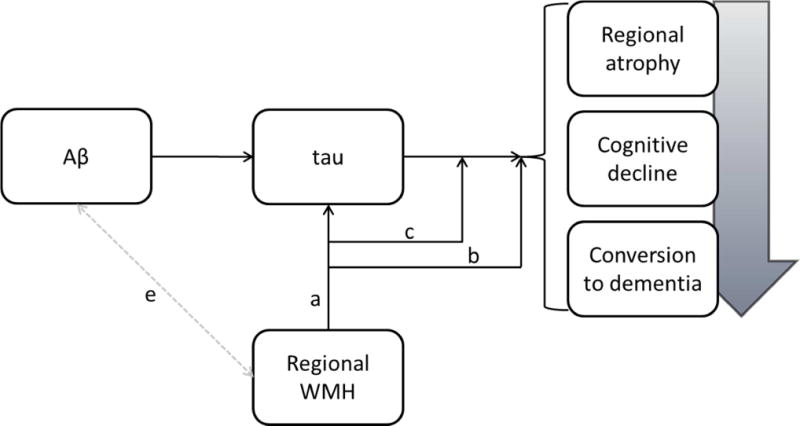
Conceptual model linking WMH to clinical progression in AD. Current pathogenic models of the disease emphasize the precipitating role of Aβ, which leads to tau pathology, resulting in regional atrophy, cognitive decline, and conversion to dementia. Results from this study suggest that regional WMH affect tau directly (a), affect markers of disease progression (i.e., regional atrophy and clinical progression) directly (b), and modify the effect of tau on disease progression (c). Whether or how regional WMH and Aβ interact needs to be elucidated (e).
Although we found that WMH volume distributed in several regions is important for clinical outcomes, elevated burden in the parietal lobes was most consistent. Our study is in line with a recent report [20] that showed that neurologically healthy older adults or patients diagnosed with MCI who progressed to AD over a 6-year interval were more likely to have high levels of parietal lobe WMH at baseline if their CSF-derived measures of tau were normal. Together with our previous reports that implicate parietal lobe-distributed WMH in individuals at high genetic [16] and clinical [14,15] risk for AD, findings from the current study provide further evidence of the importance of the regional distribution of WMH. The parietal lobes have been implicated in AD pathogenesis and clinical expression for quite some time [40][41]. It is interesting to note that metabolic imaging studies classically point to parietal lobe hypometabolism in AD [42], which is typically interpreted as evidence of dysfunction to neurodegenerative changes in that region. Future studies will need to determine the extent to which metabolic dysfunction in this region is mediated by underlying vascular damage. Further, the propensity for WMH distributed in the parietal lobes to be associated with risk for AD may suggest that the pathology underlying WMH may vary by region. Indeed, in theory, any fluid-restricting pathological change that causes local damage to the white matter can cause hyperintense signal on T2-weighted MRI scans. We [43] have hypothesized that WMH in posterior regions reflects both small vessel ischemic damage and micro-hemorrhagic damage due to cerebral amyloid angiopathy. Alternatively, the pathology underlying the regional distribution of WMH may be uniform, but its clinical impact may vary by region; posterior damage may impact cognitive and functional networks more so than damage to other areas.
While most pathogenic models of AD suggest that tau-related pathology results from Aβ toxicity in AD, tau is a non-specific marker that increases with damage to cells in the brain. When tau levels are elevated in the CSF, it is most likely due to accumulation within neurons and then release into the fluid with the degeneration of those brain cells [44], although theoretically CSF tau levels may reflect degeneration, accumulation of the protein, or both. Neuropathological studies are consistent in demonstrating that tissue damage that result in radiological WMH is likely driven by small vessel ischemic change [45]. Common histological features of WMH include arteriolosclerosis, increased myelin pallor, and complete or incomplete infarction [45–47]. It is therefore conceivable that some tau increases results from the ischemic damage reflected in WMH. This conclusion is indeed a major “take home” message of this study – small vessel cerebrovascular disease is one source of the neurodegenerative changes in AD. A previous study that used data from ADNI [48] showed that WMH volume predicted clinical and cognitive decline, but was not associated with CSF-derived Aβ42 or hippocampal volume. However, that study did not consider regional WMH volume nor examine its impact on tau levels or entorhinal cortex volume, which may be more specific markers for neurodegenerative changes in AD. In the context of the previous report, our study suggests that regional WMH volume may affect AD-related neurodegeneration if not amyloid pathology. There are obvious clinical and theoretical implications for this work. From a clinical perspective, our findings indicate that interventions targeted at reducing the accumulation of WMH or treating their antecedent risk factors could reduce the risk of AD and the rate of neurodegenerative changes. Participants with severe vascular risk and cerebrovascular disease are excluded from participation in ADNI, which, on the one hand, suggests that the impact of WMH may be even greater in the overall population, which includes individuals with more severe cerebrovascular disease, but on the other hand, limits our ability to generalize our findings to individuals with more severe cerebrovascular disease. Results from a recent randomized controlled trial showed that interventions directed at the amelioration of cardiovascular risk factors were successful at slowing down white matter pathology progression in early AD, but had little effect on cognition [49]. Thus we speculate that modification of vascular risk profile would have only little effect when clinical evidence of dementia has already emerged. Future intervention studies should focus on presymptomatic individuals at-risk for AD.
From a theoretical perspective, these findings challenge current hypothetical models of AD pathogenesis [22] and recently-implemented diagnostic criteria [7,8]. Cerebrovascular vascular disease is considered an important “confound” that may help explain variability in symptoms onset rather than playing a primary role in pathogenesis of disease. Our findings add to an accumulating body of work that implicates small vessel disease as an important driver of disease with similar impact as tau pathology. Thus, while amyloid pathology may be necessary for AD but not sufficient to explain the phenomenology of the disease, small vessel cerebrovascular disease, like tau, may represent a “second hit” that is required to produce the neurodegenerative changes and cognitive changes associated with AD.
Research in context.
Systematic review: We reviewed the literature for studies involving WMH and CSF biomarkers as main predictors and brain imaging, neuropsychological testing and clinical diagnosis as main outcomes. Cross-sectional and longitudinal studies were included.
Interpretation: We investigated the role of WMH in promoting pathogenic and clinical changes in AD and its antecedent condition, mild cognitive impairment. WMH impact brain atrophy when tau is not yet elevated. By providing evidence that WMH promotes tau accumulation, we also speculate that WMH is actively involved in the pathogenic processes that result in AD neurodegeneration.
Future directions: Vascular components should be considered in future pathogenic models of AD and incorporated in diagnostic criteria. Future work should consider vascular factors as a treatment or prevention target.
Acknowledgments
Dr. Tosto, Dr. Zimmerman, Dr. Hamilton, Dr. Carmichael, and Dr. Brickman report no disclosures.
All co-authors had full access to the data in the study and takes responsibility for the integrity of the data and the accuracy of the analysis.
Dr. Tosto is supported by grant DoD grant W81XWH-12-1-0013.
Dr. Brickman is supported by NIH grant R01 AG034189.
Data collection and sharing for this project was funded by the Alzheimer’s Disease Neuroimaging Initiative (ADNI) (National Institutes of Health Grant U01 AG024904) and DOD ADNI (Department of Defense award number W81XWH-12-2-0012). ADNI is funded by the National Institute on Aging, the National Institute of Biomedical Imaging and Bioengineering, and through generous contributions from the following: Alzheimer’s Association; Alzheimer’s Drug Discovery Foundation; Araclon Biotech; BioClinica, Inc.; Biogen Idec Inc.; Bristol-Myers Squibb Company; Eisai Inc.; Elan Pharmaceuticals, Inc.; Eli Lilly and Company; EuroImmun; F. Hoffmann-La Roche Ltd and its affiliated company Genentech, Inc.; Fujirebio; GE Healthcare; ; IXICO Ltd.; Janssen Alzheimer Immunotherapy Research & Development, LLC.; Johnson & Johnson Pharmaceutical Research & Development LLC.; Medpace, Inc.; Merck & Co., Inc.; Meso Scale Diagnostics, LLC.; NeuroRx Research; Neurotrack Technologies; Novartis Pharmaceuticals Corporation; Pfizer Inc.; Piramal Imaging; Servier; Synarc Inc.; and Takeda Pharmaceutical Company. The Canadian Institutes of Health Research is providing funds to support ADNI clinical sites in Canada. Private sector contributions are facilitated by the Foundation for the National Institutes of Health (www.fnih.org). The grantee organization is the Northern California Institute for Research and Education, and the study is coordinated by the Alzheimer’s Disease Cooperative Study at the University of California, San Diego. ADNI data are disseminated by the Laboratory for Neuro Imaging at the University of Southern California.
Footnotes
Publisher's Disclaimer: This is a PDF file of an unedited manuscript that has been accepted for publication. As a service to our customers we are providing this early version of the manuscript. The manuscript will undergo copyediting, typesetting, and review of the resulting proof before it is published in its final citable form. Please note that during the production process errors may be discovered which could affect the content, and all legal disclaimers that apply to the journal pertain.
References
- 1.Barnes DE, Yaffe K. The projected effect of risk factor reduction on Alzheimer’s disease prevalence. The Lancet Neurology. 2011;10:819–828. doi: 10.1016/S1474-4422(11)70072-2. [DOI] [PMC free article] [PubMed] [Google Scholar]
- 2.Gorelick PB. Cerebrovascular disease in African Americans. Stroke. 1998;29:2656–2664. doi: 10.1161/01.str.29.12.2656. [DOI] [PubMed] [Google Scholar]
- 3.Helzner EP, Luchsinger JA, Scarmeas N, Cosentino S, Brickman AM, Glymour MM, Stern Y. Contribution of vascular risk factors to the progression in Alzheimer disease. Archives of Neurology. 2009;66:343–348. doi: 10.1001/archneur.66.3.343. [DOI] [PMC free article] [PubMed] [Google Scholar]
- 4.Kivipelto M, Helkala E-L, Laakso MP, Hänninen T, Hallikainen M, Alhainen K, Soininen H, Tuomilehto J, Nissinen A. Midlife vascular risk factors and Alzheimer’s disease in later life: longitudinal, population based study. Bmj. 2001;322:1447–1451. doi: 10.1136/bmj.322.7300.1447. [DOI] [PMC free article] [PubMed] [Google Scholar]
- 5.Luchsinger J, Brickman A, Reitz C, Cho S, Schupf N, Manly J, Tang M, Small S, Mayeux R, DeCarli C, et al. Subclinical cerebrovascular disease in mild cognitive impairment. Neurology. 2009;73:450–456. doi: 10.1212/WNL.0b013e3181b1636a. [DOI] [PMC free article] [PubMed] [Google Scholar]
- 6.Sperling RA, Aisen PS, Beckett LA, Bennett DA, Craft S, Fagan AM, Iwatsubo T, Jack CR, Jr, Kaye J, Montine TJ, et al. Toward defining the preclinical stages of Alzheimer’s disease: Recommendations from the National Institute on Aging-Alzheimer’s Association workgroups on diagnostic guidelines for Alzheimer’s disease. Alzheimer’s & Dementia. 2011;7:280–292. doi: 10.1016/j.jalz.2011.03.003. [DOI] [PMC free article] [PubMed] [Google Scholar]
- 7.Albert MS, DeKosky ST, Dickson D, Dubois B, Feldman HH, Fox NC, Gamst A, Holtzman DM, Jagust WJ, Petersen RC, et al. The diagnosis of mild cognitive impairment due to Alzheimer’s disease: Recommendations from the National Institute on Aging-Alzheimer’s Association workgroups on diagnostic guidelines for Alzheimer’s disease. Alzheimer’s & Dementia. 2011;7:270–279. doi: 10.1016/j.jalz.2011.03.008. [DOI] [PMC free article] [PubMed] [Google Scholar]
- 8.McKhann GM, Knopman DS, Chertkow H, Hyman BT, Jack CR, Jr, Kawas CH, Klunk WE, Koroshetz WJ, Manly JJ, Mayeux R, et al. The diagnosis of dementia due to Alzheimer’s disease: Recommendations from the National Institute on Aging-Alzheimer’s Association workgroups on diagnostic guidelines for Alzheimer’s disease. Alzheimer’s & Dementia. 2011;7:263–269. doi: 10.1016/j.jalz.2011.03.005. [DOI] [PMC free article] [PubMed] [Google Scholar]
- 9.Wen W, Sachdev P. The topography of white matter hyperintensities on brain MRI in healthy 60-to 64-year-old individuals. Neuroimage. 2004;22:144–154. doi: 10.1016/j.neuroimage.2003.12.027. [DOI] [PubMed] [Google Scholar]
- 10.Brickman AM, Siedlecki KL, Muraskin J, Manly JJ, Luchsinger JA, Yeung L-K, Brown TR, DeCarli C, Stern Y. White matter hyperintensities and cognition: Testing the reserve hypothesis. Neurobiology of aging. 2011;32:1588–1598. doi: 10.1016/j.neurobiolaging.2009.10.013. [DOI] [PMC free article] [PubMed] [Google Scholar]
- 11.Tosto G, Zimmerman ME, Carmichael OT, Brickman AM, Initiative ADN, et al. Predicting Aggressive Decline in Mild Cognitive Impairment: The Importance of White Matter Hyperintensities. JAMA neurology. 2014 doi: 10.1001/jamaneurol.2014.667. [DOI] [PMC free article] [PubMed] [Google Scholar]
- 12.Brickman AM, Honig LS, Scarmeas N, Tatarina O, Sanders L, Albert MS, Brandt J, Blacker D, Stern Y. Measuring cerebral atrophy and white matter hyperintensity burden to predict the rate of cognitive decline in Alzheimer disease. Archives of neurology. 2008;65:1202–1208. doi: 10.1001/archneur.65.9.1202. [DOI] [PMC free article] [PubMed] [Google Scholar]
- 13.Provenzano FA, Muraskin J, Tosto G, Narkhede A, Wasserman BT, Griffith EY, Guzman VA, Meier IB, Zimmerman ME, Brickman AM, et al. White matter hyperintensities and cerebral amyloidosis: necessary and sufficient for clinical expression of Alzheimer disease? JAMA neurology. 2013;70:455–461. doi: 10.1001/jamaneurol.2013.1321. [DOI] [PMC free article] [PubMed] [Google Scholar]
- 14.Brickman AM, Provenzano FA, Muraskin J, Manly JJ, Blum S, Apa Z, Stern Y, Brown TR, Luchsinger JA, Mayeux R. Regional white matter hyperintensity volume, not hippocampal atrophy, predicts incident Alzheimer disease in the community. Archives of neurology. 2012;69:1621–1627. doi: 10.1001/archneurol.2012.1527. [DOI] [PMC free article] [PubMed] [Google Scholar]
- 15.Brickman AM, Zahodne LB, Guzman VA, Narkhede A, Meier IB, Griffith EY, Provenzano FA, Schupf N, Manly JJ, Stern Y, et al. Reconsidering harbingers of dementia: progression of parietal lobe white matter hyperintensities predicts Alzheimer’s disease incidence. Neurobiology of aging. 2014 doi: 10.1016/j.neurobiolaging.2014.07.019. [DOI] [PMC free article] [PubMed] [Google Scholar]
- 16.Brickman AM, Schupf N, Manly JJ. Does APOE-ε4 confer risk for Alzheimer’s disease through regionally distributed white matter hyperintensities? Alzheimer’s & dementia: the journal of the Alzheimer’s Association. 2014 doi: 10.1016/j.jalz.2014.07.155. [DOI] [PMC free article] [PubMed] [Google Scholar]
- 17.Chalmers K, Wilcock G, Love S. Contributors to white matter damage in the frontal lobe in Alzheimer’s disease. Neuropathology and applied neurobiology. 2005;31:623–631. doi: 10.1111/j.1365-2990.2005.00678.x. [DOI] [PubMed] [Google Scholar]
- 18.Haight TJ, Landau SM, Carmichael O, Schwarz C, DeCarli C, Jagust WJ. Dissociable effects of Alzheimer disease and white matter hyperintensities on brain metabolism. JAMA neurology. 2013;70:1039–1045. doi: 10.1001/jamaneurol.2013.1878. [DOI] [PMC free article] [PubMed] [Google Scholar]
- 19.Polvikoski T, van Straaten E, Barkhof F, Sulkava R, Aronen H, Niinistö L, Oinas M, Scheltens P, Erkinjuntti T, Kalaria R. Frontal lobe white matter hyperintensities and neurofibrillary pathology in the oldest old. Neurology. 2010;75:2071–2078. doi: 10.1212/WNL.0b013e318200d6f9. [DOI] [PMC free article] [PubMed] [Google Scholar]
- 20.Hertze J, Palmqvist S, Minthon L, Hansson O. Tau pathology and parietal white matter lesions have independent but synergistic effects on early development of Alzheimer’s disease. Dementia and geriatric cognitive disorders extra. 2013;3:113–122. doi: 10.1159/000348353. [DOI] [PMC free article] [PubMed] [Google Scholar]
- 21.Jack CR, Jr, Knopman DS, Jagust WJ, Shaw LM, Aisen PS, Weiner MW, Petersen RC, Trojanowski JQ. Hypothetical model of dynamic biomarkers of the Alzheimer’s pathological cascade. The Lancet Neurology. 2010;9:119–128. doi: 10.1016/S1474-4422(09)70299-6. [DOI] [PMC free article] [PubMed] [Google Scholar]
- 22.Jack CR, Jr, Knopman DS, Jagust WJ, Petersen RC, Weiner MW, Aisen PS, Shaw LM, Vemuri P, Wiste HJ, Weigand SD, et al. Tracking pathophysiological processes in Alzheimer’s disease: an updated hypothetical model of dynamic biomarkers. The Lancet Neurology. 2013;12:207–216. doi: 10.1016/S1474-4422(12)70291-0. [DOI] [PMC free article] [PubMed] [Google Scholar]
- 23.Hyman BT, Trojanowski JQ. Editorial on consensus recommendations for the postmortem diagnosis of Alzheimer disease from the National Institute on Aging and the Reagan Institute Working Group on diagnostic criteria for the neuropathological assessment of Alzheimer disease. Journal of Neuropathology & Experimental Neurology. 1997;56:1095–1097. doi: 10.1097/00005072-199710000-00002. [DOI] [PubMed] [Google Scholar]
- 24.Zhao Q, Lv Y, Zhou Y, Hong Z, Guo Q. Short-term delayed recall of auditory verbal learning test is equivalent to long-term delayed recall for identifying amnestic mild cognitive impairment. PloS one. 2012;7:e51157. doi: 10.1371/journal.pone.0051157. [DOI] [PMC free article] [PubMed] [Google Scholar]
- 25.Elias MF, Beiser A, Wolf PA, Au R, White RF, D’Agostino RB. The preclinical phase of Alzheimer disease: a 22-year prospective study of the Framingham Cohort. Archives of Neurology. 2000;57:808–813. doi: 10.1001/archneur.57.6.808. [DOI] [PubMed] [Google Scholar]
- 26.Hachinski VC, Iliff LD, Zilhka E, Du Boulay GH, McAllister VL, Marshall J, Russell RWR, Symon L. Cerebral blood flow in dementia. Archives of neurology. 1975;32:632–637. doi: 10.1001/archneur.1975.00490510088009. [DOI] [PubMed] [Google Scholar]
- 27.Morris JC. The Clinical Dementia Rating (CDR): current version and scoring rules. Neurology. 1993 doi: 10.1212/wnl.43.11.2412-a. [DOI] [PubMed] [Google Scholar]
- 28.Folstein MF, Folstein SE, McHugh PR. “Mini-mental state”: a practical method for grading the cognitive state of patients for the clinician. Journal of psychiatric research. 1975;12:189–198. doi: 10.1016/0022-3956(75)90026-6. [DOI] [PubMed] [Google Scholar]
- 29.Yesavage JA, Brink T, Rose TL, Lum O, Huang V, Adey M, Leirer VO. Development and validation of a geriatric depression screening scale: a preliminary report. Journal of psychiatric research. 1983;17:37–49. doi: 10.1016/0022-3956(82)90033-4. [DOI] [PubMed] [Google Scholar]
- 30.Weiner MW, Aisen PS, Jack CR, Jr, Jagust WJ, Trojanowski JQ, Shaw L, Saykin AJ, Morris JC, Cairns N, Beckett LA, et al. The Alzheimer’s disease neuroimaging initiative: progress report and future plans. Alzheimer’s & Dementia. 2010;6:202–211. doi: 10.1016/j.jalz.2010.03.007. [DOI] [PMC free article] [PubMed] [Google Scholar]
- 31.Jack CR, Bernstein MA, Fox NC, Thompson P, Alexander G, Harvey D, Borowski B, Britson PJL, Whitwell J, Ward C, et al. The Alzheimer’s disease neuroimaging initiative (ADNI): MRI methods. Journal of Magnetic Resonance Imaging. 2008;27:685–691. doi: 10.1002/jmri.21049. [DOI] [PMC free article] [PubMed] [Google Scholar]
- 32.Schwarz C, Fletcher E, DeCarli C, Carmichael O. Fully-automated white matter hyperintensity detection with anatomical prior knowledge and without FLAIR. Information processing in medical imaging. 2009:239–251. doi: 10.1007/978-3-642-02498-6_20. [DOI] [PMC free article] [PubMed] [Google Scholar]
- 33.Birdsill AC, Koscik RL, Jonaitis EM, Johnson SC, Okonkwo OC, Hermann BP, LaRue A, Sager MA, Bendlin BB. Regional white matter hyperintensities: aging, Alzheimer’s disease risk, and cognitive function. Neurobiology of aging. 2014;35:769–776. doi: 10.1016/j.neurobiolaging.2013.10.072. [DOI] [PMC free article] [PubMed] [Google Scholar]
- 34.Wolz R, Julkunen V, Koikkalainen J, Niskanen E, Zhang DP, Rueckert D, Soininen H, Lötjönen J, Initiative ADN, et al. Multi-method analysis of MRI images in early diagnostics of Alzheimer’s disease. PloS one. 2011;6:e25446. doi: 10.1371/journal.pone.0025446. [DOI] [PMC free article] [PubMed] [Google Scholar]
- 35.DeCarli C, Murphy D, Teichberg D, Campbell G, Sobering G. Local histogram correction of MRI spatially dependent image pixel intensity nonuniformity. Journal of Magnetic Resonance Imaging. 1996;6:519–528. doi: 10.1002/jmri.1880060316. [DOI] [PubMed] [Google Scholar]
- 36.Shaw LM, Vanderstichele H, Knapik-Czajka M, Clark CM, Aisen PS, Petersen RC, Blennow K, Soares H, Simon A, Lewczuk P, et al. Cerebrospinal fluid biomarker signature in Alzheimer’s disease neuroimaging initiative subjects. Annals of neurology. 2009;65:403–413. doi: 10.1002/ana.21610. [DOI] [PMC free article] [PubMed] [Google Scholar]
- 37.Wyman BT, Harvey DJ, Crawford K, Bernstein MA, Carmichael O, Cole PE, Crane PK, DeCarli C, Fox NC, Gunter JL, et al. Standardization of analysis sets for reporting results from ADNI MRI data. Alzheimer’s & Dementia. 2013;9:332–337. doi: 10.1016/j.jalz.2012.06.004. [DOI] [PMC free article] [PubMed] [Google Scholar]
- 38.Wechsler D. Wechsler Memory Scale-Revised 1987 [Google Scholar]
- 39.Liang K-Y, Zeger SL. Longitudinal data analysis using generalized linear models. Biometrika. 1986;73:13–22. [Google Scholar]
- 40.Bruner E, Jacobs HI. Alzheimer’s disease: the downside of a highly evolved parietal lobe? Journal of Alzheimer’s Disease. 2013;35:227–240. doi: 10.3233/JAD-122299. [DOI] [PubMed] [Google Scholar]
- 41.Jacobs HI, Van Boxtel MP, Jolles J, Verhey FR, Uylings H. Parietal cortex matters in Alzheimer’s disease: an overview of structural, functional and metabolic findings. Neuroscience & Biobehavioral Reviews. 2012;36:297–309. doi: 10.1016/j.neubiorev.2011.06.009. [DOI] [PubMed] [Google Scholar]
- 42.Ishii K, Sasaki H, Kono AK, Miyamoto N, Fukuda T, Mori E. Comparison of gray matter and metabolic reduction in mild Alzheimer’s disease using FDG-PET and voxel-based morphometric MR studies. European journal of nuclear medicine and molecular imaging. 2005;32:959–963. doi: 10.1007/s00259-004-1740-5. [DOI] [PubMed] [Google Scholar]
- 43.Brickman AM. Contemplating Alzheimer’s Disease and the Contribution of White Matter Hyperintensities. Current neurology and neuroscience reports. 2013;13:1–9. doi: 10.1007/s11910-013-0415-7. [DOI] [PMC free article] [PubMed] [Google Scholar]
- 44.Fazekas F, Kleinert R, Offenbacher H, Schmidt R, Kleinert G, Payer F, Radner H, Lechner H. Pathologic correlates of incidental MRI white matter signal hyperintensities. Neurology. 1993;43:1683–1683. doi: 10.1212/wnl.43.9.1683. [DOI] [PubMed] [Google Scholar]
- 45.Erten-Lyons D, Woltjer R, Kaye J, Mattek N, Dodge HH, Green S, Tran H, Howieson DB, Wild K, Silbert LC. Neuropathologic basis of white matter hyperintensity accumulation with advanced age. Neurology. 2013;81:977–983. doi: 10.1212/WNL.0b013e3182a43e45. [DOI] [PMC free article] [PubMed] [Google Scholar]
- 46.Jagust WJ, Zheng L, Harvey DJ, Mack WJ, Vinters HV, Weiner MW, Ellis WG, Zarow C, Mungas D, Reed BR, Kramer JH, Schuff N, DeCarli C, Chui HC. Neuropathological basis of magnetic resonance images in aging and dementia. Ann Neurol. 2008;63:72–80. doi: 10.1002/ana.21296. [DOI] [PMC free article] [PubMed] [Google Scholar]
- 47.Fazekas F, Kleinert R, Offenbacher H, Schmidt R, Kleinert G, Payer F, Radner H, Lechner H. Pathologic correlates of incidental MRI white matter signal hyperintensities. Neurology. 1993;43:1683–1683. doi: 10.1212/wnl.43.9.1683. [DOI] [PubMed] [Google Scholar]
- 48.Lo RY, Jagust WJ, Weiner M, Aisen P, Petersen R, Jack CR, Jagust W, Trojanowki JQ, Toga AW, Beckett L, et al. Vascular burden and Alzheimer disease pathologic progression. Neurology. 2012;79:1349–1355. doi: 10.1212/WNL.0b013e31826c1b9d. [DOI] [PMC free article] [PubMed] [Google Scholar]
- 49.Richard E, Gouw AA, Scheltens P, van Gool WA. Vascular Care in Patients With Alzheimer Disease With Cerebrovascular Lesions Slows Progression of White Matter Lesions on MRI The Evaluation of Vascular Care in Alzheimer’s Disease (EVA) Study. Stroke. 2010;41:554–556. doi: 10.1161/STROKEAHA.109.571281. [DOI] [PubMed] [Google Scholar]