

Abstract
Introduction
In Down syndrome (DS), the overproduction of amyloid precursor protein is hypothesized to predispose young adults to early expression of Alzheimer-like neuropathology.
Methods
PET imaging with [11C]PiB examined the pattern of amyloid-β deposition in 68 nondemented adults with DS (30-53 years) to determine the relationship between deposition and normal aging. Standard uptake value ratio (SUVR) images were created with cerebellum as the reference region.
Results
Multiple linear regression revealed slight but highly significant (corrected p<0.05) positive correlations between SUVR and age. The striatum showed the strongest correlation, followed by precuneus, parietal cortex, anterior cingulate, frontal cortex, and temporal cortex.
Conclusion
There is an age-related amyloid-β deposition in the DS population, but as a pattern of elevated cortical retention becomes apparent, the correlation of SUVR with age ceases to be significant. Factors unrelated to aging may drive an increase in deposition during early Alzheimer's disease pathogenesis.
Keywords: Down syndrome, Alzheimer's disease, amyloid imaging, PiB, aging
1. Introduction
Down syndrome is the most common intellectual developmental disorder, occurring from one in every 319 births to one in every 1000 births depending on maternal age and differing by population [1-3]. The complex phenotype of Down syndrome is a cumulative effect of the increased concentration of many gene products and genomic imbalance. The majority (95%) of Down syndrome cases result from a triplication of chromosome 21 and thus a triplication of the gene encoding for the amyloid precursor protein (APP). APP is spliced into variously sized proteins (40-44 amino acids) that aggregate into amyloid-β plaques. The biphasic model of Alzheimer's disease pathogenesis hypothesizes amyloid-β deposition to be the initiating event preceding neurofibrillary tangles, brain atrophy, and cognitive decline [4]. This hypothesis has also been stated in the concept of biomarker changes [5]. Studies have shown that young adults with Down syndrome develop dementia of the Alzheimer's type, preferentially over populations of other mental handicaps [6,7].
Down syndrome is characterized by premature aging, rather than accelerated aging. Consequently, a similar pathogenesis of dementia has been suggested to exist between Down syndrome and Alzheimer's disease. Post mortem studies found the presence of Alzheimer-like neuropathological changes in the Down syndrome population as early as the fifth decade [4,8]. Furthermore, the amyloid-β plaques and neurofibrillary tangles appear to be indistinguishable between the Down syndrome population and the non-Down syndrome population using electron microscopy [9,10]. Conversion to dementia in the Down syndrome population increases from 11% to 77% from the fourth decade to the sixth decade with a mean age of onset of 56 years [11]. The prevalence of dementia in the Down syndrome population is markedly different from that in a non-Down syndrome population in which conversion to dementia increases from less than 5% to 13% from ages less than 65 to ages greater than 65 years [12].
In cross-sectional post mortem analyses of Down syndrome brains, Alzheimer-like neuropathological changes have been observed to increase in frequency with age [13,14]. However, the association between Down syndrome and Alzheimer's disease is not invariant; some adults with Down syndrome may reach middle age without developing dementia despite exhibiting amyloid-β plaques and neurofibrillary tangles [15].
PET studies using [11C]PiB have shown a slow asymptomatic increase in amyloid-β deposition with age in 20-40% of a cognitively normal population as early as two decades before the onset of dementia [16]. This suggests that the accumulation of amyloid-β plaques is not enough to cause dementia, and that the pattern of deposition may have a more causative role in the conversion to dementia. While [11C]PiB retention is a continuous variable, it can be useful to categorize subjects as PiB positive or PiB negative based on a threshold value. Once the natural relationship is discovered, it can be used to distinguish between the effects of aging and disease state on the accumulation of amyloid-β.
Previously, our groups have shown [11C]PiB imaging to be a viable technique for scanning the Down syndrome population and found significant amyloid-β binding in adults older than 45 years [17,18]. One study found that the Down syndrome population could withstand early amyloid-β deposition without suffering cognitive decline [18]. The present study used [11C]PiB imaging to investigate the early pathogenesis of Alzheimer's disease in a nondemented population of adults with Down syndrome. The primary goal was to determine the degree of correlation between amyloid-β deposition and age. A characterization of the pattern of early amyloid-β deposition in the brain would provide additional insight into the pathogenesis of Alzheimer's disease in this population.
2. Materials and Methods
2.1 Participants
The sample of 72 participants presented herein (38 male, 34 female) was drawn from the baseline scan of an ongoing NIH funded longitudinal study at our facilities with 40 scanned at the University of Wisconsin-Madison and 32 scanned at the University of Pittsburgh. Subjects were recruited from a number of programs serving adults with DS and developmental disabilities (located within 3-5 hours of the two performance sites). Thus, the sample was not consecutively recruited. Subjects were considered telephone screen “failures” for a variety of reasons, including limited expressive language skills, a prior diagnosis of dementia, as well as conditions that might contraindicate an MRI (e.g., claustrophobia, metal in the body).
All participants had Trisomy 21 confirmed through genetic testing and were aged 30-53 years (37.5 ± 7.07 years). Participants were genotyped and tested for the APOE4 allele, where APOE4 positive included both heterozygous (n=7) and homozygous (n=1) participants. Two participants were excluded from the analysis due to a lack of genotype information. Measures of cerebrovascular risk factors were not recorded. All participants were classified as asymptomatic based on the Dementia Scale for Down Syndrome (a cognitive cutoff score of less than 3), a 60-item measure with favorable specificity and sensitivity. Participants were screened, but not excluded, for any Alzheimer's disease medications; none were found to be taking any memory enhancing drug or other Alzheimer's disease medications. This study excluded based on any medical or psychiatric condition that would impair cognitive function. Two participants were excluded from analysis due to issues with PET or MR images (one for no T1 MRI scan and one for being unable to complete the PET scan). Information for the 68 included participants can be found in Table 1.
Table 1. Participant characteristics.
| PiB Positive (n=17) | PiB Negative (n=51) | P value | |
|---|---|---|---|
| Male, % (n) | 70.6 (12) | 49.0 (25) | 0.1220 |
| Age, mean (SD) | 44.9 (4.5) | 35.1 (6.0) | 2.061 × 10⁻⁸ |
| APOE status, % (n) | 0.3847 | ||
| E2/E2 | 5.6 (1) | 0.0 (0) | |
| E2/E3 | 16.7 (3) | 23.1 (12) | |
| E3/E3 | 61.1 (11) | 67.3 (35) | |
| E3/E4 | 16.7 (3) | 7.7 (4) | |
| E4/E4 | 0.0 (0) | 1.9 (1) |
2.2 Image Acquisition and Analysis
2.2.1 MR scans
T1-weighted 3.0 T MR scans were acquired on GE SIGNA 750 (UW-Madison) and Siemens Magnetom Trio (UP-Medical Center) MR scanners to provide structural information for intermodality registration, spatial normalization, and brain region definition. The SIGNA 750 acquired MR data using a high resolution volumetric spoiled gradient (TI/TE/TR = 450/3.2/8.2ms, flip angle = 12°, slice thickness = 1mm no gap, FOV=256, matrix size = 256×256), while the Magnetom Trio scanner acquired MR data using a MPRAGE sequence (TI/TE/TR = 900/2.98/2300ms, flip angle = 9°, slice thickness = 1.2 mm, FOV = 240×256 mm, matrsix size = 160×240×256).
2.2.2 PET scans
On-site chemical synthesis of [11C]PiB yielded high specific activity (in excess of 2000 mCi/μmol) in batches of at least 40 mCi. Up to 15 mCi of [11C]PiB was delivered intravenously through a catheter by bolus injection (20-30s). PET data were acquired on Siemens ECAT HR+ PET scanners at both sites. A 68Ge/68Ga transmission scan was acquired for 6-10 minutes to correct for attenuation of annihilation radiation. Subjects were positioned in the PET scanner for a 30 minute acquisition following an uptake period of 40 minutes (40 -70 minutes post-injection). Time series PET data were reconstructed with a filtered back-projection algorithm (Direct Inverse Fourier Transform) and were corrected for attenuation, detection deadtime, scanner normalization, scatter, and radioactive decay.
2.2.3 Image Processing
Automated methods for PET/MR registration re-oriented the images along the anterior-posterior commissure. Interframe motion was corrected on a frame-by-frame basis prior to further processing. Standard uptake values were calculated from 50-70 minutes post-injection to assess [11C]PiB retention, as previously validated [19]. Standard uptake value ratios (SUVRs) were calculated as the ratio of the standard uptake value in a voxel divided by that in cerebellar grey matter [20-22]. The full extent of the cerebellum was sampled in native space for all subjects.
Normalization to a standard space was performed by transforming all SUVR images to a study-specific PET [11C]PiB template. Skull-stripped MR images were spatially normalized to a skull-stripped version of the default SPM8 (www.fil.ion.ac.uk/spm/software/) T1-MRI template image (MNI space). The transformation matrix in the spatial normalization step was also applied to the coregistered SUVR image so that they were also transformed into MNI space. Due to complications introduced by the variable brain morphology and MR motion of several of the Down syndrome participants, a study-specific PET DS template was created by choosing a subset of normalized SUVR images, smoothing them with an 8 mm isotropic Gaussian kernel convolution, and averaging them together. All of the unsmoothed native space SUVR images were spatially normalized to the study-specific PET DS template, and the transformation matrix was applied to the coregistered native space MR image for visualization and between subject comparison. The normalized images were visually inspected in cine mode and judged based on cortical outline and striatal placement and no images were removed due to poor spatial normalization.
Region of interest (ROI) definition was automated in SPM8 using the Wake Forest University pick atlas toolbox and consisted of the frontal cortex, anterior cingulate gyrus, parietal cortex, temporal cortex, precuneus cortex, and striatum (see 2.2.4 Statistical Analysis for justification of regions). ROI binary masks were created in MNI space and subsequently smoothed by a 4 mm isotropic Gaussian kernel convolution to approximate the resolution of the PET data. The smoothed ROI masks were made binary again using an intensity threshold of 0.3. The dilated ROI masks helped to account for the intersubject variability in brain morphology. The ROI masks were closely inspected to ensure proper overlay on each subject for each region. The ROI masks were applied to the SUVR images—normalized to the PET DS template and to the T1 MRI template—of the subjects without motion (n=52). The mean percent difference and standard deviation between the two normalization methods was -0.88±1.97%. The distinction of a study-specific DS template was to make readers aware of the unconventional approach to normalization (PET to PET rather than MRI to MRI) rather than to signify a different template space.
It is important to be able to distinguish the effects of normal aging from the effects of preclinical Alzheimer's disease along the continuum of amyloid-β deposition. The PiB positivity SUVR thresholds were determined by sparse k-means clustering with resampling by a previously described process [23], modified to be applicable to the non-atrophy-corrected data. Data from the same 68 cognitively normal elderly controls used for the atrophy-corrected cutoffs reported by Cohen et al. (2013) and used in our previous report [18] were used for the non-atrophy-corrected cutoffs reported here. The threshold values were: anterior cingulate = 1.59, frontal cortex = 1.48, parietal cortex = 1.51, precuneus = 1.64, striatum = 1.45, and temporal cortex =1.37. A subject with a mean ROI SUVR above the cutoff in any of the six ROIs was classified as a PiB positive subject.
2.2.4 Statistical Analysis
Multiple linear regression models tested the correlation between SUVR and age, including sex and APOE4 allele status as covariates in SPM8. A family-wise error rate corrected p-value of 0.05 was used to conservatively determine statistical significance. A cluster size threshold of five voxels (voxel size= 2×2×2 mm3), which is approximately the size of one resolution element, was applied to the parametric t-image to exclude single voxels that appeared significant by chance alone. Only clusters surviving the multiple comparisons correction and cluster size threshold were addressed.
The six brain regions were investigated for containing at least one cluster in which voxels were found to have a significant correlation between [11C]PiB SUVR and age in the whole cohort. After categorizing the subjects into PiB positive and PiB negative groups, unpaired t-tests and chi-squared tests were used to find significant differences in gender, age, and APOE4 allele frequency. The striatum was highly influential in PiB positive participants. Consequently, a paired t-test was used to test for a significant difference in SUVR of the caudate and putamen.
A rank test was performed to determine the relative importance of each region in terms of amyloid-β deposition and differentiate a pattern of selective burdening. The mean SUVR was calculated for each ROI and ranked in descending order within each subject, then compared across the sample population. For instance, one participant had the following mean SUVRs: anterior cingulate = 1.23, frontal cortex = 1.06, parietal cortex = 1.09, precuneus = 1.15, striatum = 1.20, temporal cortex = 1.08. Therefore the ranks for that participant would be: anterior cingulate (1), striatum (2), precuneus (3), parietal cortex (4), temporal cortex (5), frontal cortex (6). A frequency histogram for each ROI was created, binned by rank.
3. Results
Visual inspection of [11C]PiB binding revealed three general patterns: only nonspecific white matter retention (n=45), elevated striatal retention only (n=6), or elevated striatal and cortical retention (n=17) (Fig. 1). The anterior cingulate, frontal cortex, parietal cortex, precuneus, striatum, and temporal cortex were identified across the sample population as regions of elevated [11C]PiB retention. Patterns of elevated cortical retention were only observed in participants older than 35 years.
Figure 1.
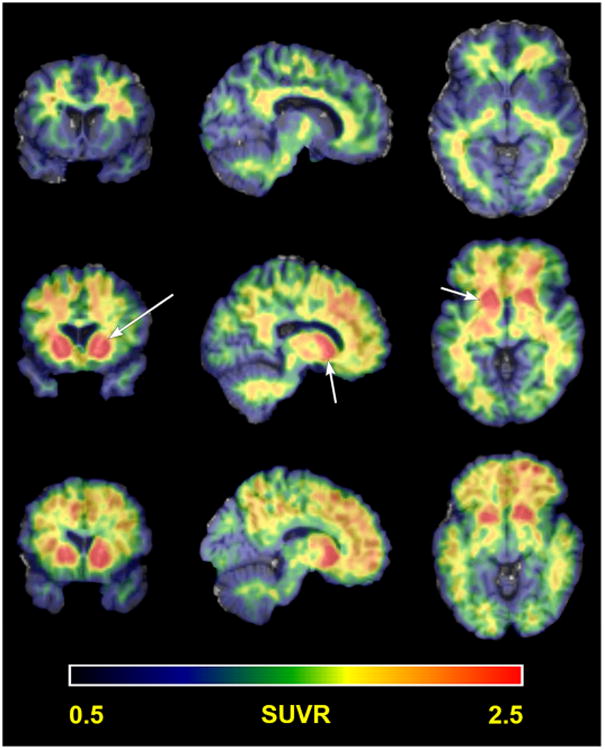
Patterns of [11C]PiB retention. Representative subjects showing the three general patterns of [11C]PiB SUVR in a common slice (52,71,43): nonspecific white matter uptake (top row), elevated striatal uptake only (middle row), and elevated striatal and cortical uptake (bottom row). Arrows in the middle row denote the striatum.
Table 2 shows the results of a voxel-wise analysis of the entire cohort, which was limited to the most statistically significant voxel within each region. All regions showed a slight but highly statistically significant positive correlation of SUVR with age. The striatum showed the strongest correlation, followed by the precuneus and parietal cortex, anterior cingulate, and frontal cortex and temporal cortex. The correlation estimate of SUVR with age in the temporal cortex was significantly less than that in the precuneus, parietal cortex, and striatum (P<0.05), but there were not any other significant differences between regions. Upon further inspection of the striatum, the caudate showed a stronger correlation with age than the putamen, but the difference did not reach significance. However, the putamen showed consistently higher SUVRs than the caudate within subjects (P<0.001). Fig. 2 also shows that the correlation of SUVR with age in the putamen has greater significance, based on mean t-value, than that in the caudate (P<0.001).
Table 2. Correlation estimates of [11C]PiB SUVR with age from voxel-wise analysis.
| ROI | Tmax | Z-score | Pcorr | Coordinates in MNI space | Correlation estimate | |||
|---|---|---|---|---|---|---|---|---|
|
| ||||||||
| x | y | z | β1 | [90% Confidence Interval] | ||||
| Whole cohort | ||||||||
| Anterior Cingulate | 6.91 | 5.95 | 3.6 × 10⁻⁶ | 2 | 54 | 2 | 0.0328 | [0.0250, 0.0406] |
| Frontal Cortex | 7.07 | 6.06 | 2.5 × 10⁻⁵ | 0 | 56 | 0 | 0.0298 | [0.0229, 0.0367] |
| Parietal Cortex | 7.72 | 6.47 | 7.8 × 10⁻⁷ | 0 | -60 | 32 | 0.0437 | [0.0344, 0.0531] |
| Precuneus | 7.72 | 6.47 | 4.5 × 10⁻⁷ | 0 | -60 | 32 | 0.0437 | [0.0344, 0.0531] |
| Striatum | ||||||||
| Left | 7.69 | 6.45 | 1.1 × 10⁻⁷ | -20 | 10 | -8 | 0.0544 | [0.0427, 0.0660] |
| Right | 7.50 | 6.33 | 2.3 × 10⁻⁷ | 18 | 10 | -10 | 0.0494 | [0.0386, 0.0603] |
| Caudate | ||||||||
| Left | 6.80 | 5.88 | 1.4 × 10⁻⁶ | -12 | 10 | -2 | 0.0565 | [0.0428, 0.0702] |
| Right | 6.88 | 5.93 | 1.0 × 10⁻⁶ | 12 | 14 | 4 | 0.0589 | [0.0448, 0.0730] |
| Putamen | ||||||||
| Left | 7.69 | 6.45 | 6.6 × 10⁻⁸ | -20 | 10 | -8 | 0.0544 | [0.0427, 0.0660] |
| Right | 7.50 | 6.33 | 1.4 × 10⁻⁷ | 18 | 10 | -10 | 0.0494 | [0.0386, 0.0603] |
| Temporal Cortex | ||||||||
| Left | 5.93 | 5.28 | 7.5 × 10⁻⁴ | -54 | -2 | 4 | 0.0229 | [0.0165, 0.0292] |
| Right | 7.23 | 6.16 | 5.8 × 10⁻⁶ | 58 | -30 | 2 | 0.0315 | [0.0243, 0.0387] |
| PiB negative | ||||||||
| Anterior Cingulate | 5.00 | 4.46 | 9.6 × 10⁻³ | 2 | 44 | -2 | 0.0122 | [0.0082, 0.0162] |
| Frontal Cortex | - | - | - | - | - | - | - | |
| Parietal Cortex | - | - | - | - | - | - | - | |
| Precuneus | 5.29 | 4.66 | 1.2 × 10⁻² | -2 | -54 | 48 | 0.0173 | [0.0119, 0.0227] |
| Striatum | ||||||||
| Left | 5.66 | 4.92 | 1.3 × 10⁻³ | -24 | 10 | -4 | 0.0245 | [0.0174, 0.0317] |
| Right | 7.51 | 6.06 | 2.4 × 10⁻⁶ | 24 | 8 | -4 | 0.0282 | [0.0220, 0.0344] |
| Caudate | ||||||||
| Left | 5.01 | 4.46 | 1.3 × 10⁻³ | -12 | 14 | -4 | 0.0225 | [0.0151, 0.0299] |
| Right | 4.65 | 4.19 | 8.0 × 10⁻³ | 14 | 14 | 2 | 0.0242 | [0.0156, 0.0328] |
| Putamen | ||||||||
| Left | 5.66 | 4.92 | 8.3 × 10⁻⁴ | -24 | 10 | -4 | 0.0245 | [0.0174, 0.0317] |
| Right | 7.52 | 6.06 | 1.4 × 10⁻⁶ | 24 | 8 | -4 | 0.0282 | [0.0220, 0.0344] |
| Temporal Cortex | - | - | - | - | - | - | - | |
| PiB positive | ||||||||
| No significant correlations were observed | ||||||||
[11C]PiB = carbon-11 labeled Pittsburgh compound B; SUVR = standard uptake value ratio; ROI = region of interest.
Figure 2.
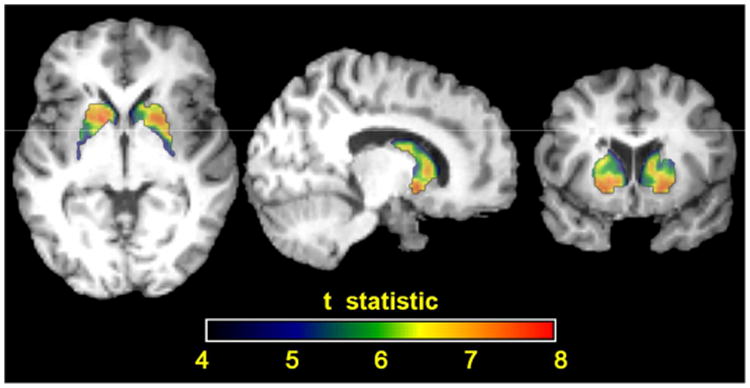
Parametric t-map of the correlation between SUVR and age in the striatum for the whole cohort. Close inspection of the internal structures of the striatum reveals the putamen has higher t-statistics than the caudate (P<0.001), indicating a statistically stronger correlation between standard uptake value ratios and age. This should not be confused with Pearson correlation coefficients, which reflect the strength of the correlations.
A similar analysis was performed on the ROI level, and the mean correlation coefficient for each region is presented in Table 3. Pearson's correlation coefficients were also calculated to indicate the goodness of the linear correlations. Generally, the same trends survived using mean SUVR, with every region showing a significant correlation of mean SUVR with age. A difference arose between the voxel-wise and ROI-based methods in the striatum, where the putamen now showed a stronger correlation with age than the caudate, but again did not reach significance. These differences were a consequence of averaging effects in the ROI-based approach.
Table 3. Pearson's correlation coefficient and correlation estimate for the relationship between [11C]PiB SUVR and age from ROI based analysis.
| ROI | Pearson's correlation coefficient, r | Correlation estimate, β [90% Confidence Interval] | ||||
|---|---|---|---|---|---|---|
| Whole cohort* | PiB positive | PiB negative* | Whole cohort* | PiB positive | PiB negative* | |
| Anterior Cingulate | 0.60 | -0.10 | 0.52 | [0.0191, 0.0336] | [-0.0365, 0.0234] | [0.0047, 0.0109] |
| Frontal Cortex | 0.66 | 0.05 | 0.66 | [0.0211, 0.0341] | [-0.0246, 0.0314] | [0.0076, 0.0133] |
| Parietal Cortex | 0.66 | 0.13 | 0.57 | [0.0241, 0.0388] | [-0.0200, 0.0357] | [0.0065, 0.0135] |
| Precuneus | 0.65 | 0.11 | 0.55 | [0.0238, 0.0390] | [-0.0226, 0.0367] | [0.0059, 0.0125] |
| Striatum | 0.63 | -0.11 | 0.59 | [0.0285, 0.0476] | [-0.0436, 0.0260] | [0.0083, 0.0163] |
| Caudate | 0.61 | -0.02 | 0.40 | [0.0253, 0.0437] | [-0.0363, 0.0334] | [0.0047, 0.0158] |
| Putamen | 0.62 | -0.16 | 0.60 | [0.0282, 0.0476] | [-0.0486, 0.0225] | [0.0085, 0.0166] |
| Temporal Cortex | 0.67 | 0.12 | 0.58 | [0.0166, 0.0264] | [-0.0148, 0.0261] | [0.0055, 0.0110] |
p-value < 0.005
[11C]PiB = carbon-11 labeled Pittsburgh compound B; SUVR = standard uptake value ratio; ROI = region of interest.
3.1 PiB positivity
In a population of 68 nondemented adults with Down syndrome, 17 (25%) were classified as PiB positive. Participants in the PiB positive group had a higher mean age than those in the PiB negative group, but showed no statistically significant difference in gender or APOE4 status (Table 1). Of the 17 PiB positive participants, 16 (94%) of them were above the cutoff SUVR in the striatum. The number of PiB positive participants in the other regions were as follows: fourteen (82%) in the parietal cortex, thirteen (71%) in the temporal cortex, and twelve (71%) in the anterior cingulate, frontal cortex, and precuneus (Fig. 3). Interestingly, the striatum was the only PiB positive region in 18% of the total PiB positive participants. Additionally, six more participants became PiB positive when comparing the mean SUVR of the putamen to the cutoff value, as opposed to that of the caudate or the whole striatum. There were ten participants (age range = 38-49) that were PiB positive in all six ROIs.
Figure 3.
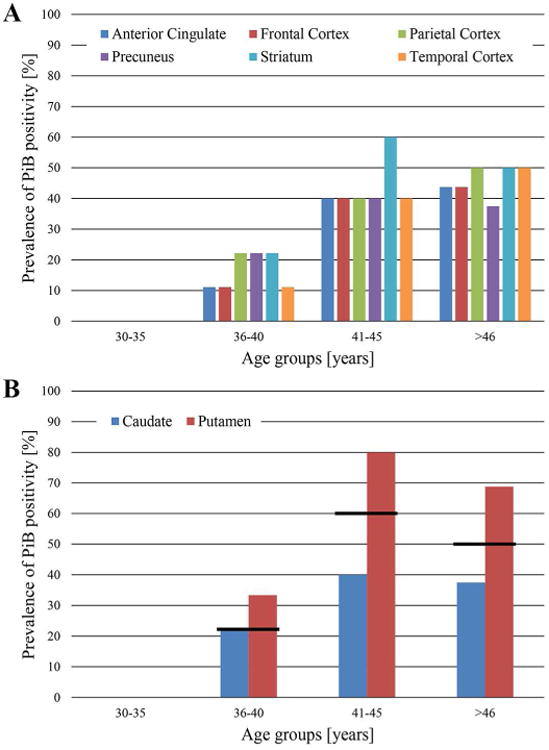
Prevalence of PiB positivity by region of interest and age group. A) The percent of PiB positive subjects generally increases with age. Note that this represents the prevalence of participants being classified as PiB positive per age group and does not represent amyloid deposition or amyloid deposition rates. B) The prevalence of PiB positivity of the striatal components with the value of the whole striatum represented as the black line.
Fig. 4 provides a visual representation of the mean PiB SUVR plotted against age with the cutoff value for positivity in each ROI, since the same trends were present in the whole ROI as compared to single voxels. It should be noted that while older participants are more likely to be classified as PiB positive, they do not invariably exhibit elevated [11C]PiB retention. Similarly, PiB positive subjects can exhibit elevated retention in some ROIs, but very low retention in other ROIs. The mean SUVR ± standard deviations were as follows for the PiB negative and PiB positive groups, respectively: 1.14±0.09 and 1.73±0.29 in the anterior cingulate, 1.03±0.09 and 1.60±0.28 in the frontal cortex, 1.10±0.10 and 1.75±0.27 in the parietal cortex, 1.16±0.10 and 1.83±0.29 in the precuneus, 1.13±0.12 and 1.97±0.34 in the striatum, and 1.08±0.08 and 1.52±0.20 in the temporal cortex.
Figure 4.
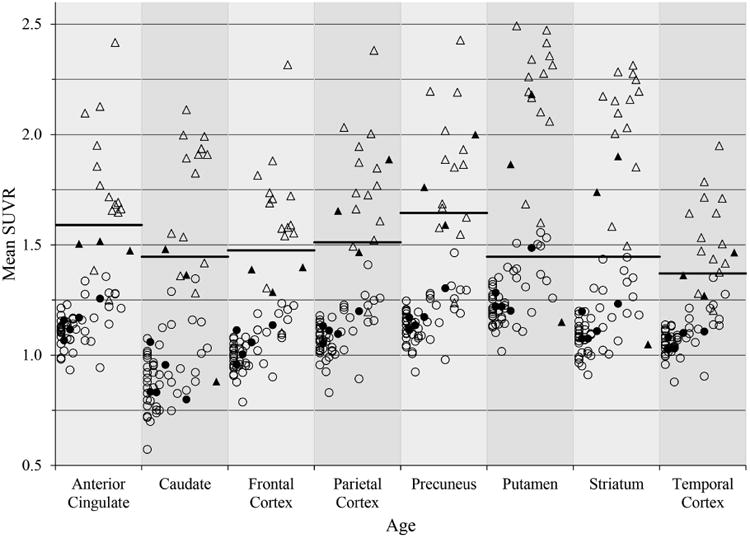
Mean SUVRs versus age for each ROI. Mean SUVRs plotted against age (30-53 years) for PiB positive subjects (triangles) and PiB negative subjects (circles). Filled shapes are APOE4 positive. The cutoff value for each ROI was determined by sparse k-means clustering and is represented by the bar.
The distribution of ranks within a subject for each ROI can be used to discern a pattern of selective burdening in amyloid-β deposition. The frontal cortex showed a small range of ranks, peaking at rank six. The frontal cortex, therefore, is not a strongly representative region for amyloid-β deposition in this population, having the lowest SUVRs out of the six ROIs within subjects. The other regions showed a wider range of ranks, reflecting the variability in deposition patterns. The ranks appeared similar between PiB positive and PiB negative participants, with the striatum and precuneus being the most influential.
The voxel-wise and ROI-based approaches for estimating the correlation of SUVR with age were revisited using PiB positive and PiB negative groups. In the voxel-wise approach, no significant correlations were found for the PiB positive group, but significant correlations were found in the anterior cingulate, precuneus, and striatum for the PiB negative group (Table 2). Significant voxels in the frontal cortex and parietal cortex did not survive the cluster size threshold, and there were no significant voxels found in the temporal cortex. In the ROI-based approach, no significant correlations were found for the PiB positive group, but significant correlations were found in every region for the PiB negative group (Table 3).
4. Discussion
This study investigated a sample population of nondemented adults with Down syndrome to examine the relationship between amyloid-β burden and natural aging, using [11C]PiB. The participant data examined herein represents the first cross-sectional cycle in an ongoing longitudinal study. Consequently, the parameter estimates should be interpreted as a correlation between age and SUVR, and not as a causative effect of age on SUVR, i.e. Alzheimer's disease pathogenesis is age-related and not age-dependent. The current analysis investigated the pattern of amyloid-β deposition, the prevalence of PiB positivity and the correlation between [11C]PiB SUVR with age across subjects.
APOE4 is considered a risk factor for dementia in the Down syndrome population; although the odds ratio is lower than that in the non-Down syndrome population [24]. There were not enough subjects with the APOE4 allele to warrant an exploration of the effect of a double dose of the allele, and all carriers (heterozygous or homozygous) were considered APOE4 positive. The frequency of the APOE4 allele in this sample of 68 adults with Down syndrome (11%) is comparable to that of the general population (15%), however, there is a large variability in its reported prevalence (4%-30%) [25]. Presence of an APOE4 allele increases the risk of mortality, independent of the risk for dementia in the Down syndrome population [24]. Taken together, the relatively decreased, but still significant risk of dementia and the increased risk of mortality associated with the presence of the APOE4 allele in the Down syndrome population support the idea that the survivor effect may underestimate the frequency of APOE4 that is truly representative of the Down syndrome population. A limitation of the study is that other risk factors, such as cerebrovascular complications, were not investigated.
Visual inspection of the [11C]PiB SUVR images identified six distinct regions of the brain with high retention, which were confirmed using a more objective statistical approach (Fig. 1). Elevated cortical retention or PiB positivity did not appear in participants less than 35 years old, suggesting that [11C]PiB is sensitive to increased amyloid-β deposition in adults with Down syndrome as early as the fourth decade of life. More importantly, these results are supported by previous findings that cognitively normal adults with and without Down syndrome can accumulate a substantial amyloid-β burden without experiencing cognitive decline [18,26]. Subsequently, it can be said that amyloid-β deposition begins in the asymptomatic stage of Alzheimer's disease and is, by itself, not enough to cause an individual to display the clinical features of Alzheimer's disease [27]. This does not preclude the possibility that amyloid-β deposition contributes to future progression into clinical Alzheimer's disease.
Fig. 3 shows that across regions there is generally an increase in the number of PiB positive subjects with increasing age. The apparent plateau between age groups 41-45 years to >46 years could be speculatively explained by the hypothesis that amyloid-β deposition in a specific region will eventually lead to a cognitive decline that reflects the function of the affected region. For instance, the frontal cortex is highly involved in cognitive function and adults with Down syndrome older than 45 years could have already accumulated a sufficient amyloid-β burden in the frontal cortex such that they decline into dementia. Thus they would be excluded from this study and the apparent plateau simply underlies the importance of this region in maintaining normal cognitive function.
Since the mere presence of amyloid-β plaques does not lead to clinical symptoms of dementia, it may be informative to inspect the pattern of deposition as a predictor. A ROI-based approach showed that the precuneus, striatum, and anterior cingulate are the most representative regions for elevated [11C]PiB retention, based on rank, and show the highest mean SUVRs within subjects. The asymptomatic non-Down syndrome population shows a very consistent pattern of [11C]PiB retention, involving the anterior cingulate, frontal cortex, parietal cortex, precuneus, and temporal cortex. However, the striatum is typically spared until later stages of Alzheimer's disease pathogenesis, except in autosomal dominant Alzheimer's disease resulting from mutations in APP, PSEN-1, or PSEN-2 [28-31]. It is a hallmark of autosomal dominant Alzheimer's disease to observe elevated retention in striatum without elevated retention in cortical regions typically affected by amyloid-β deposition [32]. Another study has shown that, in the non-Down syndrome population, and approximately the same age range, amyloid-β deposition can be detected with [11C]PiB imaging in nondemented individuals with autosomal dominant Alzheimer's disease mutations, but not in individuals without such mutations [33]. A notable difference between the Down syndrome population and the non-Down syndrome population is the ratio of the amyloid-β oligomers. The Down syndrome population, similar to individuals with autosomal dominant Alzheimer's disease, exhibits a higher ratio of amyloid-β42 to amyloid-β40, where amyloid-β42 is the form that aggregates into amyloid plaques [34].
In the whole cohort, the putamen dominated over the caudate in the striatum in terms of mean SUVR (P<0.001). There were six subjects who are above the PiB positivity cutoff in only the putamen, but not considered PiB positive because the putamen is just a subsection of a larger ROI. Still, the caudate was found to have a stronger correlation of SUVR with age than the putamen, but this difference in correlation strength did not reach significance. Perhaps this evidence suggests that the early striatal amyloid-β deposition focused in the putamen is not a function of natural aging in the Down syndrome population, but a consequence similar to that experienced by mutation carriers. The high striatal binding observed in the Down syndrome population could inform testing for future research, such as examining for extrapyramidal symptoms or abnormal gait.
While amyloid burden, and therefore [11C]PiB retention, is a continuous variable, it is sometimes valuable to treat it as a binary variable, classifying subjects as PiB positive or PiB negative. It is important to note that the designation as PiB positive is merely to indicate an elevated level of [11C]PiB binding. Therefore, PiB positive subjects show early Alzheimer-like pathology before the clinical onset of dementia. Other studies have shown that an elevated level of amyloid-β deposition accelerates the rate of deposition, as evidenced by higher correlation estimates of SUVR with age in the PiB positive group compared to the PiB negative group. PiB positivity is often considered a risk factor for conversion to dementia. Once initiated, Alzheimer's disease pathogenesis is more likely to be dependent on disease processes, such as the current level of amyloid-β, than age [33,35].
A goal of this work is to separate the effects of normal aging from the effects of early Alzheimer's disease pathogenesis. The PiB positive group showed no significant correlation between SUVR and age. The PiB positive group also had poor Pearson's correlation coefficients (Table 3), suggesting that a linear correlation with age is not well suited for this group. It could be that [11C]PiB retention, and more importantly, amyloid-β deposition is no longer a result of natural aging, but possibly a result of progression into the disease state. However, it is also possible that the small sample size and large variance of the PiB positive group could bias against finding significant correlations. The correlation estimates observed in the PiB positive group are larger in magnitude than that observed in the PiB negative group (Table 3), but still close to zero. A large sample size is required to identify significant correlations near the null hypothesis value of zero. Given that the PiB positive group only had 17 subjects while the PiB negative group had 51 subjects, the statistical power could explain this result that is contrary to literature reports of significant correlations of SUVR with age in both groups and where the PiB positive group shows a stronger correlation [35]. The small sample size of the PiB positive group could be due to a selection bias in which demented subjects were not analyzed, but who would have been older and PiB positive. It is worthwhile to investigate the PiB negative group as representative of the true asymptomatic population that reflect the effects of normal aging alone on [11C]PiB retention, especially since all individuals with Down syndrome are on a path towards amyloid-β deposition.
Three commonly affected regions in the non-Down syndrome population are the frontal cortex, parietal cortex and temporal cortex, yet a significant correlation was not observed in these regions for the PiB negative group using a voxel-wise approach. However, using a ROI-based approach, all regions show a significant correlation of mean SUVR with age. The correlation estimates for the PiB negative group are approximately three times weaker than the estimates for the whole cohort, suggesting that there are different mechanisms driving amyloid-β deposition in the two groups. This also suggests that age-related amyloid-β deposition is a much slower process than disease-related amyloid-β deposition.
4.1 Conclusion
There is evidence of a significant positive correlation between [11C]PiB SUVR, or amyloid-β deposition, with natural aging in this cohort of 68 individuals with Down syndrome. A non-age related deposition was observed as early as midway through the fourth decade of life in adults with Down syndrome and causes a pattern of elevated cortical [11C]PiB retention indicating specific binding. While there are shared aspects of pathogenesis between Down syndrome and Alzheimer's disease, these findings suggest that a primary feature of the Down syndrome population is the early involvement of amyloid-β deposition in the striatum. This early and high striatal involvement is reminiscent of autosomal dominant Alzheimer's disease. However this comparison should be made with caution, as the development of Alzheimer's disease in the Down syndrome is the combined effect of the triplication of many genes and gene products (APP, SOD-1, BACE-1, S100β among many others) that are not present in autosomal dominant Alzheimer's disease in the non-Down syndrome population.
Supplementary Material
Supplemental Figure 1: Average SUVR image of PiB negative group (left, n=51) and PiB positive group (right, n=17).
Research In Context.
Systematic Review: The authors performed a literature search spanning Down syndrome, Alzheimer's disease, and amyloid-β imaging. Using PET to examine amyloid deposition has been extensively researched in the non-Down syndrome population, but there are fewer studies in the Down syndrome population. The relevant publications are cited.
Interpretation: Our findings demonstrate a slight, but highly significant positive correlation between [11C]PiB SUVR and age in the commonly afflicted brain regions for the Down syndrome population. These results are consistent with the current understanding of Down syndrome as premature aging and the similarities between Alzheimer's disease and Down syndrome neuropathology.
Future Directions: The work presented in the manuscript can be extended to (a) investigate the relationship between grey matter, SUVR, and age and (b) investigate the rate of deposition once longitudinal data has been acquired and analyzed.
Acknowledgments
We would like to thank the psychologists, project managers, scientists, statisticians and technicians at the University of Wisconsin-Madison and University of Pittsburgh and their ADRCs who make this research possible. We would also like to thank the adults with Down syndrome and their families for their time and commitment to further discovery and understanding into the causes of Alzheimer's disease.
Funding: The research is funded by the National Institute of Aging (R01AG031110 to B.H. and B.C.) and the National Institute on Child Health and Human Development (P30 HD03352 to M.M.).
Abbreviations
- APP
amyloid precursor protein
- [11C]PiB
Carbon 11-labeled Pittsburgh compound B
- MNI
Montreal Neurological Institute
- ROI
region of interest
- SUVR
standard uptake value ratio
Footnotes
Publisher's Disclaimer: This is a PDF file of an unedited manuscript that has been accepted for publication. As a service to our customers we are providing this early version of the manuscript. The manuscript will undergo copyediting, typesetting, and review of the resulting proof before it is published in its final citable form. Please note that during the production process errors may be discovered which could affect the content, and all legal disclaimers that apply to the journal pertain.
References
- 1.Hook EB, Cross PK, Schreinemachers DM. Chromosomal abnormality rates at amniocentesis and in live-born infants. JAMA. 1993;249:2034–2038. [PubMed] [Google Scholar]
- 2.Carothers AD, Hecht CA, Hook EB. International variation in reported livebirth prevalence rates of Down syndrome, adjusted for maternal age. J Med Genet. 1999;36:386–393. [PMC free article] [PubMed] [Google Scholar]
- 3.Canfield MA, Honein MA, Yuskiv N, Xing J, Mai CT, Collins JS, et al. National estimates and race/ethnic-specific variation of selected birth defects in the United States, 1999-2001. Birth Defects Res A Clin Mol Teratol. 2006;76:747–759. doi: 10.1002/bdra.20294. [DOI] [PubMed] [Google Scholar]
- 4.Hardy JA, Higgins GA. Alzheimer's disease: the amyloid cascade hypothesis. Science. 1992;256(5054):184–185. doi: 10.1126/science.1566067. [DOI] [PubMed] [Google Scholar]
- 5.Jack CR, Jr, Holtzman DM. Biomarker modeling of Alzheimer's disease. Neuron. 2013;80:1347–1358. doi: 10.1016/j.neuron.2013.12.003. [DOI] [PMC free article] [PubMed] [Google Scholar]
- 6.Olson MI, Shaw CM. Presenile dementia and Alzheimer's disease in mongolism. Brain. 1969;92:147–156. doi: 10.1093/brain/92.1.147. [DOI] [PubMed] [Google Scholar]
- 7.Rumble B, Retallack R, Hilbich C, Simms G, Multhaup G, Martins R, et al. Amyloid A4 protein and its precursor in Down's syndrome and Alzheimer's disease. The New England Journal of Medicine. 1989;320:1446–1452. doi: 10.1056/NEJM198906013202203. [DOI] [PubMed] [Google Scholar]
- 8.Mann DM, Esiri MM. The pattern of acquisition of plaques and tangles in the brains of patients under 50 years of age with Down's syndrome. Journal of Neurological Sciences. 1989;89:169–179. doi: 10.1016/0022-510x(89)90019-1. [DOI] [PubMed] [Google Scholar]
- 9.O'Hara PT. Electron microscopical study of the brain in Down's syndrome. Brain. 1972;95:681–684. doi: 10.1093/brain/95.4.681. [DOI] [PubMed] [Google Scholar]
- 10.Ellis WG, McCulloch JR, Corley CL. Presenile dementia in Down's syndrome: ultrastructural identity with Alzheimer's disease. Neurology. 1974;24:101–106. doi: 10.1212/wnl.24.2.101. [DOI] [PubMed] [Google Scholar]
- 11.Holland AJ, Hon J, Huppert FA, Stevens F. Incidence and course of dementia in people with Down'ssyndrome: findings from a population-based study. J Intellect Disabil Res. 2000;44:138–146. doi: 10.1046/j.1365-2788.2000.00263.x. [DOI] [PubMed] [Google Scholar]
- 12.Hebert L, Scherr P, Bienias J, Bennett DA, Evans DA. Alzheimer's disease in the U.S. population: prevalence estimates using the 2000 census. Arch Neurol. 2003;60:1119–1122. doi: 10.1001/archneur.60.8.1119. [DOI] [PubMed] [Google Scholar]
- 13.Ropper AH, Williams RS. Relationship between plaques, tangles and dementia in Down's syndrome. Neurology. 1980;30:639–944. doi: 10.1212/wnl.30.6.639. [DOI] [PubMed] [Google Scholar]
- 14.Wisniewski KE, Wisniewski HM, Wen GY. Occurrence of neuropathological changes and dementia of Alzheimer's disease in Down's syndrome. Annals of Neurology. 1985;17:178–282. doi: 10.1002/ana.410170310. [DOI] [PubMed] [Google Scholar]
- 15.Oliver C, Holland AJ. Down's syndrome and Alzheimer's disease: a review. Psychological Medicine. 1986;16:307–322. doi: 10.1017/s0033291700009120. [DOI] [PubMed] [Google Scholar]
- 16.Jack CR, Jr, Knopman DS, Jagust WJ, Shaw LM, Aisen PS, Weiner MW, et al. Hypothetical model of dynamic biomarkers of the Alzhemier's pathological cascade. Lancet Neurol. 2010;9:119–128. doi: 10.1016/S1474-4422(09)70299-6. [DOI] [PMC free article] [PubMed] [Google Scholar]
- 17.Handen BL, Cohen AD, Channamalappa U, Bulova P, Cannon SA, Cohen WI, et al. Imaging brain amyloid in nondemented young adults with Down syndrome using Pittsburgh compound B. Alzheimer's & Dementia. 2012;8:496–501. doi: 10.1016/j.jalz.2011.09.229. [DOI] [PMC free article] [PubMed] [Google Scholar]
- 18.Hartley SL, Handen BL, Devenny DA, Hardison R, Mihaila I, Price JC, et al. Cognitive functioning in relation to brain amyloid-β in healthy adults with Down syndrome. Brain. 2014;137(9):1–8. doi: 10.1093/brain/awu173. [DOI] [PMC free article] [PubMed] [Google Scholar]
- 19.McNamee RL, Yee SH, Price JC, Klunk WE, Rosario B, Weissfeld L, et al. Consideration of optimal time window for Pittsburgh compound B PET summed uptake measurements. J Nucl Med. 2009;50:348–355. doi: 10.2967/jnumed.108.057612. [DOI] [PMC free article] [PubMed] [Google Scholar]
- 20.Klunk WE, Engler H, Nordberg A, Wang Y, Blomqvist G, Holt DP, et al. Imaging Brain Amyloid in Alzheimer's disease with Pittsburgh compound B. Ann Neurol. 2004;55:306–319. doi: 10.1002/ana.20009. [DOI] [PubMed] [Google Scholar]
- 21.Lopresti BJ, Klunk WE, Mathis CA, Hoge JA, Ziolko SK, Lu X, et al. Simplified quantification of Pittsburgh Compound B amyloid imaging PET studies: A comparative analysis. J Nucl Med. 2005;46:1959–1972. [PubMed] [Google Scholar]
- 22.Price JC, Klunk WE, Lopresti BJ, Lu X, Hoge JA, Ziolko SK, et al. Kinetic modeling of amyloid binding in humans using PET imaging and Pittsburgh Compound-B. Journal of Cerebral Blood Flow and Metabolism. 2005;25:1528–1547. doi: 10.1038/sj.jcbfm.9600146. [DOI] [PubMed] [Google Scholar]
- 23.Cohen AD, Mowrey W, Weissfel LA, Aizenstein HJ, McDade E, Mountz JM, et al. Classification of amyloid-positivity in controls: Comparison of visual read and quantitative approaches. NeuroImage. 2013;71:207–215. doi: 10.1016/j.neuroimage.2013.01.015. [DOI] [PMC free article] [PubMed] [Google Scholar]
- 24.Rohn TT, McCarty KL, Love JE, Head E. Is apolipoprotein E4 an important risk factor for dementia in persons with Down syndrome? J Parkinsons Dis Alzheimer Dis. 2014;1(1):7. doi: 10.13188/2376-922x.1000004. [DOI] [PMC free article] [PubMed] [Google Scholar]
- 25.Mayeux R, Stern Y, Ottman R, et al. The apolipoprotein ε4 allele in patients with Alzheimer's disease. Annals of Neurology. 1993;34(5):752–754. doi: 10.1002/ana.410340527. [DOI] [PubMed] [Google Scholar]
- 26.Aizenstein HJ, Nebes RD, Saxton JA, Price JC, Mathis CA, Tsopelas ND, et al. Frequent amyloid deposition without significant cognitive impairment among the elderly. Arch Neurol. 2008;65(11):1509–1517. doi: 10.1001/archneur.65.11.1509. [DOI] [PMC free article] [PubMed] [Google Scholar]
- 27.Jack CR, Lowe VJ, Senjem ML, Weigand SD, Kemp BJ, Shiung MM, et al. 11C PiB and structural MRI provide complementary information in imaging of Alzheimer's disease and amnestic mild cognitive impairment. Brain. 2008;131:665–680. doi: 10.1093/brain/awm336. [DOI] [PMC free article] [PubMed] [Google Scholar]
- 28.Klunk WE, Price JC, Mathis CA, Tsopelas ND, Lopresti BJ, Ziolko SK, et al. Amyloid deposition begins in the striatum of presenilin-1 mutation carriers from two unrelated pedigrees. J Neurosci. 2007;27(23):6174–6184. doi: 10.1523/JNEUROSCI.0730-07.2007. [DOI] [PMC free article] [PubMed] [Google Scholar]
- 29.Remes AM, Laru L, Tuominen H, Aalto S, Kemppainen N, Mononen H, et al. Carbon 11-labeled Pittsburgh compound B positron emission tomographic amyloid imaging in patients with APP locus duplication. Arch Neurol. 2008;65(4):540–544. doi: 10.1001/archneur.65.4.540. [DOI] [PubMed] [Google Scholar]
- 30.Villemagne VL, Ataka S, Mizuno T, Brooks WS, Wada Y, Kondo M, et al. High striatal amyloid β-peptide deposition across different autosomal Alzheimer disease mutation types. Arch Neurol. 2009;66(12):1537–1544. doi: 10.1001/archneurol.2009.285. [DOI] [PubMed] [Google Scholar]
- 31.Koivunen J, Verkkoniemi A, Aalto S, Paetau A, Ahonen JP, Viitanen M, et al. PET amyloid ligand [11C]PIB uptake shows predominantly striatal increase in variant Alzheimer's disease. Brain. 2008;131:1845–1853. doi: 10.1093/brain/awn107. [DOI] [PubMed] [Google Scholar]
- 32.Klunk WE, Price JC, Mathis CA, et al. Amyloid deposition begins in the striatum of presenilin-1 mutation carriers from two unrelated pedigrees. J Neurosci. 2007;27(23):6174–6184. doi: 10.1523/JNEUROSCI.0730-07.2007. [DOI] [PMC free article] [PubMed] [Google Scholar]
- 33.Bateman RJ, Xiong C, Benzinger TLS, et al. Clinical and biomarker changes in dominantly inherited Alzheimer's disease. N Eng J Med. 2012;367(9):795–804. doi: 10.1056/NEJMoa1202753. [DOI] [PMC free article] [PubMed] [Google Scholar]
- 34.Lemere CA, Blusztajn JK, Yamaguchi H, et al. Sequence of deposition of heterogeneous amyloid beta-peptides and APO E in Down syndrome: implications for initial events in amyloid plaque formation. Neurobiology of Disease. 1996;3(1):16–32. doi: 10.1006/nbdi.1996.0003. [DOI] [PubMed] [Google Scholar]
- 35.Chetelat G, La Joie R, Villain N, et al. Amyloid imaging in cognitively normal individuals, at-risk populations and preclinical Alzheimer's disease. NeuroImage: Clinical. 2013;2:356–365. doi: 10.1016/j.nicl.2013.02.006. [DOI] [PMC free article] [PubMed] [Google Scholar]
Associated Data
This section collects any data citations, data availability statements, or supplementary materials included in this article.
Supplementary Materials
Supplemental Figure 1: Average SUVR image of PiB negative group (left, n=51) and PiB positive group (right, n=17).