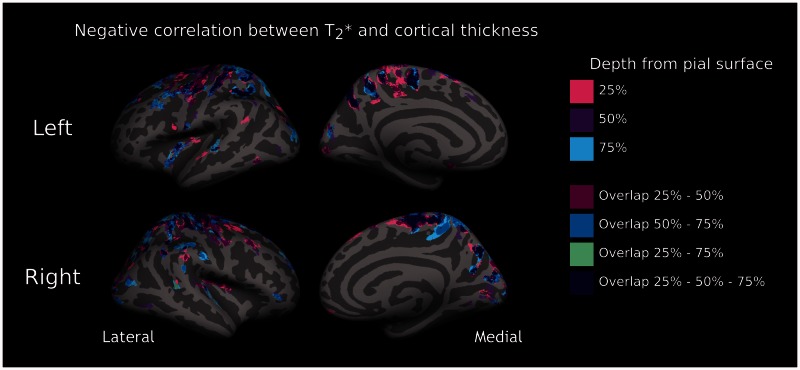
Figure 3.
Relationship between laminar T2* and cortical thickness in patients. Overlay of the GLM significance maps (P < 0.05 corrected for multiple comparisons) on the average pial surface for left (top) and right (bottom) hemispheres showing, in the whole group of subjects with multiple sclerosis (n = 41), clusters exhibiting a negative correlation between T2* relaxation time at 25%, 50% and 75% depth from the pial surface and cortical thickness, as well as significant clusters overlapping across the three depths.

