Abstract
Despite intense efforts, Alzheimer’s disease (AD) is one of the top public health crisis for society even at 21st century. Since presently there is no cure for AD, early diagnosis of possible AD biomarkers is crucial for the society. Driven by the need, the current manuscript reports the development of magnetic core-plasmonic shell nanoparticle attached hybrid graphene oxide based multifunctional nanoplatform which has the capability for highly selective separation of AD biomarkers from whole blood sample, followed by label-free surface enhanced Raman spectroscopy (SERS) identification in femto gram level. Experimental ELISA data show that antibody-conjugated nanoplatform has the capability to capture more than 98% AD biomarkers from the whole blood sample. Reported result shows that nanoplatform can be used for SERS “fingerprint” identification of β-amyloid and tau protein after magnetic separation even at 100 fg/mL level. Experimental results indicate that very high sensitivity achieved is mainly due to the strong plasmon-coupling which generates huge amplified electromagnetic fields at the “hot spot”. Experimental results with nontargeted HSA protein, which is one of the most abundant protein components in cerebrospinal fluid (CSF), show that multifunctional nanoplatform based AD biomarkers separation and identification is highly selective.
Keywords: plasmonic-magnetic multifunctional nanoplatform, hybrid graphene oxide, Alzheimer’s disease biomarkers, surface enhance Raman spectrosocpy, fingerprint identification of β-amyloid and tau protein
1. INTRODUCTION
Alzheimer’s disease (AD) is a severe neurodegenerative disorder of the brain that is characterized by loss of memory and cognitive decline.1–9 AD was discovered by Alois Alzheimer in 1906, and according to the 2015 Alzheimer’s Disease Facts and Figures, it will be responsible for more than 700,000 deaths just this year.1 The real puzzle for society is that deaths attributed to Alzheimer’s disease increased by 71% in the past decade.1–7 Several clinical studies have shown that the possible biomarkers that can be used to diagnose AD in cerebrospinal fluid (CSF) are β-amyloid (Aβ proteins) and tau protein.10–19 Even today, the only definite way to diagnose Alzheimer’s by doctor is to find β-amyloid plaques composed primarily Aβ proteins and neurofibrillary tangles (NFTs) formed by abnormal phosphorylated tau proteins.13–21 Unfortunately, even in the 21st century, this can be done only by examining the brain post-mortem.8–15
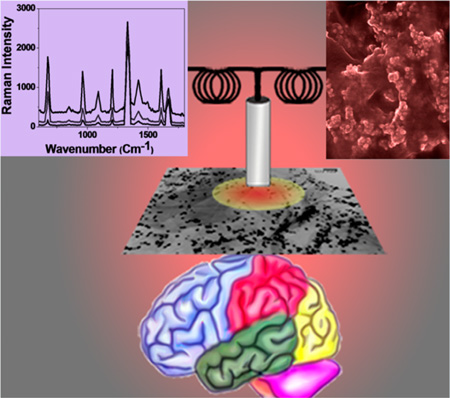
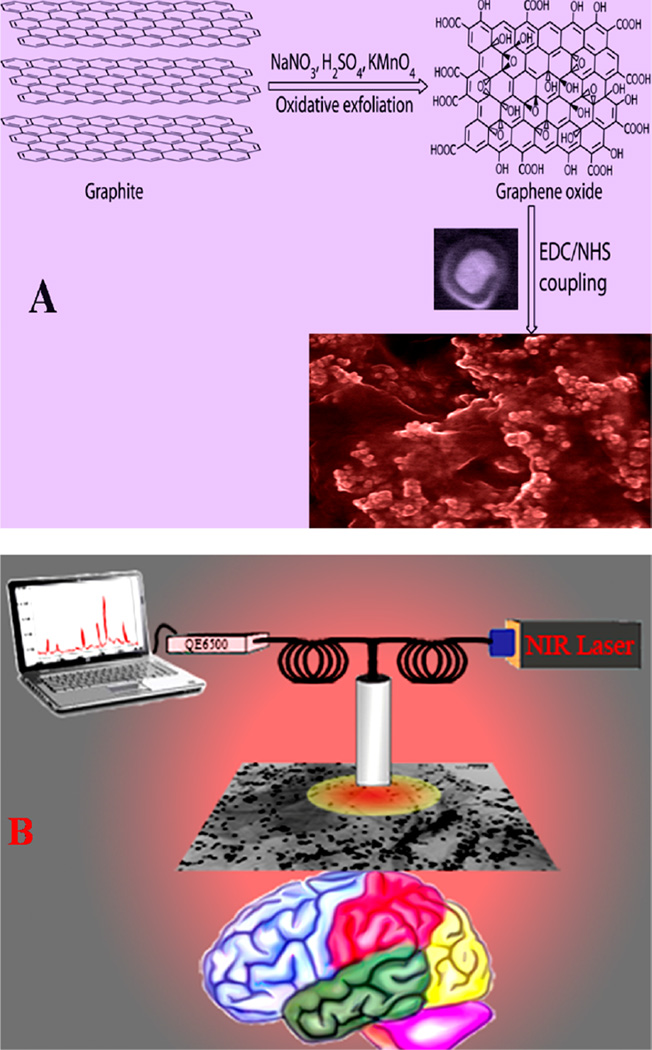
Because there is no cure presently, early diagnosis of AD biomarkers is crucial for the current drug treatments.3–10 Clinical doctors are trying to determine whether a simple blood test has the potential to predict AD in a few years.11–19 Several clinical studies indicate that clinical lab diagnostic for AD can be the combination of abnormally low Aβ and tau protein levels in plasma.5–14 As a result, society needs an ultrasensitive assay for the selecctive measurement of β-amyloid and tau protein levels in blood samples, which can provide an opportunity to develop clinical diagnostics for AD.5–13 Driven by this need, we report the development of large-scale, chemically stable bioconjugated multifunctional hybrid graphene oxide platform for the separation and accurate identification of trace levels of β-amyloid and tau protein selectively from whole blood in femtogram levels, as shown in Scheme 1.
Scheme 1.
(A) Schematic Representation Showing the Synthetic Pathway for the Development of Core-Shell Nanoparticle Attached Hybrid Graphene Oxide Based Multifunctonal Nanoplatform and (B) Schematic Representation Showing Plasmonic-Magnetic Hybrid Graphene Oxide Platform for Label-Free SERS Detection of AD Biomarkers
Magnetic-plasmonic nanoplatform was designed by conjugating iron oxide magnetic core-gold plasmonic shell nanoparticle22–25 on 2D graphene oxide. Because surface enhanced Raman spectroscopy (SERS) is known to provide specific spectral information about molecules26–35 for the identification of biological species by their “fingerprint” spectra, we used hybrid graphene oxide based SERS for trace level identification of AD biomarkers using Raman “fingerprint”, as shown in Scheme 1B.
For selective capture and accurate identification of β-amyloid and tau protein from blood sample, we have developed anti tau antibody and anti-β amyloid antibody conjugated nanoplatform. For our design, due to the low cost, ease of large scale production and huge surface area, the two-dimensional (2D) graphene oxide36–45 is selected as a useful template to generate core–shell nanoparticle assembly via controlled attachment, as shown in Scheme 1A. We have also used unique physicochemical properties and tunable surface chemistry of GO36–45 as a versatile material for the incorporation of multiple diagnostic entities on the same GO sheet. For the detection of AD biomarkers and also to avoid huge light scattering and auto fluorescence background from blood cells, we have employed effective capture, separation, and enrichment via magnetic properties of core–shell nanoparticles22–25 by using a bar magnet. On the other hand, gold shell has been used for accurate identification of β-amyloid and tau protein using SERS. In the past decade, after scientists learned how to manipulate plasmonic properties of nanoparticles, SERS has become a mature vibrational spectroscopic technique for the possible applications in chemical and biological “fingerprint” assays.26–35
To attain extremely high sensitivity over Raman spectroscopy for ultrasensitive AD biomarkers detection, SERS platform should possess strong electromagnetic and chemical enhancement capabilities.26–34,46–48 In our design, plasmon coupling between core–shell plasmonic nanoparticle has been used to dramatically enhance the SERS efficiency via enhanced light-matter interaction through plasmon-coupling in “hot spot” via plasmonic enhancement mechanism. Thus, in the this platform, graphene oxide serves as a built-in hot spot marker to enhance the electromagnetic field coupling of plasmonic particles.28–35 On the other hand, graphene oxide will enhance the SERS signal via chemical enhancement mechanism.26–29 The advantages on the use of graphene oxide as SERS platform is its ability to enhance the Raman signal via chemical enhancement.26–29 The unique structure of sp2-carbon 2D nanosheets is favorable for aromatic molecule interaction via π–π stacking, and the highly electronegative oxygen species on surface of 2D graphene oxide can enhance local electric field on the adsorbed molecules.26–29 These two factors are responsible for the SERS chemical enhancement by graphene oxide. Graphene oxide also has a strong ability to quench the molecule’s fluorescence, which decreases the background signal tremendously.26–29 Due to its huge surface area, graphene oxide possesses very high adsorption to target molecules, which makes graphene oxide an advanced substrate for sensitive SERS detection.26–29 Because the effective plasmon field generated by the core–shell nanoparticle assembly on 2D graphene oxide surface is more intense than the individual nanoparticle, our reported experimental data demonstrate that the detection limit is several orders of magnitude higher than the currently used enzyme-linked immuno sorbant assay (ELISA) kit for Aβ (0.312 ng/mL) and tau protein (0.15 ng/mL).17–21
2. EXPERIMENTAL SECTION
2.1. Materials
Graphite, FeCl3, HAuCl4, FeCl2, KMnO4, NaBH4, graphite, β-amyloid (1–42), tau protein, BSA protein, PEG, tri sodium citrate, and cystamine dihydrochloride were purchased from Sigma-Aldrich (St. Louis, MO). Anti-β-amyloid antibody and anti-tau antibody was purchased from Abcam (Cambridge, U.K.).
2.2. Synthesis of Iron Nanoparticle
Magnetic core iron nanoparticles were synthesized by using our reported methis.22,23,35 Details are discussed in the Supporting Information. We have used JEM-2100F transmission electron microscope (TEM) to characterized them, as shown in Figure S1A (SI).
2.3. Synthesis of Magnetic Core–Plasmonic Shell Nanoparticle
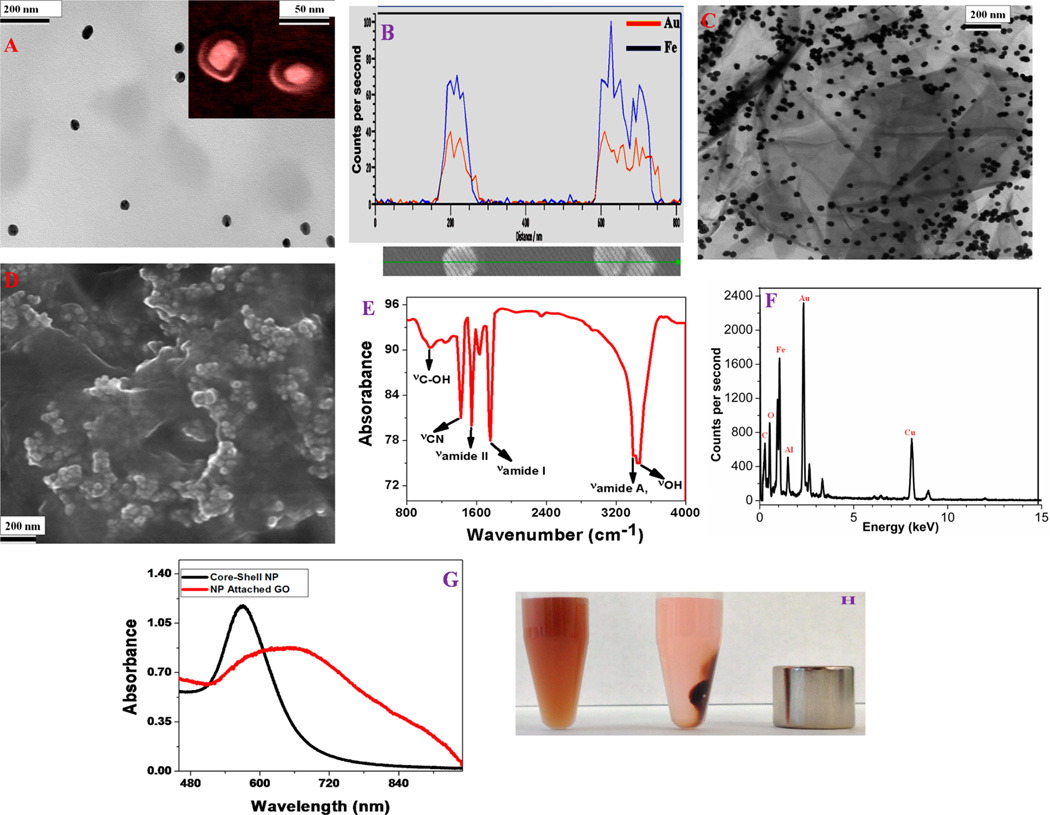
We have dveloped iron magnetic core–gold plasmonic shell nanoparticle using our reported method.24,41 In brief, 30 mg of freshly prepared iron oxide nanoparticles were dispersed in 30 mL of water and heated to boiling. After that, to develop plasmonic shell on the magnetic core, we added 5 mL of 1.2 mM gold chloride solution and 15 mL of 0.100 M trisodium citrate to the iron nnaoparticle solution. Next, we continued boiling for 30 min to yield light pink colored magnetic core-gold shell nanoparticles. After that, we developed amino functionalized core–shell nanoparticle. For this purpose, we modified the gold shell surface of core–shell nanoparticle by amine groups using cystamine dihydrochloride. To characterize core–shell nanoparticle, we used high-resolution JEM-2100F transmission electron microscope (TEM), Hitachi 5500 ultra-high-resolution scanning electron microscope (SEM), energy-dispersive X-ray spectroscopy (EDX) analysis, and absorption spectroscopy analysis. Figure 1A shows the high-resolution TEM picture of our core–shell nanoparticle; the inset very high-resolution SEM image clearly shows core–shell structure. It also indicates that the gold shell thickness is around 10 nm. EDX mapping data, as shown in Figure 1B, shows the presence of iron and gold in the core–shell nanoparticle.
Figure 1.
(A) High-resolution TEM image using JEM-2100F transmission electron microscope showing the morphology of iron magnetic core–gold plasmonic shell nanoparticles; (inset) high-resolution SEM picture confirming the core–shell morphology of freshly prepared nanoparticles. (B) EDX mapping data of freshly prepared core–shell nanoparticle showing the presence of Fe and Au. (C) High-resolution TEM picture showing the morphology of freshly prepared core–shell nanoparticle attached multifunctional hybrid graphene oxide. (D) High-resolution SEM picture showing the three-dimensional view of hybrid graphene oxide, which clearly shows the formation of core–shell nanoparticle assembly on graphene oxide surface. (E) FTIR spectrum from freshly prepared core–shell nanoparticle attached multifunctional hybrid graphene oxide showing the existence of amide A, I and II bands, as well as –CN band, which indicate the formation of amide bond. The stretches –OH and –C–OH groups due to the graphene oxide also be seen on the FTIR spectra. (F) EDX data of freshly prepared multifunctional hybrid graphene oxide showing the presence of Fe, Au, C, and O. We have also observed Cu and Al peaks in the EDX data, which originate from the support grid. (G) Extinction spectra of core–shell nanoparticle and nanoparticle attached hybrid graphene oxide. Due to the formation of core–shell nanoparticle assembly on graphene oxide surface, the excitation spectra is very broad for hybrid material. (H) Photograph showing that the core–shell nanoparticle attached hybrid graphene oxide is highly magnetic, which allows them to be separated by using a bar magnet.
2.4. Synthesis of Core–Shell Nanoparticle Attached 2D Hybrid Graphene Oxide Based Multifunctional Nanoplatform
For this purpose, at first we have developed graphene oxide a modified Hummers method approach.29,30,37,39–44 In brief, at first, 1.00 g of graphite powder was added to 1.00 g of NaNO3 in 45 mL of H2SO4. After that, 3.00 g of KMnO4 was added slowly. The reaction was continued in a water bath for 30 min with continuous stirring. After stirring, we have added 150 mL of water drop by drop, and the we have continued stirring for 30 more minutes. In the next step, we performed sonication for 1 h for exfoliation. After that, an amine functionalized magnetic core-plasmonic shell nanoparticle was attached to the 2D graphene oxide via amide linkages. For this purpose, we have used the coupling chemistry between –CO2H group of 2D graphene oxide and –NH2 group of core–shell nanoparticle via the cross-linking agent EDC (1-ethyl-3-(3-(dimethylamino)propyl)-carbodiimide). After functionalization, centrifugation was carried out four to six times to remove all unbound core–shell nanoparticles. Next, all materials were characterized using high-resolution JEM-2100F transmission electron microscope (TEM), Hitachi 5500 ultra high-resolution scanning electron microscope (SEM), energy-dispersive X-ray spectroscopy (EDX) analysis, infrared spectroscopy, and absorption spectroscopy analysis. As shown in Figure 1E, the FTIR spectrum shows a very strong band at ~3340 cm−1, which can be attributed as Amide A band. We also observed amide I band at ~1750 cm−1, which is mainly due to the stretching vibrations of the C═O bond of the amide. Similarly, amide II band at ~1550 cm−1, which is mainly due to the in-plane NH bending vibration from amide, has also been observed. Similarly, –CN band ~1430 cm−1 is also observed All the above characteristic IR bands clearly show the formation of amide bond via coupling between –CO2H group of 2D graphene oxide and –NH2 group of core–shell nanoparticles. Reported IR spectra at Figure 1E also shows a strong band ~3520 cm−1, mainly due to graphene oxide carboxyl group. Figure 1C,D show the high-resolution TEM and three-dimensional SEM imaging for the hybrid graphene oxide. The energy-dispersive X-ray spectroscopy (EDX) analysis, as shown in Figure 1F, clearly shows the presence of iron, gold, carbon, and oxygen. Both TEM and SEM images clearly show that core–shell nanoparticles are in assembled nanostructures on graphene oxide surfaces, though the assembly structure is not a perfect regular assembly. Due to assembly formation, it develops huge amount of “hot spot”, which helps strong surface plasmon coupling to amplify electromagnetic fields significantly. As a result, we have observed very broad surface plasmon resonance band from core–shell nanoparticle attached hybrid graphene oxide, as shown in Figure 1G. Figure 1H shows that a small bar magnet is enough to separate plasmonicmagnetic nanoparticle-attached 2-D graphene oxide, which indicates that the hybrid material is highly magnetic. We have also performed superconducting quantum interference device magnetometer (SQID) measurement, which indicates that the hybrid graphene oxide exhibits superparamagnetic behavior with specific saturation magnetization of 21.4 emu g−1.
2.5. Developing Antibody-Attached Multifunctional Nanoplatform
For the selective separation and detection of β-amyloid and tau protein, we developed anti-tau antibody and anti-β-amyloid antibody conjugated hybrid graphene oxide. For this purpose, hybrid graphene oxide was coated by amine-modified polyethylene glycol (HS-PEG) to prevent nonspecific interactions with blood cells and cell media. After PEGylation, anti-tau antibody and anti-β amyloid antibody were attached with amine functionalized PEG coated core–shell nanoparticle attached graphene oxide, using our reported method.16,24,29 To determine whether antibody is attached with hybrid graphene oxide or not, we used Cy3 functionalized antibody for this purpose. Initially, because both graphene oxide and gold shell nanoparticle are very good fluorescence quencher, we have not observed any fluorescence. Next, we have added potassium cyanide, which dissolved the gold coating, and as a result, Cy3 attached antibody is released. After that, we have performed fluorescence analyses. By dividing the total number of Cy3 labeled antibody by the total number of core–shell nanoparticles, we estimated that there were about 350–400 antibody attached per nanoparticle.
2.6. SERS Measurements
For SERS measurement, we used a portable probe, as we reported before.30,35 In brief, for the SERS experiments, we used continuous wavelength 785 nm DPSS laser with 2 mW of power as the excitation light source. For the collection of SERS data, we used a miniaturized QE65000 spectrometer. We used a 10 s acquisition time and 5 scan averaging for the Raman data collection using Ocean Optics data acquisition and Spectra Suite spectroscopy software.
2.7. Finding the Detection Limit
The limit of detection (LOD) was estimated using the minimum concentration, which was determined when the signal to baseline noise ratio of the intensity of the different Raman bands for β-amyloid and tau protein was around 10:1. 3.
RESULTS AND DISCUSSION
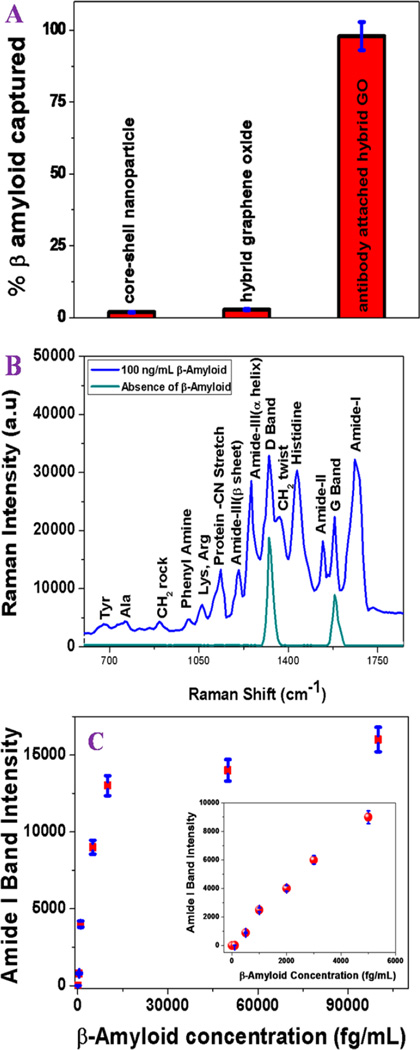
For the selective separation and detection of β-amyloid and tau protein, we developed anti-tau antibody and anti-β amyloid antibody conjugated hybrid graphene oxide. Next, to find out whether anti-β amyloid antibody conjugated plasmonic-magnetic hybrid graphene oxide can be used for separation and detection of β amyloid close to clinical settings, we tested the selective capture and label-free SERS detection capability using infected blood. For this purpose, 500 µL of anti-β amyloid antibody attached hybrid graphene oxide was incubated with infected whole blood containing 100 ng/mL of β amyloid (1–42) in 15 mL suspensions of citrated whole rabbit blood for 70 min with gentle shaking. Next, we used a bar magnet to separate β amyloid (1–42) attached plasmonicmagnetic hybrid graphene oxide from infected blood samples. To determine the capture efficiency, we used enzyme-linked immunosorbent assay (ELISA) kit.16–21 Figure 2A shows the ELISA experimental results, which clearly indicate that the β amyloid (1–42) separation efficiency is less than 3% when anti-β amyloid antibody was not conjugated with nanoplatform.
Figure 2.
(A) ELISA results showing β amyloid capture efficiency from infected blood samples using anti-β amyloid antibody attached plasmonic-magnetic hybrid graphene oxide based nanoplatform. Plots also show that separation efficiency is less than 3% in the absence of anti-β amyloid antibody. (B) Spectrum showing SERS intensity from β amyloid conjugated nanoplatform after magnetic separation. Observed SERS signal is directly from the β amyloid. Other than D and G bands, no SERS signal was observed when whole blood without β amyloid was used. (C) Plot showing how SERS amide I band intensity from β amyloid conjugated nanoplatform changes with concentration between 0 and 6 pg/mL. Our experimental data show that the detection efficiency can be as low as 500 fg/mL.
On the other hand, experimental data using ELISA clearly shows that around 98% β amyloid (1–42) were captured when nanoplatform was conjugated with anti-β amyloid antibody. Our experimental results suggest that the β amyloid (1–42) capture efficiency using anti-β amyloid antibody attached core–shell nanoparticle conjugated hybrid graphene oxide can be as high as 98%. After separation of β amyloid (1–42) from infected blood sample, for identification, we have used surface enhanced Raman spectroscopy. Experimental details have been reported in the Supporting Information. Figure 2B, clearly indicate that hybrid platform can be used to detect label-free very string Raman peak from β amyloid (1–42) even at 100 ng/mL concentration level. As shown in Table 1, all the observed Raman bands could be assigned to β amyloid (1–42) vibration bands and graphene oxide D and G bands, consistent with the reported data.17,19–21
Table 1.
Raman Modes Analysis Observed from β Amyloid and Tau Proteina
| vibration mode | Raman peak position (cm−1) |
|---|---|
| amide I band | ~1650 |
| graphene oxide G band | ~1590 |
| amide II band | ~1550 |
| histidine band | ~1440 |
| CH2 twist | ~1385 |
| graphene oxide D band | ~1340 |
| amide III bands due to α-helical structure | ~ 1270 |
| amide III bands due to β-sheet conformation | ~1224 |
| protein –CN band | ~1090 |
| phenyl amine band | ~ 990 |
| tyrosine | ~1170, ~ 910, ~ 660 |
As shown in Figure 2B, the strongest observed Raman bands are amide I band near 1650 cm−1, amide II band near 1550 cm−1, and amide III band near 1300 cm−1. The presence of two amide III bands are due to the α-helical structure near 1270 cm−1 and next one near 1224 cm−1 is due to the β-sheet conformation, indicating that β amyloids are in two different conformational states. Other strong Raman bands are associated with histidine residue bands near 1440 cm−1, graphene D bands near 1340 cm−1, and G bands near 1590 cm−1. Similarly, we have also observed Raman bands associated with the aromatic side chains like phenylalanine, tyrosine, and others. Figure 2C shows that the SERS detection limit can be as low as 500 fg/mL β amyloid using our developed nanoplatform, which is remarkable. The observed huge sensitivity can be due to several factors: (1) In plasmonic-magnetic hybrid platform, graphene oxide enhances the Raman signal by chemical enhancement, and core–shell nanoparticle assembly enhances the Raman signal by plasmon enhancement. Because graphene oxide possesses highly electronegative oxygen species in the surface, it has the capability to enhance the SERS intensity form β amyloid via chemical enhancement. (2) On the other hand, very high plasmon enhancement by magnetic core-plasmonic shell nanoparticle is mainly due to the aggregated assembly structure, which creates strong surface plasmon coupling leading to highly amplified electromagnetic fields at the “hot spot”. The effective plasmon field generated by the core–shell nanoparticle assembly will be much more intense than the individual nanoparticle plasmon field intensity. Using the finite-difference time-domain (FDTD) results, we have reported48 that the field enhancement for assembly structure can be 2–3 orders of magnitude higher than for the individual structure, which depends on the length of the assembly and spacing between two individual structure in the assembly.46,47 Because the SERS signal enhancement factor is directly proportional to the square of the plasmon field enhancement, theoretically 4–9 orders of magnitude of SERS enhancement is expected due to the assembly structure.
As we have discussed before, like β amyloid, tau protein is also believed to be a possible biomarkers for AD, and as a result, we have demonstrated separation and label-free identification of tau protein from infected blood using anti-tau antibody conjugated multifunctional hybrid graphene oxide. For this purpose, 600 µL of anti-tau antibody attached hybrid graphene oxide was incubated with infected whole blood containing 80 ng/mL of tau protein in 15 mL suspensions of citrated whole rabbit blood. We performed the incubation for 70 min with gentle shaking. After that, we used a bar magnet to separate tau protein attached multifunctional hybrid graphene oxide from infected blood samples. Next, we used ELISA kit to determine the tau protein capture efficiency, as shown in Figure 3A.
Figure 3.
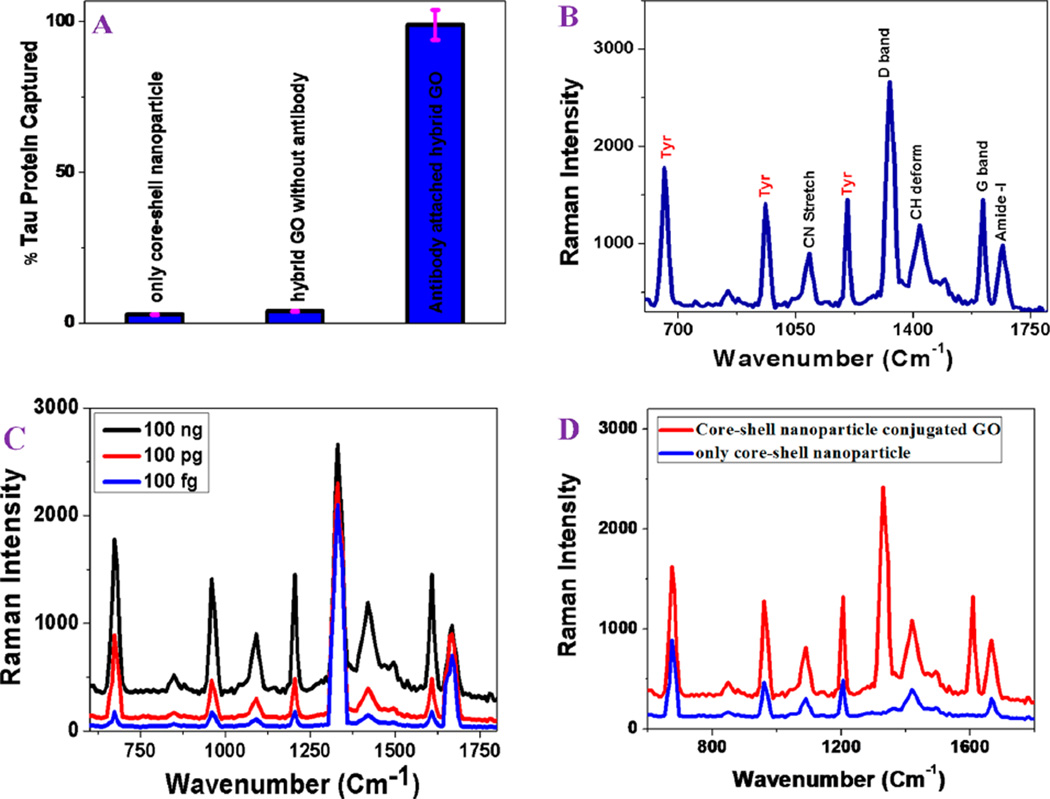
(A) ELISA results showing tau protein capture efficiency from an infected blood sample using anti-tau antibody attached plasmonicmagnetic hybrid graphene oxide based nanoplatform. Plots also show that separation efficiency is less than 4% in the absence of anti-tau antibody. (B) Spectrum showing SERS intensity from tau protein conjugated nanoplatform after magnetic separation. Observed SERS signal is directly from the tau protein. (C) Concentration dependent SERS spectra from tau protein conjugated nanoplatform after magnetic separation. Our experimental data show that the detection efficiency can be as low as 100 fg/mL. (D) Plot showing SERS enhancement of Raman signal from 50 ng tau protein in the presence of core–shell nanoparticle and from 500 ng tau protein in the presence of core–shell nanoparticle attached graphene oxide hybrid.
Experimental ELISA results clearly indicate that the tau protein separation efficiency is less than 4% when anti-tau antibody was not conjugated with multifunctional nanoplatform. As shown in Figure 3A, ELISA data demonstrated that around 97% of tau protein were captured when nanoplatform was conjugated with anti-tau antibody.
Next, we recorded SERS for the of tau protein. As shown in Figure 3B,C, our reported data show that the multifunctional nanoplatform can be used as a SERS “fingerprint” labeling of tau even at 100 fg/mL concentration level. As shown in Table 1, all the observed Raman bands could be assigned to tau protein vibration bands and graphene oxide D and G bands, consistent with the reported data.21 As shown in Figure 3B, other than the D and G graphene oxide bands, the strongest peaks are mainly due to tyrosine. It is very interesting to note that SERS spectra from tau protein is much difference than β amyloid as shown in Figures 2B and 3B. For β amyloid, the amide I, II, and III peaks are more prominent in SERS spectra. On the other hand, tyrosine peaks are more prominent for tau SERS spectra. Our experimental data clearly show that multifunctional hybrid graphene oxide based nanoplatform can be used as SERS “fingerprint” for AD biomarkers.
Next, we performed experiments to find the Raman signal enhancement from tau in the presence of core–shell nanoparticle based SERS probe without graphene oxide. To form the assembled structure of core–shell nanoparticle, we have added 0.1 M sodium chloride. Figure 3D shows the Raman spectra from 500 ng tau protein in the presence of core–shell nanoparticle. As shown in Figure 3D, other than D and G, all the observed Raman bands are similar when hybrid graphene oxide is used. By comparison the spectra, we found out that Raman intensity from tau protein is around 25 times more intense in the hybrid material than in the core–shell nanoparticle only. This enhancement can be due to the presence of graphene oxide, which enhances the Raman signal via chemical enhancement mechanism.
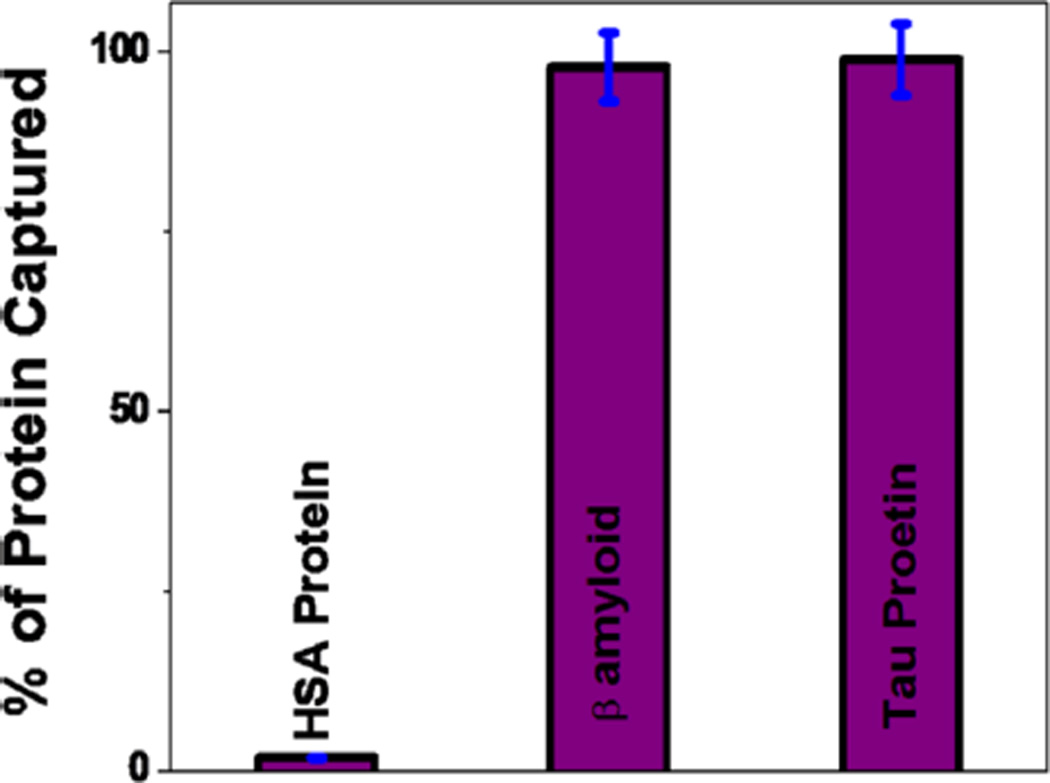
Human serum albumin (HSA) is one of the most abundant protein components in cerebrospinal fluid (CSF).4–13 As a result, it is important to find out whether nanoplatform can be used to separate AD biomarkers in the presence of HSA. For this purpose, at first we have developed anti-tau and anti-β amyloid antibody attached nanoplatform. Next, 1200 µL antibody attached hybrid graphene oxide was incubated with infected whole blood containing 100 ng/mL of tau protein, 100 ng/mL β amyloid, 1000 ng/mL HSA protein of 15 mL suspensions of citrated whole rabbit blood. We performed the incubation for 100 min with gentle shaking. After that, we used a bar magnet to separate tau protein attached multifunctional hybrid graphene oxide from infected blood samples. Next, we used an ELISA kit to determine the different protein capture efficiencies, as shown in Figure 4, which clearly shows that the HSA protein separation efficiency is less than 1% when anti-tau and anti-β amyloid antibody conjugated multifunctional nanoplatform was used. On the other hand, ELISA data clearly demonstrated that around 97% of tau protein and β amyloid were captured by the nanoplatform.
Figure 4.
ELISA results showing selective capturing of tau protein and β amyloid from infected blood sample using anti-tau and anti β amyloid antibody attached nanoplatform. Plots also show that separation efficiency is less than 1% in for HSA.
4. CONCLUSIONS
In conclusion, we have reported selective separation and accurate identification of AD biomarkers from infected blood samples using magnetic core-plasmonic shell nanoparticle attached hybrid graphene oxide based multifunctional nanoplatform. Experimental data from an ELISA kit demonstrate that the antibody attached multifunctional nanopaltform can be used for selective capture of more than 98% AD biomarkers from whole blood samples. We showed that the multifunctional hybrid graphene oxide based nanoplatform can be used as SERS “fingerprint” for β amyloid and tau protein detection in concentrations as low as 100 fg/mL. We reported that the detection limit for our platform is several orders of magnitude higher than the currently used ELISA kit for Aβ (0.312 ng/mL) and tau protein (0.15 ng/mL). We have shown that nanoplatform based can distinguish AD biomarkers from HSA, which is one of the most abundant protein components in CSF. Experimental results reported here open up a new possibility of rapid, easy, and reliable diagnosis AD biomarkers from possible clinical samples.
Supplementary Material
ACKNOWLEDGMENTS
P.C.R. thanks NSF-PREM (grant no. DMR-1205194) for their generous funding.
Footnotes
ASSOCIATED CONTENT
Detailed synthesis and characterization of plasmonic-magnetic multifunctional nanoplatform and other experiments. The Supporting Information is available free of charge on the ACS Publications website at DOI: 10.1021/acsami.5b03619.
The authors declare no competing financial interest.
REFERENCES
- 1.Dementia: A Public Health Priority. Geneva, Switzerland: World Health Organization; 2012. [Google Scholar]
- 2.Alzheimer’s Association. 2015 Alzheimer's Disease Facts and Figures. http://www.alz.org/facts/overview.asp#mortality. [Google Scholar]
- 3.Brookmeyer R, Johnson E, Ziegler-Graham K, Arrighi MH. The Global Burden Of Alzheimer’s Disease. Alzheimer’s Dementia. 2007;3:186–191. doi: 10.1016/j.jalz.2007.04.381. [DOI] [PubMed] [Google Scholar]
- 4.Hartmann T, Bieger SC, Brühl B, Tienari PJ, Ida N, Allsop D, Roberts GW, Masters CL, Dotti CG, Unsicker K, Beyreuther K. Distinct Sites Of Intracellular Production For Alzheimer’s Disease Aβ40/42 Amyloid Peptides. Nat. Med. 1997;3:1016–1020. doi: 10.1038/nm0997-1016. [DOI] [PubMed] [Google Scholar]
- 5.Blennow K, Hampel H, Weiner M, Zetterberg H. Cerebrospinal Fluid and Plasma Biomarkers in Alzheimer Disease. Nat. Rev. Neurol. 2010;6:131–144. doi: 10.1038/nrneurol.2010.4. [DOI] [PubMed] [Google Scholar]
- 6.Ray S, Britschgi M, Herbert C, Takeda-Uchimura Y, Boxer A, Blennow K, Friedman LF, Galasko DR, Jutel M, Karydas A, Kaye JA, Leszek J, Miller BL, Minthon L, Quinn JF, Rabinovici GD, Robinson WH, Sabbagh MN, So YT, Sparks DL, Tabaton M, Tinklenberg J, Yesavage JA, Tibshirani R, Wyss-Coray T. Classification and Prediction of Clinical Alzheimer’s Diagnosis based on Plasma Signaling Proteins. Nat. Med. 2007;13:1359–1362. doi: 10.1038/nm1653. [DOI] [PubMed] [Google Scholar]
- 7.Mapstone M, Cheema AK, Fiandaca MS, Zhong X, Mhyre TR, MacArthur LH, Hall WJ, Fisher SG, Peterson DR, Haley JM, Nazar MD, Rich SA, Berlau DJ, Peltz CB, Tan MT, Kawas CH, Federoff HJ. Plasma Phospholipids Identify Antecedent Memory Impairment in Older Adults. Nat. Med. 2014;20:415–418. doi: 10.1038/nm.3466. [DOI] [PMC free article] [PubMed] [Google Scholar]
- 8.Ferreira ST, Klein WL. The Aβ Oligomer Hypothesis for Synapse Failure and Memory Loss in Alzheimer’S Disease. Neurobiol. Learn. Mem. 2011;96:529–543. doi: 10.1016/j.nlm.2011.08.003. [DOI] [PMC free article] [PubMed] [Google Scholar]
- 9.Amiri H, Saeidi K, Borhani P, Manafirad A, Ghavami M, Zerbi V. Alzheimer’s Disease: Pathophysiology and Applications of Magnetic Nanoparticles as MRI Theranostic Agents. ACS Chem. Neurosci. 2013;4:1417–1429. doi: 10.1021/cn4001582. [DOI] [PMC free article] [PubMed] [Google Scholar]
- 10.Kepp KP. Bioinorganic Chemistry of Alzheimer’s Disease. Chem. Rev. 2012;112:5193–5239. doi: 10.1021/cr300009x. [DOI] [PubMed] [Google Scholar]
- 11.He X-P, Deng Q, Cai L, Wang C-Z, Zang Y, Li J, Chen G-R, Tian H. Fluorogenic Resveratrol-Confined Graphene Oxide For Economic And Rapid Detection Of Alzheimer’s Disease. ACS Appl. Mater. Interfaces. 2014;6:5379–5382. doi: 10.1021/am5010909. [DOI] [PubMed] [Google Scholar]
- 12.Li M, Yang X, Ren J, Qu K, Qu X. Using Graphene Oxide High Near-Infrared Absorbance For Photothermal Treatment Of Alzheimer’s Disease. Adv. Mater. 2012;24:1722–1728. doi: 10.1002/adma.201104864. [DOI] [PubMed] [Google Scholar]
- 13.Paulite M, Blum C, Schmid T, Opilik L, Eyer K, Walker GC, Zenobi R. Full Spectroscopic Tip-Enhanced Raman Imaging of Single Nanotapes Formed from β-Amyloid(1–40) Peptide Fragments. ACS Nano. 2013;7:911–920. doi: 10.1021/nn305677k. [DOI] [PubMed] [Google Scholar]
- 14.He X-P, Zang Y, James TD, Li J, Chen GR. Probing Disease-Related Proteins with Fluorogenic Composite Materials. Chem. Soc. Rev. 2015 doi: 10.1039/c4cs00252k. Advance Article. [DOI] [PubMed] [Google Scholar]
- 15.Mahmoudi M, Quinlan-Pluck F, Monopoli MP, Sheibani S, Vali H, Dawson KA, Lynch I. Influence of the Physiochemical Properties of Superparamagnetic Iron Oxide Nanoparticles on Amyloid β Protein Fibrillation in Solution. ACS Chem. Neurosci. 2013;4:475–485. doi: 10.1021/cn300196n. [DOI] [PMC free article] [PubMed] [Google Scholar]
- 16.Neely A, Perry C, Varisli B, Singh AK, Arbneshi T, Senapati D, Kalluri JR, Ray PC. Ultrasensitive and Highly Selective Detection of Alzheimer’s Disease Biomarker Using Two-Photon Rayleigh Scattering Properties of Gold Nanoparticle. ACS Nano. 2009;3:2834–2840. doi: 10.1021/nn900813b. [DOI] [PMC free article] [PubMed] [Google Scholar]
- 17.Tiwari SK, Agarwal S, Seth B, Yadav A, Nair S, Bhatnagar P, Karmakar M, Kumari M, Chauhan LK, Patel DK, Srivastava V, Singh D, Gupta SK, Tripathi A, Chaturvedi RK, Gupta KC. Curcumin-Loaded Nanoparticles Potently Induce Adult Neurogenesis and Reverse Cognitive Deficits in Alzheimer’s Disease Model via Canonical Wnt/β-Catenin Pathway. ACS Nano. 2014;8:76–103. doi: 10.1021/nn405077y. [DOI] [PubMed] [Google Scholar]
- 18.Dong J, Atwood CS, Anderson VE, Siedlak SL, Smith MA, Perry G, Carey PR. Metal Binding and Oxidation of Amyloid-Beta within Isolated Senile Plaque Cores: Raman Microscopic Evidence. Biochemistry. 2003;42:2768–2773. doi: 10.1021/bi0272151. [DOI] [PubMed] [Google Scholar]
- 19.Haes AJ, Chang L, Klein WL, Van Duyne RP. Detection of a Biomarker for Alzheimer’s Disease from Synthetic and Clinical Samples using a Nanoscale Optical Biosensor. J. Am. Chem. Soc. 2005;127:2264–2271. doi: 10.1021/ja044087q. [DOI] [PubMed] [Google Scholar]
- 20.Chou IH, Benford M, Beier HT, Coté GL, Wang M, Jing N, Kameoka J, Good TA. Nanofluidic Biosensing for β-Amyloid Detection Using Surface Enhanced Raman Spectroscopy. Nano Lett. 2008;8:1729–1735. doi: 10.1021/nl0808132. [DOI] [PMC free article] [PubMed] [Google Scholar]
- 21.Englund H, Sehlin D, Johansson A-S, Nilsson LNG, Gellerfors Pr, Paulie S, Lannfelt L, Pettersson FE. Sensitive ELISA Detection of Amyloid-Beta Protofibrils in Biological Samples. J. Neurochem. 2007;103:334–345. doi: 10.1111/j.1471-4159.2007.04759.x. [DOI] [PubMed] [Google Scholar]
- 22.Juszczak LJ. Comparative Vibrational Spectroscopy of Intracellular Tau and Extracellular Collagen I Reveals Parallels of Gelation and Fibrillar Structure. J. Biol. Chem. 2004;279:7395–7404. doi: 10.1074/jbc.M309971200. [DOI] [PubMed] [Google Scholar]
- 23.Wang Y, Polavarapu L, Liz-Marzán LM. Reduced Graphene Oxide-Supported Gold Nanostars for Improved SERS Sensing and Drug Delivery. ACS Appl. Mater. Interfaces. 2014;6:21798–21805. doi: 10.1021/am501382y. [DOI] [PubMed] [Google Scholar]
- 24.Fan Z, Shelton M, Singh AK, Senapati D, Khan SA, Ray PC. Multifunctional Plasmonic Shell–Magnetic Core Nanoparticles for Targeted Diagnostics, Isolation, and Photothermal Destruction of Tumor Cells. ACS Nano. 2012;6:1075–1083. doi: 10.1021/nn2045246. [DOI] [PMC free article] [PubMed] [Google Scholar]
- 25.Singh AK, Khan SA, Fan Z, Demeritte T, Senapati D, Kanchanapally R, Ray PC. Development of a Long-Range Surface-Enhanced Raman Spectroscopy Ruler. J. Am. Chem. Soc. 2012;134:8662–8669. doi: 10.1021/ja301921k. [DOI] [PubMed] [Google Scholar]
- 26.Levin CS, Hoffman C, Ali TA, Kelly AT, Morosan E, Nordlander P, Whitmire KH, Halas NJ. Magnetic–Plasmonic Core–Shell Nanoparticles. ACS Nano. 2009;3:1379–1388. doi: 10.1021/nn900118a. [DOI] [PMC free article] [PubMed] [Google Scholar]
- 27.Jung N, Crowther AC, Kim N, Kim P, Brus L. Raman Enhancement on Graphene: Adsorbed and Intercalated Molecular Species. ACS Nano. 2010;4:7005–7013. doi: 10.1021/nn102227u. [DOI] [PubMed] [Google Scholar]
- 28.Ferrari AC, Basko DM. Raman Spectroscopy as a Versatile Tool for Studying the Properties of Graphene. Nat. Nanotechnol. 2013;8:235–246. doi: 10.1038/nnano.2013.46. [DOI] [PubMed] [Google Scholar]
- 29.Fan Z, Kanchanapally R, Ray PC. Hybrid Graphene Oxide Based Ultrasensitive SERS Probe for Label-Free Biosensing. J. Phys. Chem. Lett. 2013;4:3813–3818. [Google Scholar]
- 30.Kanchanapally R, Sinha SS, Fan Z, Dubey M, Zakar E, Ray PC. Graphene Oxide-Gold Nanocage Hybrid for Trace Level Identification of Nitro Explosives Using Raman Fingerprint. J. Phys. Chem. C. 2014;4:7070–7075. [Google Scholar]
- 31.Kim NH, Lee SJ, Moskovits M. Aptamer-Mediated Surface-Enhanced Raman Spectroscopy Intensity Amplification. Nano Lett. 2010;10:4181–4185. doi: 10.1021/nl102495j. [DOI] [PubMed] [Google Scholar]
- 32.Rao CNR, Gopalakrishnan K, Maitra U. Comparative Study of Potential Applications of Graphene, MoS2, and Other Two-Dimensional Materials in Energy Devices, Sensors, and Related Areas. ACS Appl. Mater. Interfaces. 2015;7:7809–7832. doi: 10.1021/am509096x. [DOI] [PubMed] [Google Scholar]
- 33.Kleinman SL, Ringe E, Valley N, Wustholz KL, Phillips E, Scheidt KA, Schatz GC, Van Duyne RP. Single-Molecule Surface-Enhanced Raman Spectroscopy of Crystal Violet Isotopologues: Theory and Experiment. J. Am. Chem. Soc. 2011;133:4115–4122. doi: 10.1021/ja110964d. [DOI] [PubMed] [Google Scholar]
- 34.Murphy S, Huang L, Kamat PV. Reduced Graphene Oxide–Silver Nanoparticle Composite as an Active SERS Material. J. Phys. Chem. C. 2013;117:4740–4747. [Google Scholar]
- 35.Dasary SR, Singh AK, Senapati D, Yu H, Ray PC. Gold Nanoparticle Based Label-Free SERS Probe for Ultrasensitive and Selective Detection of Trinitrotoluene. J. Am. Chem. Soc. 2009;131:13806–13812. doi: 10.1021/ja905134d. [DOI] [PubMed] [Google Scholar]
- 36.Brown LV, Zhao K, King N, Sobhani H, Nordlander P, Halas NJ. Surface-Enhanced Infrared Absorption Using Individual Cross Antennas Tailored to Chemical Moieties. J. Am. Chem. Soc. 2013;135:3688–3695. doi: 10.1021/ja312694g. [DOI] [PubMed] [Google Scholar]
- 37.Hummers WS, Offeman RE. Preparation of Graphitic Oxide. J. Am. Chem. Soc. 1958;80:1339–1339. [Google Scholar]
- 38.Geim AK, Novoselov KS. The Rise of Graphene. Nat. Mater. 2007;6:183–191. doi: 10.1038/nmat1849. [DOI] [PubMed] [Google Scholar]
- 39.Lightcap IV, Kamat PV. Graphitic Design: Prospects of Graphene-Based Nanocomposites for Solar Energy Conversion, Storage, and Sensing. Acc. Chem. Res. 2013;46:2235–2243. doi: 10.1021/ar300248f. [DOI] [PubMed] [Google Scholar]
- 40.Kamat PV. Graphene-Based Nanoarchitectures. Anchoring Semiconductor and Metal Nanoparticles on a Two-Dimensional Carbon Support. J. Phys. Chem. Lett. 2010;1:520–527. [Google Scholar]
- 41.Fan Z, Yust B, Nellore BOV, Sinha SS, Kanchanapally R, Crouch RA, Pramanik A, Reddy SC, Sardar D, Ray PC. Accurate Identification and Selective Removal of Rotavirus Using a Plasmonic–Magnetic 3D Graphene Oxide Architecture. J. Phys. Chem. Lett. 2014;5:3216–3322. doi: 10.1021/jz501402b. [DOI] [PubMed] [Google Scholar]
- 42.Loh KP, Bao Q, Eda G, Chowalla M. Graphene Oxide As a Chemically Tunable Platform for Optical Applications. Nat. Chem. 2010;2:1015–1024. doi: 10.1038/nchem.907. [DOI] [PubMed] [Google Scholar]
- 43.Yin PT, Shah S, Chhowalla M, Lee KB. Design, Synthesis, and Characterization of Graphene–Nanoparticle Hybrid Materials for Bioapplications. Chem. Rev. 2015;115:2483–2531. doi: 10.1021/cr500537t. [DOI] [PMC free article] [PubMed] [Google Scholar]
- 44.Wang JK, Xiong GM, Zhu M, Özyilmaz B, Neto AHC, Tan NS, Choong C. Polymer-Enriched 3D Graphene Foams for Biomedical Applications. ACS Appl. Mater. Interfaces. 2015;7:8275–8283. doi: 10.1021/acsami.5b01440. [DOI] [PubMed] [Google Scholar]
- 45.Kim DW, Kim YH, Jeong HS, Jung H-T. Direct Visualization of Large-Area Graphene Domains and Boundaries by Optical Birefringency. Nat. Nanotechnol. 2012;7:29–34. doi: 10.1038/nnano.2011.198. [DOI] [PubMed] [Google Scholar]
- 46.Wu ZS, Yang S, Sun Y, Parvez K, Feng X, Müllen K. 3D Nitrogen-Doped Graphene Aerogel-Supported Fe3O4 Nanoparticles As Efficient Electrocatalysts for the Oxygen Reduction Reaction. J. Am. Chem. Soc. 2012;134:9082–9085. doi: 10.1021/ja3030565. [DOI] [PubMed] [Google Scholar]
- 47.Abramczyk H, Brozek-Pluska B. Raman Imaging in Biochemical and Biomedical Applications. Diagnosis and Treatment of Breast Cancer. Chem. Rev. 2013;113:5766–5781. doi: 10.1021/cr300147r. [DOI] [PubMed] [Google Scholar]
- 48.Sinha SS, Paul DK, Kanchanapally R, Pramanik A, Chavva RS, Viraka Nellore BP, Jones SJ, Ray PC. Long-range Two-Photon Scattering Spectroscopy Ruler for Screening Prostate Cancer Cells. Chem. Sci. 2015;6:2411–2418. doi: 10.1039/c4sc03843f. [DOI] [PMC free article] [PubMed] [Google Scholar]
Associated Data
This section collects any data citations, data availability statements, or supplementary materials included in this article.


