

Abstract
There is a medical need for safe and efficacious anti-obesity drugs with acceptable side effect profiles. To mitigate the challenge posed by translating target interaction across species and balancing beneficial vs. adverse effects, a positron emission tomography (PET) approach could help guide clinical dose optimization. Thus, as part of a compound differentiation effort, three novel selective CB1 receptor (CB1R) antagonists, developed by AstraZeneca (AZ) for the treatment of obesity, were compared with two clinically tested reference compounds, rimonabant and taranabant, with regard to receptor occupancy relative to dose and exposure. A total of 42 PET measurements were performed in 6 non-human primates using the novel CB1R antagonist radioligand [11C]SD5024. The AZ CB1R antagonists bound in a saturable manner to brain CB1R with in vivo affinities similar to that of rimonabant and taranabant, compounds with proven weight loss efficacy in clinical trials. Interestingly, it was found that exposures corresponding to those needed for optimal clinical efficacy of rimonabant and taranabant resulted in a CB1R occupancy typically around ~20–30%, thus much lower than what would be expected for classical G-protein coupled receptor (GPCR) antagonists in other therapeutic contexts. These findings are also discussed in relation to emerging literature on the potential usefulness of ‘neutral’ vs. ‘classical’ CB1R (inverse agonist) antagonists. The study additionally highlighted the usefulness of the radioligand [11C]SD5024 as a specific tracer for CB1R in the primate brain, though an arterial input function would ideally be required in future studies to further assure accurate quantitative analysis of specific binding.
Keywords: cannabinoid 1 receptor (CB1R) antagonists, obesity, positron emission tomography (PET), receptor occupancy, [11C]SD5024, rimonabant, taranabant
1. Introduction
Cannabinoid 1 receptors (CB1R) are among the most abundantly expressed G protein-coupled receptors in brain (Mackie, 2005) and implicated in the control of appetite and motivation to eat (Kirkham et al., 2002). In addition, CB1R are expressed in metabolically active peripheral organs (adipose tissue, skeletal muscles and liver; Nogueiras et al., 2009) stressing their role in the overall regulation of energy balance (Wierzbicki, 2006).
Much effort has been put into the discovery and development of CB1R ligands able to block the effects of endogenous cannabinoids (endocannabinoids, eCBs), given the potential for therapeutic effect of such agents in a variety of somatic and psychiatric disorders. Whereas a number of therapeutic areas have been proposed (e.g., smoking cessation, cognition-promoting), only the anti-obesity indication has been clinically validated thus far, and has been the main focus of major Pharma programmes with CB1R blocking agents over the last decade. Such compounds have interchangeably been referred to as antagonists or inverse agonists at the CB1R, the latter denomination reflecting their ability in vitro to reverse constitutive G-protein activity in the absence of an agonist (Howlett et al., 2011). For simplicity, we have chosen to refer to the CB1R ligands in the present context as CB1R antagonists (cf. further Discussion section).
In rodents, administration of CB1R antagonists results in decreased food intake and body weight, and may also stimulate adiponectin production and secretion, inhibit lipogenesis and increase glucose uptake (Wu et al., 2011). The preclinical observations have been validated in humans by extensive clinical studies with rimonabant, confirming weight loss and improved lipid and glucose metabolism in treated obese humans (Van Gaal et al., 2005; Després et al., 2005; Pi-Sunyer et al., 2006). Similar findings have also been reported with taranabant and otenabant (Aronne et al., 2010; 2011). The clinical trials have, however, additionally revealed adverse psychiatric side effects, particularly depression, which has led to withdrawal of the drugs from clinical use (Beyer et al., 2010).
PET-imaging in non-human primates using a suitable radioligand may confirm binding to CB1R in brain and serve for translation of dose- and exposure-response relationships to humans. Several PET radioligands have been exploited for measuring CB1R interactions in non-human primates and human subjects: [18F]MK9470 (Burns et al., 2007; Sanabria-Bohórquez et al., 2010), [11C]OMAR (Wong et al., 2010), [11C]MePPEP (Terry et al., 2009) and [18F]FMPEP-d2 (Terry et al., 2010). Promising characteristics have been demonstrated for [18F]FMPEP-d2, which shows a high imaging signal to noise ratio, but slow washout from brain. In search for improved radioligands [11C]SD5024 has been developed (Donohue et al., 2008a,b). This radioligand has been shown to bind with high-affinity (Ki = 0.5 nM; IC50 = 2.8 nM) and selectivity to CB1R, and display high brain uptake and a distribution pattern in line with the known CB1R distribution in the non-human primate and human brain (Herkenham et al., 1990; Glass et al., 1997; Tsujikawa et al., 2014) and should, thus, be useful for examination of drug effects on CB1R binding by PET in vivo.
The present study in non-human primates was part of a compound differentiation effort and aimed to examine CB1R occupancy of three novel selective CB1R antagonists that were considered for development by AstraZeneca (AZ) as anti-obesity therapeutics. These AZ compounds exhibit promising body weight reductions and metabolic improvements in rodent models of obesity and metabolic derangement (Table 1 and AZ unpublished data). The PET evaluation in non-human primates was thus conducted to search for optimal dosing towards development studies, and to explore dose/exposure vs. occupancy in relation to expected clinical effects with these agents. For the purpose of comparison, CB1R occupancy of rimonabant and taranabant was therefore also examined. This study also extends the pharmacological characterization of [11C]SD5024 binding per se by using CB1R antagonists of distinct chemical classes.
Table 1.
Chemical structures, names, and in vitro and in vivo characteristics of CB1R antagonists in the study.
| Compound | Chemical structure and name | In vitro | In vivo (mouse) | |||
|---|---|---|---|---|---|---|
| hCB1R Ki (nM) a |
mCB1R Ki (nM) a |
Plasma Cmax (μmol/L); AUC0–24h (μmol*h/L) b |
CB1R- mediated appetite suppression c |
Maximal in vivo body weight loss (% of baseline) d |
||
| AZ compound 1 |
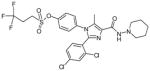 4-[2-(2,4-Dichlorophenyl)-5-methyl-4-(piperidin-1-ylcarbamoyl)-1H-imidazol-1-yl]phenyl 3,3,3-trifluoropropane-1-sulfonate |
0.19 ± 0.01 | 0.03 ± 0.002 | 1.2; 6.3 | Yes | ~23–25% |
| AZ compound 2 |
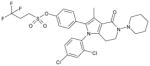 4-[1-(2,4-Dichlorophenyl)-3-methyl-4-oxo-5-piperidin-1-yl-4,5,6,7-tetrahydro-1H-pyrrolo[3,2-c]pyridin-2-yl]phenyl 3,3,3-trifluoropropane-1-sulfonate |
0.20 ± 0.01 | 0.02 ± 0.001 | 0.48; 3.6 | Yes | ~30% |
| AZ compound 3 |
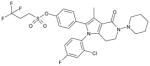 4-[1-(2-Chloro-4-fluorophenyl)-3-methyl-4-oxo-5-piperidin-1-yl-4,5,6,7-tetrahydro-1H-pyrrolo[3,2-c]pyridin-2-yl]phenyl 3,3,3-trifluoropropane-1-sulfonate |
0.24 ± 0.01 | 0.03 ± 0.002 | 0.04; 0.89 | Yes | ~30% |
| Rimonabant |
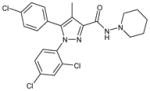 5-(4-Chlorophenyl)-1-(2,4-dichloro-phenyl)-4-methyl-N-(piperidin-1-yl)-1H-pyrazole-3-carboxamide |
0.37 ± 0.01 | 0.09 ± 0.010 | 1.05; 9.0 | Yes | ~20% |
| Taranabant |
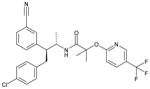 N-[(2S,3S)-4-(4-Chlorophenyl)-3-(3-cyanophenyl)-2-butanyl]-2-methyl-2-{[5-(trifluoromethyl)-2-pyridinyl]oxy}propanamide |
0.09 ± 0.01 | 0.01 ± 0.001 | 0.70; 5.3 | Yes | ~30% |
| [11C]SD5024 PET ligand |
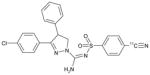 3-(4-Chlorophenyl)-N-[(4-[11C]cyanophenyl)sulfonyl-4-phenyl-4,5-dihydro-1H-pyrazole-1-carboxamidine |
ND | ND | ND | ND | ND |
Inhibition of CB1R agonist (CP55,940)-induced activation of GTPγS production in vitro in recombinant human (hCB1R) or native mouse brain tissue (mCB1R) cell membrane assays; Ki values for the CB1R antagonists given in nM.
Mouse plasma Cmax (μmol/L) and AUC0–24h (μmol*h/L) after single p.o. administration of 6 (taranabant, AZ compound 2 and 3) or 20 μmol/kg (rimonabant, AZ compound 1).
Ability to elicit appetite suppression in an acute food intake model (effect abolished in matching CB1R KO animals; AZ data on file).
Approximate maximal vehicle-corrected body weight loss vs. baseline in mice on ad lib. ‘cafeteria’ diet after 3wks repeated p.o. administration of the CB1R antagonists (AZ data on file).
ND = Not determined.
2. Materials and Methods
The study was performed according to “The Guidelines for Planning, Conducting, and Documenting Experimental Research” (Dnr 4820/06-600) of the Karolinska Institute as well as conforming to the guidelines in the European Communities Council Directive of 24 November 1986 (86/609/EEC) and the Principles of Laboratory Animal Care (NIH publication No. 85-23, revised 1985). The study was approved by the Animal Ethics Committee at Stockholms Norra Djurförsöksetiska Nämnd, and was consistent with applicable regulatory requirements and the AstraZeneca policy on Bioethics. The study was carried out from June 2007 to January 2008.
2.1 Animals - non-human primates
Six female normal-weight cynomolgus monkeys (Macaca fascicularis; weight from 3.4 to 5.4 kg) were included in the study. The monkeys were housed at the Astrid Fagraeus Laboratory at Karolinska Institute, Solna, Sweden. Anaesthesia was induced and maintained for the duration of each measurement using repeated intramuscular injection of a mixture of ketamine (3 to 4 mg/kg/h Ketalar®, Parke-Davis) and xylazine hydrochloride (1 to 2 mg/kg/h; Rompun® Vet. Bayer of Sweden). A head fixation system was used to secure a fixed position of the monkey’s head during the PET measurements (Karlsson et al., 1993). Body temperature was maintained by a Bair Hugger model 505 (Arizant Healthcare, Eden Prairie, MN, USA) and monitored by a rectal thermometer (Precision Thermometer, Harvard Apparatus). Heart and respiration rates were measured every 20 minutes throughout the experiment. Changes in the vital parameters were recorded if they were 25% different compared to the baseline values.
2.2 Study design
The study included 14 experimental sessions, two to four per tested drug. Each experimental session consisted of three PET-measurements in the same monkey: one at baseline (in the morning) and two after pretreatment with different drugs doses (Fig. 1). The study design was adaptive, i.e. doses and the numbers of doses to be tested were chosen depending on the results of the preceding session.
Figure 1.

Design of PET-measurements during experimental session. Time −50/−40 indicates a blood sample taken immediately at the end of infusion.
2.3 Study compounds
Five CB1R antagonists were tested. The compounds were administered as intravenous infusion over 10–20 min, 60 min before the start of PET measurements. The chemical names, structures and test doses are given in Tables 1 and 2. Test and reference compounds were manufactured at Department of Process R&D, AstraZeneca R&D, Södertälje, Sweden (AZ compound 1), or at the Department of Medicinal Chemistry, AstraZeneca R&D, Mölndal, Sweden (AZ compounds 2, 3 and taranabant; Chen et al., 2007). Rimonabant was sourced from Sungene GmbH, Gatersleben, Germany.
Table 2.
Reduction in CB1R binding in the striatum induced by the test compounds.
| Dose (mg/kg) | Plasma concentration (μmol/L) | Monkey | Receptor Occupancy (%) |
|---|---|---|---|
|
| |||
| AZ compound 1 | |||
| 0.03 | 0 | 1 | 0.4* |
| 0.3 | 0.038 | 1 | 35 |
| 0.3 | 0.055 | 2 | 23* |
| 1.0 | 0.154 | 2 | 73 |
| 2.0 | 0.999 | 3 | 88 |
| 6.0 | 2.220 | 3 | 99 |
|
| |||
| AZ compound 2 | |||
| 0.06 | 0.023 | 2 | 0.6 |
| 0.2 | 0.050 | 1 | −10 |
| 0.2 | 0.057 | 4 | 9.2 |
| 0.25 | 0.083 | 5 | 1.4 |
| 0.3 | 0.143 | 2 | 35 |
| 0.6 | 0.252 | 5 | 64 |
| 1.0 | 0.401 | 4 | 69 |
| 2.0 | 0.560 | 1 | 78 |
|
| |||
| AZ compound 3 | |||
| 0.02 | 0.001 | 4 | −18 |
| 0.06 | 0.020 | 4 | −12 |
| 0.06 | 0.031 | 3 | 0.7 |
| 0.2 | 0.084 | 4 | 14 |
| 0.4 | 0.245 | 3 | 59 |
| 0.6 | 0.275 | 4 | 82 |
|
| |||
| Rimonabant | |||
| 0.1 | 0.092 | 5 | −3.1 |
| 0.2 | 0.078 | 2 | 13 |
| 0.5 | 0.389 | 5 | 20 |
| 0.7 | 0.355 | 2 | 56 |
|
| |||
| Taranabant | |||
| 0.005 | 0.002 | 7 | 1.7 |
| 0.015 | 0.010 | 7 | −3.9 |
| 0.05 | 0.015 | 1 | 35 |
| 0.2 | 0.093 | 1 | 94 |
In addition to striatum, receptor occupancy was also analyzed in the frontal cortex, cerebellum and thalamus (not shown). CB1R occupancy was similar across brain regions when the same dose was compared. Striatum was chosen as representative example, as the region with highest receptor density. CB1R binding was calculated using the ratio method (50–122 min) using pons as reference region.
Data for 50–93 minutes were used for the calculations.
Plasma concentration values correspond to the mid-point of PET measurements, 90 min.
The compounds were formulated as a suspension of crystalline nanoparticles, with the exception of taranabant, which was formulated as a suspension of amorphous nanoparticles (Department of Pharmaceutical Development, AstraZeneca R&D, Mölndal, Sweden). The suspensions were diluted to appropriate concentrations with 5% mannitol solution and kept frozen until administration. Before intravenous administration to the animals, the suspensions were further diluted using 5% mannitol solution to suitable concentration according to the intended dose and dose volume.
2.4 PET measurements
2.4.1 Radiochemistry
Reference SD5024 ((−)-3-(4-chlorophenyl)-N′-[(4-cyanophenyl)sulfonyl]-4-phenyl-4,5-dihydro-1H-pyrazole-1-carboxamidine) and its corresponding iodo precursor for radiolabeling ((−)-3-(4-chlorophenyl)-N′-[(4-iodophenyl)sulfonyl]-4-phenyl-4,5-dihydro-1H-pyrazole-1-carboxamidine) were supplied by Department of Medicinal Chemistry, AstraZeneca R&D Mölndal, Sweden. All other chemicals were obtained from commercial sources and were of analytical grade.
Radiosynthesis of [11C]SD5024 was performed in a custom-made semi-automated synthesis module (Airaksinen et al., 2008) via palladium-mediated [11C]cyanation as previously reported (Donohue et al., 2008a). Briefly, [11C]hydrogen cyanide was produced in accordance with the method of Airaksinen et al (2008) and trapped in a solution of KH2PO4 (0.5 mg, 3.67 μmol) in DMSO (0.3 mL) to provide [11C]potassium cyanide. Subsequently, this solution was transferred to a vial containing the iodo precursor to SD5024 (1 mg, 1.77 μmol) and Pd(PPh3)4 (5.5 mg, 4.76 μmol) in DMSO (0.3 mL). The mixture was heated at 135 °C for 5 min, and then cooled to room temperature after which HPLC mobile phase (MeCN-0.01M H3PO4, 55: 45 v/v; 1 mL) was added. [11C]SD5024 was separated from this solution by reversed phase HPLC on a μ-Bondapak C-18 column (300 × 7.8 mm, 10 μm; Waters) eluted at 6 mL/min with column effluent monitored in series for absorbance at 254 nm and for radioactivity with a GM tube. The fraction containing [11C]SD5024 (tR = 12.3 min) was collected and evaporated to dryness. The residue was dissolved in sterile physiological phosphate-buffered saline (pH = 7.4; 8 mL) and passed through a sterile filter (0.22 μm pore size; Millex GV; Millipore Corporation).
The radiochemical purity and identity of the product were determined with analytical reversed phase HPLC on a μ-Bondapak C-18 column (300 × 3.9 mm, 10 μm; Waters) eluted with MeCN-0.01M-H3PO4 (55: 55 v/v) at 3 mL/min and the column effluent was monitored in series for absorbance at 254 nm and for radioactivity with a β-flow radio detector (Beckman). [11C]SD5024 eluted with the same retention time as that for the reference standard of SD5024 (tR = 3.8 min), thereby confirming the radiochemical identity of the product. The radiochemical purity of [11C]SD5024 exceeded 99%.
In each PET-measurement a sterile physiological phosphate buffer (pH = 7.4) solution containing [11C]SD5024 was injected as a bolus into a sural vein during 5 s with simultaneous start of PET-data acquisition. The mean injected radioactivity was 141±19 MBq (range 91–166 MBq). The specific radioactivity of the radioligand at time of injection was 155±77 GBq/μmol (range 34 to 430 GBq/μmol), and the injected mass was 0.54 ± 0.32 μg (range 0.14 to 2 μg).
2.4.2 PET system, data acquisition
Radioactivity in brain was measured with the Siemens ECAT Exact HR 47 system in 3D-mode (Wienhard et al., 1994). The transversal resolution in the reconstructed image is about 3.8 mm full width half maximum (FWHM) and the axial resolution is 3.125 mm. Attenuation correction was obtained with 3 rotating 68Ge line sources and transmission data were collected in 2D mode. The raw PET data were then reconstructed using standard filtered back projection. The following reconstruction parameters were used: 2 mm Hanning Filter, scatter correction, a zoom factor of 2.17, and a 128 × 128 matrix size.
The first two PET measurements (using AZ compound 1) were treated as pilot experiments and were 90 min and 150 min, respectively. All subsequent measurements were 122 minutes divided into 30 frames.
2.4.3 PET image analysis
Regions of interest (ROIs)
Regions of interest were delineated on PET summation images representing radioactivity measured from 5 min after i.v. injection to the end of the measurement. The whole brain contour and ROIs for selected brain regions was defined according to an atlas of a cryosectioned cynomolgus monkey head in situ (Karlsson et al., 1993). ROIs were delineated for frontal cortex, striatum, thalamus, cerebellum and pons (see Supplementary Figure 1). These regions were chosen as representing regions with different CB1R density and as reference region (pons), respectively (Herkenham et al., 1990). Small brain regions, such as the hypothalamic nuclei, would also have been of interest based on their role in the body metabolism and obesity. However, as hypothalamic brain regions are small and have relatively low receptor density the conditions were unfavourable for accurate quantitative image analysis in the non-human primate. Therefore, those small regions were not examined.
Quantitative analyses
Regional estimates for [11C]SD5024 binding to the CB1R were obtained for baseline and post-drug administration measurements, respectively, using the biomedical image quantification software PMOD 2.9 (PMOD Technologies Ltd, Zurich, Switzerland). Radioactivity was calculated for the sequence of time-frames, corrected for the radioactivity decay, and plotted versus time. For each region a time-activity curve was generated and radioactivity expressed as kBq/mL. All calculations were based on the assumption that radioactivity in brain represents unchanged radioligand (Ito et al., 1998).
To obtain the percentage of injected dose (%ID) the radioactivity concentration in the ROI for the whole brain was multiplied with the estimated brain volume of 65 mL for a cynomolgus monkey weighing 4 kg, divided by the radioactivity injected and multiplied by 100. Radioactivity concentration was recalculated into standardized uptake value (SUV), to correct for differences in administered radioactivity and body weight (%SUV=100*(local radioactivity concentration)/(administered radioactivity/body weight)).
The time curve for regional radioactivity concentration was used to calculate the area-under-the-curve (AUC) (Burns et al., 2007). Pons was selected as a reference region due to its known low density of CB1R compared to other regions (Herkenham et al., 1990). Radioligand binding (BP) to CB1R was calculated using a target to reference region ratio method.
The AUC for radioligand in the target region, e.g., striatum (AUCSTRIATUM) and the pons (AUCPONS) was calculated for the time interval 50–122 min after radioligand injection. The striatum was chosen as representative target region due to the highest radioligand binding, lowest noise in the data analysis. The binding potential (BPAUC) was calculated as:
| (1) |
CB1R occupancy (RO) was calculated as the percent change in BPAUC after administration of a CB1R antagonist as compared to baseline according to the equation:
| (2) |
where BPAUC_BL and BPAUC_DRUG were obtained at baseline and after CB1R antagonist dosing, respectively.
The relationship between CB1R occupancy and compound dose was interpreted by fitting the curvilinear function to experimental data:
| (3) |
Similarly, the relationship between CB1R occupancy and compound plasma concentration was interpreted by fitting the curvilinear function to experimental data:
| (4) |
where Cp is the compound plasma concentration during the midpoint of the PET AUC interval (at 90 min), Occ is receptor occupancy, ID50 is the dose required to induce 50% receptor occupancy (RO), and Ki,pl is the inhibition constant corresponding to the compound plasma concentration required for half-maximum CB1R occupancy. The curve fitting was made using GraphPad Prism version 5.00 for Windows (GraphPad Software, USA).
The curves describing the relationship between occupancy and dose/plasma exposure were visually compared and ranked. Estimates of Ki,pl and ID50 values were obtained for AZ compound 1, but full quantitative analysis for other compounds was not performed due to the limited number of experiments for each compound.
2.5 Blood sampling, radioactivity measurements and bioanalysis
During the baseline PET measurements no blood samples were collected. In each pre-treatment measurement venous blood samples (about 1 mL) were taken for analysis of drug plasma concentrations and radioactivity measurements in blood and plasma to assure radioligand distribution in the central blood compartment (Fig. 1). For AZ compound 1 additional (pilot) blood sampling time point was at 150 min at the first experimental session.
The blood samples were collected into spray-dried K2-EDTA tubes. Radioactivity was immediately measured in a well-counter cross-calibrated with the PET system. Thereafter, plasma was prepared by centrifugation (3500 × g for 4 min). The plasma (at least 200 μL) was transferred into Nunc Cryotube™ and radioactivity was measured in a well counter. The remaining plasma samples were frozen and stored at or below −70 °C. Determinations of plasma concentrations were carried out at Clinical Pharmacology & DMPK, AstraZeneca R&D Mölndal, Sweden. The total plasma concentration of AZ compounds 1, 2, and 3, and of rimonabant and taranabant (including its main, hydroxylated, biologically active metabolite M1; Reddy et al., 2010), was determined using liquid-liquid extraction followed by liquid chromatography with mass spectrometric detection (LC-MS/MS). The design of the study, including plasma samples being drawn only during the limited time interval of the PET measurements, precluded full analysis of pharmacokinetic variables.
3. Results
Altogether 42 PET measurements were performed in the 6 cynomolgus monkeys. Peak radioactivity in brain ranged from 2.6 to 4.2% (mean 3.5%) ID (single monkey example in Fig. 2A). At baseline conditions, the radioactivity was highest in the striatum and cerebellum, moderate in the frontal cortex and thalamus and lowest in pons (Fig. 2B, 3).
Figure 2.

Time-activity curves describing radioligand [11C]SD5024. A. % of injected dose in the whole brain, B. regional radioactivity distribution, C. effect of CB1R antagonist on the [11C]SD5024 binding in pons (ID = injected dose; SUV = standardised uptake values). Examples depict single radioligand injections in one monkey.
Figure 3.

Colour-coded PET images showing distribution of radioactivity in the monkey brain after i.v. injection of [11C]SD5024, at baseline and after pretreatment with CB1R antagonists. (Summation images from 5 to 122 min).
During the study, the same monkeys were repeatedly used in the examination of several different compounds (Table 2). As by the study design, baseline measurements were performed at each drug examination (Fig. 1). Consequently, more than one baseline PET measurement was acquired in 5 of 6 monkeys. Though not the aim of this study, baseline data were further used to obtain a preliminary estimate of test-retest reproducibility of [11C]SD5024 binding. Test-retest variability (TRV) was calculated as: TRV (%) = (baseline 2 - baseline 1)/average (baseline 2, baseline 1). The absolute value of TRV was on average 12%.
After administration of AZ candidate and reference compounds (Table 1) there was a dose-dependent reduction in [11C]SD5024 binding in target regions (representative images and time-activity curves in Fig. 3 and Fig. 4A–C, respectively). The binding was markedly inhibited after administration of the highest doses of the study compounds (Table 2). AZ compound 1 was administered in six experiments covering a broad range of doses (0.03 to 6 mg/kg). The relationship between dose, plasma concentration of AZ compound 1 and CB1R occupancy could be described by curvilinear functions providing estimates of ID50 and Ki,pl values (Fig. 5 A–B). For comparative purposes the dose and plasma exposure scale was logged. Visual comparison of compound dose and plasma concentration vs. RO curves resulted in the following arbitrary ranking (lowest-to-highest): taranabant ≪ 1 < 3 ≈ 2 ≈ rimonabant (Fig. 5C–D).
Figure 4.

Time activity curves describing effect of CB1R antagonists. Changes in the whole brain radioactivity after pre-treatment with A–C: AZ compounds, and, D–E: comparators (SUV = standardized uptake values).
Figure 5.

Relationship between dose of AZ compound 1, plasma concentration and CB1R occupancy in the striatum (A, B) and comparison between all compounds tested (C, D). Shaded area in D represents 10–40% receptor occupancy range. Binding to CB1R was calculated using the ratio method (50–122 min) and pons as a reference region. Plasma concentration corresponds to the 90-min time point after radioligand injection.
[11C]SD5024 binding in pons was likewise reduced after administration of the CB1R antagonists (Fig. 2C, Table 3). Although binding in the pons was also potentially specific, the lower CB1R density in this region supported its use as reference for quantitative analysis in the present comparisons.
Table 3.
Changes in [11C]SD5024 binding in pons after administration of CB1R antagonists.
| Compound | Dose (mg/kg) | AUC50–122min difference compared to baseline |
|---|---|---|
|
| ||
| AZ compound 1 | 6.0 | −20% |
| AZ compound 2 | 2.0 | −23% |
| AZ compound 3 | 0.6 | −23% |
| Rimonabant | 0.7 | −9% |
| Taranabant | 0.2 | −29% |
Changes in pons after the highest dose of each compound.
No changes in body temperature, pulse rate, glucose, electrolytes or appearance were observed in the monkeys in relation to the compounds administered.
4. Discussion
This PET study compared CNS CB1R binding by several chemically distinct antagonists (3 candidate AZ compounds and 2 reference drugs) in non-human primate brain. The dose-dependent inhibition of [11C]SD5024 binding observed for all compounds confirms specific binding at CB1R, thereby also extending previous observations with the clinically tested drugs taranabant and rimonabant. The [11C]SD5024 binding appeared to be saturable, in particular for AZ compound 1. Interestingly, the data are also suggestive that already low RO may be sufficient to elicit clinically meaningful pharmacodynamic efficacy, and are discussed in relation to emerging literature on the potential usefulness of ‘neutral’ vs. ‘classical’ CB1R antagonists.
Visual inspection of the curves describing the relation between dose/plasma concentration and receptor occupancy (Fig. 5) indicates that the AZ candidate drugs have lower affinity in vivo at CB1R than the reference drug taranabant (Fig. 5D). This observation partly corresponds to a comparison of functional CB1R antagonist potency in vitro, in which the compounds ranked taranabant > 1 ≈ 2 ≈ 3 > rimonabant (cf. Table 1). However, as the AZ compounds could not be clearly distinguished from the references based on in vivo CB1R occupancy data or other preclinical characteristics (e.g., Table 1; Wennerberg et al., 2011), progressing these agents for clinical use in ‘unselected’ obesity was halted. Although similarly to rimonabant and taranabant, the AZ agents are highly selective for the CB1R vs. >100 other targets, and other profiling and safety assessment (AZ data on file; Table 1) supported their continued development, whether or not agents like these could be advanced as candidates for clinical testing in more serious conditions remains to be explored.
Interestingly, it appears for taranabant that a CB1R occupancy in the range 10 to 40% may be sufficient for appetite- and body weight-reducing efficacy across species (Fong et al., 2007; Burns et al., 2007; Addy et al., 2008a; Proietto et al., 2010; Aronne et al., 2010; Hadcock et al., 2010). Highlighting this feature, the present data confirm and extend it also to compounds with structurally distinct chemistry. Despite species and compound differences it is tempting to compare translationally the plasma concentrations and RO of the compounds in the present study to the reference drugs taranabant and rimonabant. The concentrations of taranabant (~0.01–0.02μmol/L) and rimonabant (~0.3–0.4μmol/L) corresponding to 20–30% CB1R occupancy in the present study agree well with clinically favoured doses of 1–2 mg for taranabant and 20 mg for rimonabant (Burns et al., 2007; Turpault et al., 2006). Similarly, for AZ compound 1, plasma concentrations comparable to those resulting in ~20–30% brain CB1R occupancy were obtained in a 10-day Phase I Multiple Ascending Dose (MAD) study, at doses that tended to reduce body weight (AZ data on file). Although the MAD study design precluded definitive conclusions with respect to efficacy, these doses, thus, would have been interesting to examine further clinically.
It is intriguing that clinically relevant weight loss may be obtained already at partial CB1R occupancy. For comparison, typical antipsychotics require 65–80% dopamine D2 RO for therapeutic efficacy (Farde et al., 1992), and robust sleep-wake pattern effects with histamine H3 and H1 antagonists are seen at 80% RO (Le et al., 2008; Yanai and Tashiro, 2007). The relatively limited degree of occupancy relating to pharmacodynamic efficacy observed in the case of CB1R antagonism might therefore reflect interference with a high intrinsic cannabinoid system ‘tone’ in vivo. In turn, if so, the desired pharmacodynamic action should be possible to achieve at low drug loads and levels of target occupancy (cf. Grimwood et al., 2009).
Reviewing preclinical literature on inverse agonism and neutral antagonism at CB1R, Pertwee (2005) suggested the possibility that rimonabant and its close congener AM251 may be considered neutral antagonists at low concentrations and inverse agonists only when higher concentrations are reached (and potentially involving an allosteric site & mechanism). Further, it has been suggested that the adverse psychiatric effects of rimonabant may derive from inverse agonism at constitutively active CB1R in the ventral tegmental area (VTA) and amygdala, whereas its weight-reducing action reflects endocannabinoid antagonism at hypothalamic CB1R (Meye et al., 2013); thus, that ‘neutral’ antagonism, compared to inverse agonism, would provide a safer therapeutic option for new agents targeting the CB1R (Janero et al., 2011; Meye et al., 2013; Kangas et al., 2013). If these assumptions are correct, the aforementioned observation of clinically significant weight loss at plasma exposures corresponding to low CB1R occupancy by ‘classical’ CB1R antagonists in the present study might suggest that RO in the < 40% range reflect more their antagonist vs. inverse agonist component. Interestingly in this regard, whereas in the clinic the 5 mg rimonabant-dose did also produce significant (albeit modest) weight loss, it did so in the absence of a detectable rise in suicidality seen with the selected 20 mg dose (FDA, 2007). While all of the agents tested in our study display inverse agonist properties in vitro, it remains to be established whether going beyond low CB1R occupancy with a true ‘neutral’ antagonist (i.e., lacking inverse agonism as dose/exposure is increased) would provide greater weight loss efficacy whilst avoiding psychiatric side effects reported for rimonabant and taranabant.
Clinically, previous experience with CB1R antagonists rimonabant and taranabant has underscored the challenge to strike a satisfactory balance between efficacy and safety in general ‘unselected’ obesity populations. In the framework of the aforementioned discussion, it might therefore be speculated that treatment protocols aimed at limiting dose/exposure of ‘classical’ CB1R antagonists to achieve, but not markedly exceed, a 20–30% RO could deliver acceptable benefit/risk margins in more severe conditions. The optimal therapeutic indication for such an approach (e.g., metabolic derangements including morbid obesity and NASH, or in serious addictive disorders) will also have to be identified (cf. Janero et al., 2011; Kangas et al., 2013). Needless to say, final validation of these interesting prospects will have to await clinical testing.
Although the plasma exposure vs. RO relationships do not take into account possible differences in bound/unbound levels or blood-brain barrier penetration, and represent acute as opposed to chronic readouts in an obesity treatment context, this appears less likely to affect the conclusions reached. Thus, similarly to taranabant and rimonabant the AZ drugs studied are all very highly protein bound (>98% quoted for taranabant: Li et al., 2010; >99.9% for rimonabant: FDA, 2007; >98.5–99% for AZ compounds, data on file), and while variations among them may well affect the relative compound rank order, it will not change the relation between plasma exposure and degree of RO. Moreover, based on the reported (Addy et al., 2008b; Turpault et al., 2006) or predicted (AZ data on file) pharmacokinetic profiles of the agents studied, no major alteration is expected in the CB1 RO needed for efficacy in acute vs. chronic treatment settings. Further attesting to this is the report by Burns et al. (2007) demonstrating low and comparable CB1R occupancy with taranabant in rhesus monkeys vs. in man after acute and chronic dosing.
The present study confirms the high brain exposure for the selective CB1R radioligand [11C]SD5024 reported in non-human primates (Donohue et al., 2008b; Tsujikawa et al., 2014). CB1R are present across the brain and the regional binding pattern (striatum > cerebellum > frontal cortex > thalamus > pons) agrees with the reported distribution of CB1Rs in non-human primates and humans (Herkenham et al., 1990; Glass et al., 1997; Horti et al., 2006; Burns et al., 2007; Addy et al., 2008a).
As CB1Rs are expressed across all brain regions and there appears to be no region devoid of CB1Rs, simplified reference region-based analysis of binding to this target is challenging. Similar limitations are known to apply, for example, in the imaging of GABAA receptors, noradrenaline transporter and 5-HT1A receptor, where reference region approaches (e.g., pons, caudate nucleus, white matter) are therefore recurrently used, with the recognised limitations (Eng et al., 2010; Takano et al., 2008; Farde et al., 1998). Pons as reference region was also used for the analysis of rimonabant RO in non-human primates with another CB1R radioligand (Horti et al., 2006). Comparison of CB1R density across species has demonstrated that pons has <5% of the maximum receptor density seen in, e.g., substantia nigra or hippocampus (Herkenham et al., 1990; Glass et al., 1997). Using a reference region containing specific binding sites carries the risk to introduce an underestimation of RO, in particular at low receptor occupancy (cf. Equation 1), and analysis should ideally be done using arterial input function – which is not always feasible in non-human primates. However, the changes in [11C]SD5024 binding in pons by the highest doses of the 5 CB1R antagonists were very small compared to those seen in the striatum (cf. Table 3, Fig. 2C, Fig. 4), suggesting that any such underestimation is minor. The use of pons as a reference region thus appears adequate for the comparison of compounds in the present study.
Although much data in the literature are consistent with the anti-obesity effect of CB1R antagonists being derived from the CNS, there is also data to suggest a peripheral overactivity of endocannabinoids in obesity and a role of peripheral CB1R in relation to weight loss (e.g., Silvestri & Di Marzo, 2013). The impact of these however remains unresolved and has yet to be clinically validated with drugs (for discussion, see, e.g., Pavón et al., 2008; Kunos & Tam, 2011; Fong & Heymsfield, 2009; Pang et al., 2011). This notwithstanding, a potential contribution from CB1R in, e.g., circumventricular organs (CVO) and/or the periphery cannot be a priori discarded. Assuming that free compound concentrations in plasma correspond to free concentrations in tissue, RO should be the same throughout the body. However, neither of these possibilities were addressed in this study, and it thus remains to be established in future studies whether the RO at therapeutic plasma exposures would be markedly different in the CVO or elsewhere from those presently observed in the striatum.
At low doses of all compounds “negative” receptor occupancy values were observed. This observation may be related to the reproducibility of measurements using [11C]SD5024. As suggested by the preliminary analysis, absolute average test-retest value was 12%. Another limitation of the present study was that metabolism of [11C]SD5024 was not examined and arterial blood samples for full kinetic compartment data analysis were not collected (because of the repeated PET measurement study design and blood sampling reserved for analysis of drug plasma concentration). Lack of radioactivity measurements in blood prohibited data correction relative to plasma exposure levels and may therefore also have contributed to the “negative” occupancy values.
A study comparing and detailing the PET radioligand [11C]SD5024 together with other radioligands currently available for imaging of the CB1R in humans was recently reported (Tsujikawa et al., 2014). The authors suggested that [11C]SD5024 may have characteristics particularly favourable for imaging and quantification, e.g., intermediate affinity and more rapid kinetics. Whether these characteristics translate into improved reliability and superiority of [11C]SD5024 for occupancy estimations remains to be examined by future test-retest reproducibility studies in humans. Also, in future studies the use of arterial input function would ideally be required to assure accurate quantitative analysis of receptor occupancy.
5. Conclusions
The present study demonstrates that novel AZ CB1R antagonists from different chemical classes bind in a saturable manner to brain CB1R with in vivo affinity similar to that of rimonabant and taranabant, drugs which produce weight loss and metabolic improvement in clinical trials in obesity. Notably, the findings are also consistent with efficacious pharmacodynamic (anti-obesity) responses being elicited already at low CB1R occupancy. The similar pattern of radioligand inhibition by chemically diverse compounds extends the pharmacological characterization of [11C]SD5024, supporting that it binds specifically to CB1R in non-human primate brain in vivo.
Supplementary Material
Region of interest definition on [11C]SD5024 PET summation images (CER, cerebellum; FC, frontal cortex; STR, striatum; THA, thalamus).
Highlights.
the receptor occupancy of five CB1R antagonists was compared in non-human primates
comparable exposure-CB1R occupancy relations were found across chemical classes
CB1R antagonists may share a low occupancy at clinically effective exposure
the PET radioligand [11C]SD5024 may be useful for examination of occupancy of CB1R
Acknowledgments
The authors wish to thank members of AstraZeneca study team for valuable input to the study: Stina Gustafsson and Britt-Marie Emanuelsson for assistance with the study bioanalysis, Pål Lundin and Maria Leonsson-Zachrisson for coordination and operational assistance, Stefan Paulsson and Agneta Svenheden for drug formulations, Leifeng Cheng, Henrik Zackari, Marie Wennerberg for preparation and background profiling/characterisation of cold CB1R ligands used in the study, and Björn Carlsson for valuable discussion during the study. The authors thank Akihiro Takano, Jan Andersson and Phong Troung for radioligand production, Gudrun Nylén for participation in the animal experiments and all the members of the PET group at the Karolinska Institute for kind assistance during this study.
Abbreviations
- AZ
AstraZeneca
- AUC
area under the curve
- BBB
blood-brain barrier
- CB1R
cannabinoid 1 receptor
- CD
candidate drug
- eCB
endocannabinoid
- CNS
central nervous system
- GPCR
G-protein coupled receptor
- PET
positron emission tomography
- RO
receptor occupancy
- ROI
region of interest
- SUV
standardised uptake value
Footnotes
Laboratory of origin: PET Centre at the Department of Clinical Neuroscience, Karolinska Institute and Karolinska University Hospital, Stockholm, Sweden
Authorship Contributions
Participated in research design: Karlsson, Hjorth, Jucaite, Wählby Hamrén, Johnström, Gulyás, Donohue, Halldin, Farde
Conducted PET measurements: Johnström, Gulyás
Contributed new reagents or analytic tools: Donohue, Halldin, Pike
Performed data analysis: Varnäs, Wählby Hamrén
Wrote or contributed to the writing of the manuscript: Karlsson, Hjorth, Jucaite, Varnäs, Wählby Hamrén, Johnström, Gulyás, Pike, Halldin, Farde
Conflict of Interest/Financial Disclosures
This study was funded by AstraZeneca, R&D, Mölndal, Sweden. AstraZeneca was involved in original concepts, the design, the data analysis and interpretation. Authors CK, SH, AJ, UWH, PJ, LF were AstraZeneca employees during the study design, conduct, data analysis and writing period.
The study was conducted as a research collaboration between AstraZeneca, Sweden and the Department of Clinical Neuroscience, Karolinska Institute, Stockholm, Sweden. KV, BG, CH have no financial involvement, or commercial interest in the AstraZeneca products under study, and received no financial remuneration.
SRD and VWP were supported by the Intramural Research Program of the National Institute of Mental Health (NIMH; project # ZIA MH002793-13) and declare no potential conflict of interest.
Publisher's Disclaimer: This is a PDF file of an unedited manuscript that has been accepted for publication. As a service to our customers we are providing this early version of the manuscript. The manuscript will undergo copyediting, typesetting, and review of the resulting proof before it is published in its final citable form. Please note that during the production process errors may be discovered which could affect the content, and all legal disclaimers that apply to the journal pertain.
Contributor Information
Stephan Hjorth, Biosciences, CVMD Innovative Medicines, AstraZeneca R&D, Mölndal, Sweden.
Cecilia Karlsson, CVMD Translational Medicine Unit, Early Clinical Development, Innovative Medicines, AstraZeneca R&D, Mölndal, Sweden.
Aurelija Jucaite, AstraZeneca Translational Science Centre and Department of Clinical Neuroscience, Karolinska Institute, Stockholm, Sweden.
Katarina Varnäs, Centre for Psychiatric Research, Department of Clinical Neuroscience, Karolinska Institute, Stockholm, Sweden.
Ulrika Wählby Hamrén, Quantitative Clinical Pharmacology, Early Clinical Development, Innovative Medicines, AstraZeneca R&D, Mölndal, Sweden.
Peter Johnström, AstraZeneca Translational Science Centre and Department of Clinical Neuroscience, Karolinska Institute, Stockholm, Sweden.
Balázs Gulyás, Centre for Psychiatric Research, Department of Clinical Neuroscience, Karolinska Institute, Stockholm, Sweden.
Sean R Donohue, Molecular Imaging Branch, National Institute of Mental Health, National Institutes of Health, Bethesda, MD 20892, USA.
Victor W Pike, Molecular Imaging Branch, National Institute of Mental Health, National Institutes of Health, Bethesda, MD 20892, USA.
Christer Halldin, Centre for Psychiatric Research, Department of Clinical Neuroscience, Karolinska Institute, Stockholm, Sweden.
Lars Farde, AstraZeneca Translational Science Centre and Department of Clinical Neuroscience, Karolinska Institute, Stockholm, Sweden.
References
- Addy C, Wright H, Van Laere K, Gantz I, Erondu N, Musser BJ, Lu K, Yuan J, Sanabria-Bohórquez SM, Stoch A, Stevens C, Fong TM, De Lepeleire I, Cilissen C, Cote J, Rosko K, Gendrano IN, 3rd, Nguyen AM, Gumbiner B, Rothenberg P, de Hoon J, Bormans G, Depré M, Eng WS, Ravussin E, Klein S, Blundell J, Herman GA, Burns HD, Hargreaves RJ, Wagner J, Gottesdiener K, Amatruda JM, Heymsfield SB. The acyclic CB1R inverse agonist taranabant mediates weight loss by increasing energy expenditure and decreasing caloric intake. Cell Metab. 2008a;7:68–78. doi: 10.1016/j.cmet.2007.11.012. [DOI] [PubMed] [Google Scholar]
- Addy C, Rothenberg P, Li S, Majumdar A, Agrawal N, Li H, Zhong L, Yuan J, Maes A, Dunbar S, Cote J, Rosko K, Van Dyck K, De Lepeleire I, de Hoon J, Van Hecken A, Depré M, Knops A, Gottesdiener K, Stoch A, Wagner J. Multiple-dose pharmacokinetics, pharmacodynamics, and safety of taranabant, a novel selective cannabinoid-1 receptor inverse agonist, in healthy male volunteers. J Clin Pharmacol. 2008b;48:734–744. doi: 10.1177/0091270008317591. [DOI] [PubMed] [Google Scholar]
- Airaksinen AJ, Nag S, Finnema SJ, Mukherjee J, Chattopadhyay S, Gulyás B, Farde L, Halldin C. [11C]Cyclopropyl-FLB 457: a PET radioligand for low densities of dopamine D2 receptors. Bioorg Med Chem. 2008;16:6467–6473. doi: 10.1016/j.bmc.2008.05.039. [DOI] [PMC free article] [PubMed] [Google Scholar]
- Aronne LJ, Tonstad S, Moreno M, Gantz I, Erondu N, Suryawanshi S, Molony C, Sieberts S, Nayee J, Meehan AG, Shapiro D, Heymsfield SB, Kaufman KD, Amatruda JM. A clinical trial assessing the safety and efficacy of taranabant, a CB1R inverse agonist, in obese and overweight patients: a high-dose study. Int J Obes (Lond) 2010;34:919–935. doi: 10.1038/ijo.2010.21. [DOI] [PubMed] [Google Scholar]
- Aronne LJ, Finer N, Hollander PA, England RD, Klioze SS, Chew RD, Fountaine RJ, Powell CM, Obourn JD. Efficacy and safety of CP-945,598, a selective cannabinoid CB1 receptor antagonist, on weight loss and maintenance. Obesity. 2011;19:1404–1414. doi: 10.1038/oby.2010.352. [DOI] [PubMed] [Google Scholar]
- Beyer CE, Dwyer JM, Piesla MJ, Platt BJ, Shen R, Rahman Z, Chan K, Manners MT, Samad TA, Kennedy JD, Bingham B, Whiteside GT. Depression-like phenotype following chronic CB1 receptor antagonism. Neurobiol Dis. 2010;39:148–155. doi: 10.1016/j.nbd.2010.03.020. [DOI] [PubMed] [Google Scholar]
- Burns HD, Van Laere K, Sanabria-Bohórquez S, Hamill TG, Bormans G, Eng WS, Gibson R, Ryan C, Connolly B, Patel S, Krause S, Vanko A, Van Hecken A, Dupont P, De Lepeleire I, Rothenberg P, Stoch SA, Cote J, Hagmann WK, Jewell JP, Lin LS, Liu P, Goulet MT, Gottesdiener K, Wagner JA, de Hoon J, Mortelmans L, Fong TM, Hargreaves RJ. [18F]MK-9470, a positron emission tomography (PET) tracer for in vivo human PET brain imaging of the cannabinoid-1 receptor. Proc Nat Acad Sci USA. 2007;104:9800–9805. doi: 10.1073/pnas.0703472104. [DOI] [PMC free article] [PubMed] [Google Scholar]
- Chen C-Y, Frey LF, Shultz S, Wallace DJ, Marcantonio K, Payack JF, Vazquez E, Springfield SA, Zhou G, Liu P, Kieczykowski GR, Chen AM, Phenix BD, Singh U, Strine J, Izzo B, Krska SW. Catalytic, enantioselective synthesis of taranabant, a novel, acyclic cannabinoid-1 receptor inverse agonist for the treatment of obesity. Org Process Res Dev. 2007;11:616–623. [Google Scholar]
- Després JP, Golay A, Sjöström L Rimonabant in Obesity-Lipids Study Group. Effects of rimonabant on metabolic risk factors in overweight patients with dyslipidemia. N Engl J Med. 2005;353:2121–2134. doi: 10.1056/NEJMoa044537. [DOI] [PubMed] [Google Scholar]
- Donohue SR, Krushinski JH, Pike VW, Chernet E, Phebus L, Chesterfield AK, Felder CC, Halldin C, Schaus JM. Synthesis, ex vivo evaluation, and radiolabeling of potent 1,5-diphenylpyrrolidin-2-one cannabinoid subtype-1 receptor ligands as candidates for in vivo imaging. J Med Chem. 2008a;51:5833–5842. doi: 10.1021/jm800416m. [DOI] [PMC free article] [PubMed] [Google Scholar]
- Donohue SR, Pike VW, Finnema SJ, Truong P, Andersson J, Gulyás B, Halldin C. Discovery and labeling of high-affinity 3,4-diarylpyrazolines as candidate radioligands for in vivo imaging of cannabinoid subtype-1 (CB1) receptors. J Med Chem. 2008b;51:5608–5616. doi: 10.1021/jm800329z. [DOI] [PMC free article] [PubMed] [Google Scholar]
- Eng W, Atack JR, Bergstrom M, Sanabria S, Appel L, Dawson GR, Sciberras D, Hargreaves RJ, Langstrom B, Burns HD. Occupancy of human brain GABA(A) receptors by the novel α5 subtype-selective benzodiazepine site inverse agonist α5IA as measured using [11C]flumazenil PET imaging. Neuropharmacology. 2010;59:635–639. doi: 10.1016/j.neuropharm.2010.07.024. [DOI] [PubMed] [Google Scholar]
- FDA. [accessed 2015-01-17];Briefing Document NDA 21-888: Zimulti (rimonabant) Tablets, 20 mg Sanofi Aventis Advisory Committee – June 13, 2007. 2007 http://www.fda.gov/ohrms/dockets/ac/07/briefing/2007-4306b1-fda-backgrounder.pdf.
- Farde L, Nordström AL, Wiesel FA, Pauli S, Halldin C, Sedvall G. Positron emission tomographic analysis of central D1 and D2 dopamine receptor occupancy in patients treated with classical neuroleptics and clozapine. Relation to extrapyramidal side effects. Arch Gen Psychiatry. 1992;49:538–544. doi: 10.1001/archpsyc.1992.01820070032005. [DOI] [PubMed] [Google Scholar]
- Farde L, Ito H, Swahn CG, Pike VW, Halldin C. Quantitative analyses of carbonyl-carbon-11-WAY-100635 binding to central 5-hydroxytryptamine-1A receptors in man. J Nucl Med. 1998;39:1965–1971. [PubMed] [Google Scholar]
- Fong TM, Guan XM, Marsh DJ, Shen CP, Stribling DS, Rosko KM, Lao J, Yu H, Feng Y, Xiao JC, Van der Ploeg LH, Goulet MT, Hagmann WK, Lin LS, Lanza TJ, Jr, Jewell JP, Liu P, Shah SK, Qi H, Tong X, Wang J, Xu SS, Francis B, Strack AM, MacIntyre DE, Shearman LP. Antiobesity efficacy of a novel cannabinoid-1 receptor inverse agonist, N-[(1S,2S)-3-(4-chlorophenyl)-2-(3-cyanophenyl)-1-methylpropyl]-2-methyl-2-[[5-(trifluoromethyl)pyridin-2-yl]oxy]propanamide (MK-0364), in rodents. J Pharmacol Exp Therap. 2007;321:1013–1022. doi: 10.1124/jpet.106.118737. [DOI] [PubMed] [Google Scholar]
- Fong TM, Heymsfield SB. Cannabinoid-1 receptor inverse agonists: current understanding of mechanism of action and unanswered questions. Int J Obes (Lond) 2009;33:947–955. doi: 10.1038/ijo.2009.132. [DOI] [PubMed] [Google Scholar]
- Glass M, Dragunow M, Faull RL. Cannabinoid receptors in the human brain: a detailed anatomical and quantitative autoradiographic study in the fetal, neonatal and adult human brain. Neuroscience. 1997;77:299–318. doi: 10.1016/s0306-4522(96)00428-9. [DOI] [PubMed] [Google Scholar]
- Grimwood S, Hartig PR. Target site occupancy: emerging generalizations from clinical and preclinical studies. Pharmacol Ther. 2009;122:281–301. doi: 10.1016/j.pharmthera.2009.03.002. [DOI] [PubMed] [Google Scholar]
- Hadcock JR, Griffith DA, Iredale PA, Carpino PA, Dow RL, Black SC, O’Connor R, Gautreau D, Lizano JS, Ward K, Hargrove DM, Kelly-Sullivan D, Scott DO. In vitro and in vivo pharmacology of CP-945,598, a potent and selective cannabinoid CB(1) receptor antagonist for the management of obesity. Biochem Biophys Res Commun. 2010;394:366–371. doi: 10.1016/j.bbrc.2010.03.015. [DOI] [PubMed] [Google Scholar]
- Herkenham M, Lynn AB, Little MD, Johnson MR, Melvin LS, de Costa BR, Rice KC. Cannabinoid receptor localization in brain. Proc Natl Acad Sci USA. 1990;87:1932–1936. doi: 10.1073/pnas.87.5.1932. [DOI] [PMC free article] [PubMed] [Google Scholar]
- Horti AG, Fan H, Kuwabara H, Hilton J, Ravert HT, Holt DP, Alexander M, Kumar A, Rahmim A, Scheffel U, Wong DF, Dannals RF. 11C-JHU75528: a radiotracer for PET imaging of CB1 cannabinoid receptors. J Nucl Med. 2006;47:1689–1696. [PubMed] [Google Scholar]
- Howlett AC, Reggio PH, Childers SR, Hampson RE, Ulloa NM, Deutsch DG. Endocannabinoid tone versus constitutive activity of cannabinoid receptors. Br J Pharmacol. 2011;163:1329–1343. doi: 10.1111/j.1476-5381.2011.01364.x. [DOI] [PMC free article] [PubMed] [Google Scholar]
- Ito H, Hietala J, Blomqvist G, Halldin C, Farde L. Comparison of the transient equilibrium and continuous infusion method for quantitative PET analysis of [11C]raclopride binding. J Cereb Blood Flow Metab. 1998;18:941–950. doi: 10.1097/00004647-199809000-00003. [DOI] [PubMed] [Google Scholar]
- Janero DR, Lindsley L, Vemuri VK, Makriyannis A. Cannabinoid 1 G protein-coupled receptor (periphero-)neutral antagonists: emerging therapeutics for treating obesity-driven metabolic disease and reducing cardiovascular risk. Expert Opin Drug Discov. 2011;6:995–1025. doi: 10.1517/17460441.2011.608063. [DOI] [PubMed] [Google Scholar]
- Kangas BD, Delatte MS, Vemuri VK, Thakur GA, Nikas SP, Subramanian KV, Shukla VG, Makriyannis A, Bergman J. Cannabinoid discrimination and antagonism by CB1 neutral and inverse agonist antagonists. J Pharmacol Exp Ther. 2013;344:561–567. doi: 10.1124/jpet.112.201962. [DOI] [PMC free article] [PubMed] [Google Scholar]
- Karlsson P, Farde L, Halldin C, Swahn CG, Sedvall G, Foged C, Hansen KT, Skrumsager B. PET examination of [11C]NNC 687 and [11C]NNC 756 as new radioligands for the D1-dopamine receptor. Psychopharmacology (Berl) 1993;113:149–156. doi: 10.1007/BF02245691. [DOI] [PubMed] [Google Scholar]
- Kirkham TC, Williams CM, Fezza F, Di Marzo V. Endocannabinoid levels in rat limbic forebrain and hypothalamus in relation to fasting, feeding and satiation: stimulation of eating by 2-arachidonoyl glycerol. Br J Pharmacol. 2002;136:550–557. doi: 10.1038/sj.bjp.0704767. [DOI] [PMC free article] [PubMed] [Google Scholar]
- Kunos G, Tam J. The case for peripheral CB1 receptor blockade in the treatment of visceral obesity and its cardiometabolic complications. Br J Pharmacol. 2011;163:1423–1431. doi: 10.1111/j.1476-5381.2011.01352.x. [DOI] [PMC free article] [PubMed] [Google Scholar]
- Le S, Gruner JA, Mathiasen JR, Marino MJ, Schaffhauser H. Correlation between ex vivo receptor occupancy and wake-promoting activity of selective H3 receptor antagonists. J Pharmacol Exp Ther. 2008;325:902–909. doi: 10.1124/jpet.107.135343. [DOI] [PubMed] [Google Scholar]
- Li XS, Nielsen J, Cirincione B, Li H, Addy C, Wagner J, Hartford A, Erondu N, Gantz I, Morgan J, Stone J. Development of a population pharmacokinetic model for taranabant, a cannibinoid-1 receptor inverse agonist. AAPS Journal. 2010;12:537–547. doi: 10.1208/s12248-010-9212-2. [DOI] [PMC free article] [PubMed] [Google Scholar]
- Mackie K. Distribution of cannabinoid receptors in the central and peripheral nervous system. Handb Exp Pharmacol. 2005;168:299–325. doi: 10.1007/3-540-26573-2_10. [DOI] [PubMed] [Google Scholar]
- Meye FJ, Trezza V, Vanderschuren LJ, Ramakers GM, Adan RA. Neutral antagonism at the cannabinoid 1 receptor: a safer treatment for obesity. Mol Psychiatry. 2013;18:1294–1301. doi: 10.1038/mp.2012.145. [DOI] [PubMed] [Google Scholar]
- Nogueiras R, Diaz-Arteaga A, Lockie SH, Velásquez DA, Tschop J, López M, Cadwell CC, Diéguez C, Tschöp MH. The endocannabinoid system: role in glucose and energy metabolism. Pharmacol Res. 2009;60:93–98. doi: 10.1016/j.phrs.2009.04.004. [DOI] [PubMed] [Google Scholar]
- Pang Z, Wu NN, Zhao W, Chain DC, Schaffer E, Zhang X, Yamdagni P, Palejwala VA, Fan C, Favara SG, Dressler HM, Economides KD, Weinstock D, Cavallo JS, Naimi S, Galzin AM, Guillot E, Pruniaux MP, Tocci MJ, Polites HG. The central cannabinoid CB1 receptor is required for diet-induced obesity and rimonabant’s antiobesity effects in mice. Obesity (Silver Spring) 2011;19:1923–1934. doi: 10.1038/oby.2011.250. [DOI] [PubMed] [Google Scholar]
- Pavón FJ, Serrano A, Pérez-Valero V, Jagerovic N, Hernández-Folgado L, Bermúdez-Silva FJ, Macías M, Goya P, de Fonseca FR. Central versus peripheral antagonism of cannabinoid CB1 receptor in obesity: effects of LH-21, a peripherally acting neutral cannabinoid receptor antagonist, in Zucker rats. J Neuroendocrinol. 2008;20(Suppl 1):116–123. doi: 10.1111/j.1365-2826.2008.01693.x. [DOI] [PubMed] [Google Scholar]
- Pi-Sunyer FX, Aronne LJ, Heshmati HM, Devin J, Rosenstock J RIO-North America Study Group. Effect of rimonabant, a cannabinoid-1 receptor blocker, on weight and cardiometabolic risk factors in overweight or obese patients: RIO-North America: a randomized controlled trial. JAMA. 2006;295:761–775. doi: 10.1001/jama.295.7.761. [DOI] [PubMed] [Google Scholar]
- Pertwee RG. Inverse agonism and neutral antagonism at cannabinoid CB1 receptors. Life Sciences. 2005;76:1307–1324. doi: 10.1016/j.lfs.2004.10.025. [DOI] [PubMed] [Google Scholar]
- Proietto J, Rissanen A, Harp JB, Erondu N, Yu Q, Suryawanshi S, Jones ME, Johnson-Levonas AO, Heymsfield SB, Kaufman KD, Amatruda JM. A clinical trial assessing the safety and efficacy of the CB1R inverse agonist taranabant in obese and overweight patients: low-dose study. Int J Obes (Lond) 2010;34:1243–1254. doi: 10.1038/ijo.2010.38. [DOI] [PubMed] [Google Scholar]
- Reddy VB, Doss GA, Karanam BV, Samuel K, Lanza TJ, Jr, Lin LS, Yu NX, Zhang AS, Raab CE, Stearns RA, Kumar S. In vitro and in vivo metabolism of a novel cannabinoid-1 receptor inverse agonist, taranabant, in rats and monkeys. Xenobiotica. 2010;40:650–662. doi: 10.3109/00498254.2010.501117. [DOI] [PubMed] [Google Scholar]
- Sanabria-Bohórquez SM, Hamill TG, Goffin K, De Lepeleire I, Bormans G, Burns HD, Van Laere K. Kinetic analysis of the cannabinoid-1 receptor PET tracer [18F]MK-9470 in human brain. Eur J Nucl Med Mol Imaging. 2010;37:920–933. doi: 10.1007/s00259-009-1340-5. [DOI] [PubMed] [Google Scholar]
- Silvestri C, Di Marzo V. The endocannabinoid system in energy homeostasis and the etiopathology of metabolic disorders. Cell Metab. 2013;17:475–490. doi: 10.1016/j.cmet.2013.03.001. [DOI] [PubMed] [Google Scholar]
- Takano A, Varrone A, Gulyás B, Karlsson P, Tauscher J, Halldin C. Mapping of the norepinephrine transporter in the human brain using PET with (S,S)-[18F]FMeNER-D2. Neuroimage. 2008;42:474–482. doi: 10.1016/j.neuroimage.2008.05.040. [DOI] [PubMed] [Google Scholar]
- Terry GE, Liow JS, Zoghbi SS, Hirvonen J, Farris AG, Lerner A, Tauscher JT, Schaus JM, Phebus L, Felder CC, Morse CL, Hong JS, Pike VW, Halldin C, Innis RB. Quantitation of cannabinoid CB1 receptors in healthy human brain using positron emission tomography and an inverse agonist radioligand. Neuroimage. 2009;48:362–370. doi: 10.1016/j.neuroimage.2009.06.059. [DOI] [PMC free article] [PubMed] [Google Scholar]
- Terry GE, Hirvonen J, Liow JS, Zoghbi SS, Gladding R, Tauscher JT, Schaus JM, Phebus L, Felder CC, Morse CL, Donohue SR, Pike VW, Halldin C, Innis RB. Imaging and quantitation of cannabinoid CB1 receptors in human and monkey brain using 18F-labeled inverse agonist radioligands. J Nucl Med. 2010;51:112–120. doi: 10.2967/jnumed.109.067074. [DOI] [PMC free article] [PubMed] [Google Scholar]
- Tsujikawa T, Zoghbi SS, Hong J, Donohue SR, Jenko KJ, Gladding RL, Halldin C, Pike VW, Innis RB, Fujita M. In vitro and in vivo evaluation of 11C-SD5024, a novel PET radioligand for human brain imaging of cannabinoid CB1 receptors. Neuroimage. 2014;84:733–741. doi: 10.1016/j.neuroimage.2013.09.043. [DOI] [PMC free article] [PubMed] [Google Scholar]
- Turpault S, Kanamaluru V, Lockwood GF, Bonnet D, Newton J. Rimonabant pharmacokinetics in healthy and obese subjects. Clin Pharmacol Ther. 2006;79(Suppl 2):P50. [Google Scholar]
- Van Gaal LF, Rissanen AM, Scheen AJ, Ziegler O, Rössner S RIO-Europe Study Group. Effects of the cannabinoid-1 receptor blocker rimonabant on weight reduction and cardiovascular risk factors in overweight patients: 1-year experience from the RIO-Europe study. Lancet. 2005;365:1389–1397. doi: 10.1016/S0140-6736(05)66374-X. [DOI] [PubMed] [Google Scholar]
- Wennerberg M, Cheng L, Hjorth S, Clapham JC, Balendran A, Vauquelin G. Binding properties of antagonists to cannabinoid receptors in intact cells. Fundam Clin Pharmacol. 2011;25:200–210. doi: 10.1111/j.1472-8206.2010.00843.x. [DOI] [PubMed] [Google Scholar]
- Wienhard K, Dahlbom M, Eriksson L, Michel C, Bruckbauer T, Pietrzyk U, Heiss WD. The ECAT EXACT HR: performance of a new high resolution positron scanner. J Comput Assist Tomogr. 1994;18:110–118. [PubMed] [Google Scholar]
- Wierzbicki AS. Rimonabant: endocannabinoid inhibition for the metabolic syndrome. Int J Clin Pract. 2006;60:1697–1706. doi: 10.1111/j.1742-1241.2006.01210.x. [DOI] [PubMed] [Google Scholar]
- Wong DF, Kuwabara H, Horti AG, Raymont V, Brasic J, Guevara M, Ye W, Dannals RF, Ravert HT, Nandi A, Rahmim A, Ming JE, Grachev I, Roy C, Cascella N. Quantification of cerebral cannabinoid receptors subtype 1 (CB1) in healthy subjects and schizophrenia by the novel PET radioligand [11C]OMAR. Neuroimage. 2010;52:1505–1513. doi: 10.1016/j.neuroimage.2010.04.034. [DOI] [PMC free article] [PubMed] [Google Scholar]
- Wu HM, Yang YM, Kim SG. Rimonabant, a cannabinoid receptor type 1 inverse agonist, inhibits hepatocyte lipogenesis by activating liver kinase B1 and AMP-activated protein kinase axis downstream of Gα i/o inhibition. Mol Pharmacol. 2011;80:859–869. doi: 10.1124/mol.111.072769. [DOI] [PubMed] [Google Scholar]
- Yanai K, Tashiro M. The physiological and pathophysiological roles of neuronal histamine: an insight from human positron emission tomography studies. Pharmacol Ther. 2007;113:1–15. doi: 10.1016/j.pharmthera.2006.06.008. [DOI] [PubMed] [Google Scholar]
Associated Data
This section collects any data citations, data availability statements, or supplementary materials included in this article.
Supplementary Materials
Region of interest definition on [11C]SD5024 PET summation images (CER, cerebellum; FC, frontal cortex; STR, striatum; THA, thalamus).