

Abstract
Study Objectives:
To group participants according to markers of risk for severe mental illness based on subsyndromal symptoms reported in early adulthood and evaluate attributes of sleep across these risk categories.
Methods:
An online survey of sleep and psychiatric symptomatology (The Oxford Sleep Survey) was administered to students at one United Kingdom university. 1403 students (undergraduate and postgraduate) completed the survey. The median age was 21 (interquartile range = 20–23) and 55.60% were female. The cross-sectional data were used to cluster participants based on dimensional measures of psychiatric symptoms (hallucinations, paranoia, depression, anxiety, and (hypo)mania). High, medium, and low symptom groups were compared across sleep parameters: insomnia symptoms, nightmares, chronotype, and social jet lag.
Results:
Insomnia symptoms, nightmares frequency, and nightmare-related distress increased in a dose-response manner with higher reported subsyndromal psychiatric symptoms (low, medium, and high). The high-risk group exhibited a later chronotype (mid sleep point for free days) than the medium- or low-risk group. The majority of participants (71.7%) in the high-risk group screened positive for insomnia and the median nightmare frequency was two per 14 days (moderately severe pathology).
Conclusions:
Insomnia, nightmares, and circadian phase delay are associated with increased subsyndromal psychiatric symptoms in young people. Each is a treatable sleep disorder and might be a target for early intervention to modify the subsequent progression of psychiatric disorder.
Citation:
Sheaves B, Porcheret K, Tsanas A, Espie CA, Foster RG, Freeman D, Harrison PJ, Wulff K, Goodwin GM. Insomnia, nightmares, and chronotype as markers of risk for severe mental illness: results from a student population. SLEEP 2016;39(1):173–181.
Keywords: chronotype, cluster analysis, insomnia, nightmares, severe mental illness, sleep, social jet lag
Significance.
Young adulthood corresponds to a developmental stage where the symptoms of severe mental illness (SMI; e.g. paranoid thoughts, hallucinatory experiences and hypomanic mood) begin to emerge and are readily identified. Whilst sleep disruption has been associated with the later development of SMI, a detailed examination of specific sleep disorder symptoms and their association with risk for SMI has not been carried out. This study characterised sleep across three risk categories for SMI. Insomnia and nightmare severity increased in a dose response manner with increased risk for SMI. The impact of treating these sleep disorder symptoms on the subsequent development of SMI is a clear next step for research.
INTRODUCTION
Sleep disturbance is common: 8% to 18% of the population report feeling dissatisfied with the quality or quantity of their sleep, whereas 6% to 10% suffer with insomnia disorder.1,2 Sleep and circadian rhythm disorders are also very common in those with established severe mental illness (SMI), including psychosis3,4 and bipolar disorder.5 Disturbed sleep is not simply a result of distressing daytime symptoms. Instead, sleep disruption commonly presents prior to acute psychiatric difficulties. For example, it elevates risk for a manic episode,6 first episode of psychosis,7 paranoia,8 or transition to major depression.9 Thus, sleep disturbance may be an important mediator of severity, onset, or relapse of a range of psychiatric disorders.
If correct, the prediction is that interventions to improve sleep quality per se should have an effect on all the associated disorders. Preliminary studies suggest this may be true for psychotic,10 depressive,11–14 anxiety,12 and manic symptoms.15 If this transdiagnostic approach works for fully developed psychiatric disorders, then it might be equally important for pre-morbid risk or prodromal states. Indeed, sleep interventions could be the kind of simple, acceptable approaches most appropriate in young people with poorly differentiated subsyndromal states, predictive of future problems. Accordingly, better understanding of the kind of sleep disruption prevalent at the point at which psychiatric symptoms have begun to emerge will be important to inform clinical interventions targeting sleep.
“Sleep disturbance” is an umbrella term that captures many sleep disorders,16 each of which requires different treatment refinements. There is growing evidence that people in whom a SMI has been diagnosed exhibit increased rates of insomnia,3 circadian disruption,4 and more frequent and distressing nightmares.17 Although there is evidence of altered sleep timings at the early stages of mental illness,18 to our knowledge, there is no study that has investigated each of these sleep disorders at the point when symptoms of SMI begin to emerge.
Young adulthood corresponds to a developmental stage where the symptoms of SMI (e.g., paranoid thoughts, hallucinatory experiences) can be identified reliably. This age also corresponds to an elevated risk for first incidence of severe mental illnesses such as schizophrenia19 and bipolar disorder.19,20 However, at this age most individuals will have the known negative consequences of psychiatric disorder ahead of them and will often display subsyndromal (attenuated) symptoms rather than a diagnosable severe mental illness.22 It is this group that is the focus of the current investigation.
The aims of the study were to group participants based on symptom counts as a marker of risk for SMI, and to evaluate attributes of sleep across these risk categories. We took a trans-diagnostic approach to risk: we used cluster analysis to group participants based on dimensional measures of hallucinatory experiences, paranoia, mania, depression, and anxiety. These measures capture the spectra of symptom severity: many people will endorse low levels of any symptom, whereas few people will endorse high levels.
The hypothesis we investigate is whether those with higher levels of psychiatric symptoms (and by definition at higher risk of further problems) exhibit an elevated rate of insomnia disorder and more frequent and distressing nightmares when compared to those with medium or low levels of symptoms. Exploratory analyses investigated whether chronotype (genetic predisposition of endogenous circadian phase) and social jet lag (SJL, misalignment of endogenous circadian phase with social time) differed across groups. We had no directional hypotheses for these latter analyses.
METHOD
Setting and Design
The Oxford Sleep Survey was a cross-sectional online survey. The survey included 122 questions designed to assess habitual sleep timing and quality and dimensional experiences of psychiatric symptoms. The study was reviewed and approved by the University of Oxford Research Ethics Committee (MSD/ IDREC/C1/2012/65).
The survey was advertised to University of Oxford students via an Email advertisement sent directly from their university college. In the majority of cases this Email was distributed individually to students' Email accounts and in a minority of cases it was included as part of a broader information bulletin.
Twenty-two of the 44 University of Oxford colleges were contacted to advertise the study (total student population: 12,220). There were no inclusion or exclusion criteria. All participants provided online informed consent. This resulted in 2,055 participants clicking on a hyperlink to the survey and 1,686 participants with at least one complete survey section (response rate: 13.80% of total student population). Data were checked for duplicate responses based on matching Email addresses or IP addresses. No duplicates were found. Data cleaning resulted in 100 participants being omitted from the analyses (8 due to implausible ages, 90 implausible sleep times, and 2 inconsistent responses to physical health questions). Only those with complete data for the mental health variables (paranoia, hallucinations, mania, depression, and anxiety) were entered into the cluster analysis (n = 1,403).
Measures
Psychotic-Like Experiences
Paranoia and hallucinations were measured using subscales from the Specific Psychotic Experiences Questionnaire (SPEQ).23 All SPEQ subscales show good to excellent internal consistency (Cronbach alpha 0.77–0.93).23 The scales list 15 paranoid thoughts and nine hallucinatory experiences. Statements are rated on a six-point frequency scale from not at all (0) through to daily (5). None of the items measure sleep disturbance. The subscales have been validated as a measure of psychotic experiences in a general population sample of adolescents.23
Mania
The Mood Disorder Questionnaire is a validated screening instrument for bipolar disorder.24 The questionnaire lists 13 symptoms of mania. One of the 13 items marks sleep disturbance: “You got much less sleep than usual and found you didn't really miss it.” This item relates to reduce need for sleep, rather than insomnia, nightmares, chronotype, or SJL, specifically and hence was retained. The current study utilised the dimensional symptom count score (range 0–13) which has good internal consistency (Cronbach alpha = 0.84).24
Depression and Anxiety
Depression and anxiety were measured using two subscales from the Depression, Anxiety, and Stress Scales (DASS-21).25 Fourteen items yield the two subscale scores, which range from 0 to 42. None of the items measure sleep disturbance. The scales have good psychometric properties for measuring depression and anxiety in a nonclinical population.26 The scales have good internal consistency (0.82–0.88).26
Insomnia
The Sleep Condition Indicator (SCI)27 is an eight-item screening measure for Diagnostic and Statistical Manual of Mental Disorders, Fifth Edition (DSM-5)28 Insomnia Disorder. Scores range from 0–32 with higher scores indicating better sleep. A clinical cut off of ≤ 16 has been shown to correctly identify 89% of those with probable insomnia disorder. The measure has good internal consistency (Cronbach alpha = 0.86).27
Nightmares
A retrospective Dream Log was adapted from Levin and Fireman.29 Participants were asked to indicate how many nightmares they estimated experiencing over the past 2 w prior to completing the survey (14 nights). If the participant had experienced at least one nightmare, they were asked to pick their worst nightmare and rate it on a seven-point Likert scale for distress. Retrospective nightmare logs measuring up to 1 mo in the past are known to yield similar results to prospective measures in a sample of undergraduate students.30
Chronotype
Chronotype was derived from the Munich Chronotype Questionnaire (MCTQ),31 which consists of six questions concerning self-reported, habitual sleep timings. The primary outcome of the MCTQ is the Mid-Sleep point on Free days (MSF). This parameter is calculated as the midpoint between sleep start and sleep end. The MSF is corrected for oversleep on free days (MSFsc): oversleep occurs as a result of sleep debt due to sleep deprivation on work days.32 The equation for calculating MSFsc is:
where SDf is the Sleep Duration on free days, SDw is the Sleep Duration on work days, and nWD is the number of Work Days. Work days were defined as “days with commitments, e.g. work, lecture or sport practice” and students were informed that “work days include any days where you have a schedule that causes you to get up or go to bed at a certain time and can include the weekend.” The MSF is strongly correlated to Horne-Östberg Morningness-Eveningness Questionnaire score33 (r = −0.73),34 demonstrating convergent validity.
Social Jet Lag
SJL is defined as the discrepancy between the endogenous circadian phase for sleep and the actual sleep period that is influenced by social and work commitments.35 SJL is calculated as the difference between the endogenously driven sleep period and that imposed by external commitments, i.e., the free day sleep period and that of work days. The midsleep points on work and free days from the MCTQ were used as correlates of chronotype. The equation for calculating SJL is:
where MSW is Mid Sleep point on Work days.
Analyses
Statistical Analysis
IBM SPSS statistics for windows 1936 was used. All mental health symptom counts and nightmare frequency variables were positively skewed and the SCI (insomnia measure) score was negatively skewed. Medians and interquartile range (IQR) and nonparametric statistics are therefore reported throughout. We used the Spearman correlation coefficient to quantify the extent of statistical association strength between variables. There is no formal statistical definition of what constitutes a statistically strong relationship, because this depends on the application. Here, we used the empirical guideline that in medical applications we consider relationships to be statistically strong if the magnitude of the correlation coefficient is larger than 0.3.37,38 Given the exploratory nature of the study, a conservative alpha level of < 0.01 was used.
Cluster Analysis
Each of the five mental health characteristics was normalized (linearly scaled to have a minimum value of 0 and a maximum value of 1) to ensure that there is no single symptom dominated the clustering. This is a standard approach in general distance-based algorithmic approaches in machine learning.39
We used two approaches to cluster the data: the standard k-means clustering, and hierarchical clustering. Henceforth, we focus on the hierarchical clustering results, and defer direct comparison of the results of the two clustering methods for the supplemental material. Hierarchical clustering is a robust method for grouping data based on the similarity of their characteristics (in this study, the five measures discussed in the preceding section). Unlike k-means, hierarchical clustering does not require prespecifying the number of clusters in the data, and does not require an initial arbitrary starting configuration assignment.39
Hierarchical clustering can be thought of as a tree where at each level the data is recursively split into new clusters, so that the between group dissimilarity is maximized (the concept of dissimilarity refers to the metric used to assess whether samples have similar properties). Ultimately, this process results in a concise graphical representation of all data samples called a dendrogram. Part of the popularity of hierarchical methods has been attributed to this property, where it is possible to visualize how samples group together at each level. The number of clusters was decided by determining a cutoff horizontally to partition the data. In this study, the similarity of the samples was determined using Ward linkage with euclidean distance, as has been similarly used in another recent study.40 The number of clusters was selected by visual inspection of the computed dendrogram.
Visualization
The clustering analysis will assign each of the 1,403 participants into one of the possible groups (clusters). However, it is difficult to intuitively understand how the five mental health characteristics contribute toward the clustering results. One way to visualize the clustering findings is to project these five characteristics down to a lower dimensional space (transformed characteristics) that can be graphically represented in a two-dimensional plot. There are a number of different methods available to project data, but essentially all different algorithms attempt to preserve the high-dimensional similarities of the samples in a more compact setting. Here, we used a dimensionality reduction method called t-distributed stochastic neighbour embedding (t-SNE)41 to project the five characteristics into a two-dimensional space. t-SNE is a state-of-the art dimensionality reduction algorithm, which is particularly popular for visualizing high dimensional (in this case five dimensional) data.
RESULTS
The total sample comprised 780 females (55.6%), 612 males (43.6%, 11 declined to answer, 0.8%). The median age was 21 (IQR = 20–23). Of the total sample, 104 (7.4%) were in receipt of mental health treatment, and 1,299 (92.6%) were not. With regard to diagnosis, 233 (16.6%) self-reported a psychiatric diagnosis, and 1,170 (83.4%) reported no psychiatric diagnosis.
Cluster Solutions
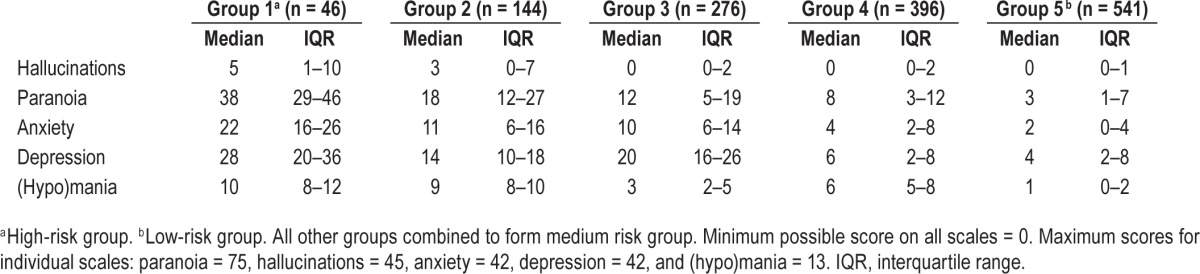
Following visual inspection of the dendrogram, we decided to use five clusters. Hierarchical clustering revealed a group with elevated scores on all five mental health variables (“high risk”), a group with low scores on all five mental health variables (“low risk”), and three groups with symptom count scores falling in between these high and low risk groups, but with mixed profiles (see Table 1). Group two was particularly characterized by elevated (hypo)manic symptoms in addition to other symptoms of depression, anxiety, hallucinations, and paranoia. Group three was particularly characterized by elevated depression scores, in addition to symptoms of paranoia, anxiety, depression, and (hypo)mania. Group four exhibited mild elevation (compared to the low risk group) on all symptoms excluding hallucinations.
Table 1.
Symptom count scores according to hierarchical cluster analysis with ward linkage (median and interquartile range).
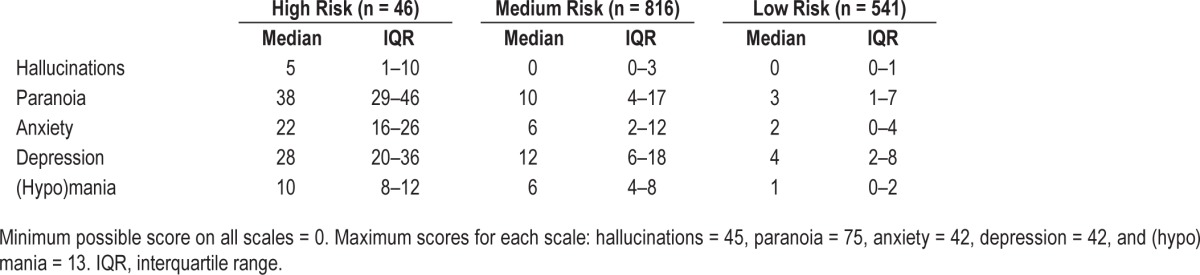
Given the mixed profiles of the middle groups and lack of clear clinical differentiation, we combined these clusters into an overall “medium risk” group. The median and IQR for symptoms within each of these three clusters is in Table 2. K-means clustering provided a similarly distinct high- and low-risk groups and three medium-risk groups. This analysis is included in the supplemental material.
Table 2.
Mental health symptoms as a function of hierarchical cluster analysis risk category (total n = 1,403).
Of the three groups, 46 participants (3.3%) fell into the high-risk group, 816 (58.2%) fell into the medium-risk group, and 541 (38.6%) fell into the low-risk group. The median age was 20 (IQR = 19–22) for the high-risk group, and 21 for both the medium-risk group (IQR = 20–23) and low-risk group (IQR = 20–24). The percentage of males in the high-risk group was 51.1%, the medium-risk group was 45.0%, and the low-risk group was 41.8%.
In order to obtain a visual illustration of the findings of the cluster analysis, we used the t-SNE algorithm to obtain a two-dimensional representation of the five symptom counts, and assigned a different color to each of the three groups. The results appear in Figure 1, and are intuitively appealing: it seems that the participants are very well separated overall. For example, there is no overlap between the high- and low-risk groups on the Y axis. For most nonlinear dimensionality reduction techniques (such as t-SNE), it is not straightforward to describe what the projected dimensions represent, because they are nonlinear combinations of the original characteristics. Here, we attempt to have some tentative insight into this link by associating the original characteristics to the projected dimensions obtained with t-SNE. Specifically, we have computed the Spearman correlation coefficients between each of the five original characteristics and each of the two projected dimensions in order to quantify these relationships. The first projected dimension (t-SNE variable1) is statistically very strongly correlated with (hypo)mania (R = −0.79), and moderately with depression (R = −0.19), hallucinations (R = 0.13), and paranoia (R = 0.11) but not with anxiety (R = 0.05). The second projected dimension (t-SNE variable2) is statistically strongly correlated with all the original characteristics: hallucinations (R = −0.35), paranoia (R = −0.57), anxiety (R = −0.56), depression (−0.70) and (hypo)mania (R = −0.79).
Figure 1.

Two-dimensional projection of the five symptom dimensions (paranoia, hallucinations, (hypo) mania, depression, and anxiety) to visualize the results of the risk-based groupings. t-SNE, a dimensionality reduction method.
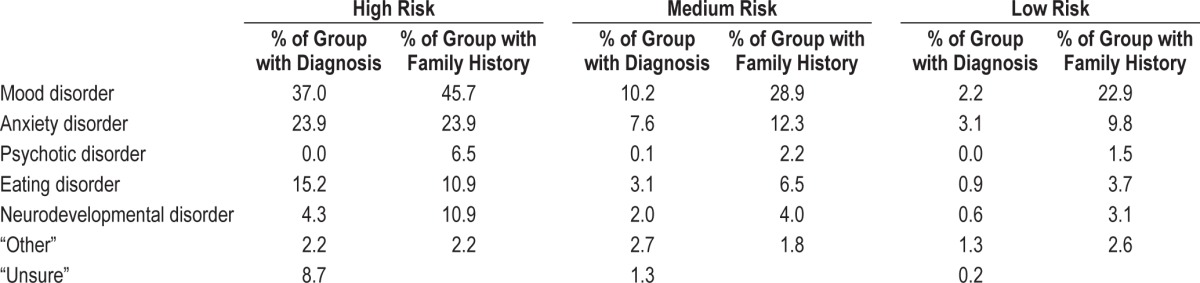
The face validity of the risk groups is confirmed by self-reported mental health, receipt of treatment, self-reported diagnoses, and family history of psychiatric difficulties (see Table 3). Across high-, medium-, and low-risk groups, “very poor” mental health was rated by 10.9%, 0.9%, and 0.4% respectively; “poor” was rated 50.0%, 13.7%, and 2.0%, respectively; “average” by 37.0%, 35.9%, and 15.7% respectively; “good” by 2.2%, 31.9%, and 44.4%, respectively; and “very good” by 0.0%, 17.6%, and 37.5% respectively. Across groups, 92.4% of the low-risk group, 79.4% of the medium-risk group and 47.8% of the high-risk group reported having no mental health diagnosis. There was one participant reporting a psychotic illness (in the medium-risk group). With regard to receipt of treatment, 23.9% of the high-risk group, 9.8% of the medium-risk group, and 2.4% of the low-risk group reported receiving treatment for mental health difficulties.
Table 3.
Mental health diagnoses and family history within each risk group (high, medium, and low).
Sleep Profiles across Risk Group
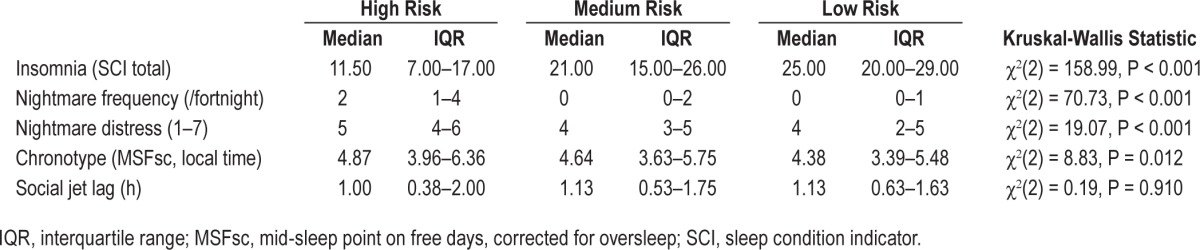
Risk groups were compared on sleep variables using the Kruskal-Wallis test statistic (Table 4). Insomnia, nightmare frequency, nightmare distress, and MSFsc showed significant group differences whereas SJL did not. Mann-Whitney U tests were used to assess pairwise comparisons between risk groups. The high-risk group exhibited more insomnia symptoms (z = −6.69, P < 0.001), nightmare frequency (z = −5.26, P < 0.001) and higher nightmare related distress (z = −4.14, P < 0.001) than the medium-risk group. The high-risk group had a descriptively later MSFsc than the medium-risk group, but this was not statistically significant (z = −0.97, P = 0.33). The medium-risk group reported higher levels of insomnia (z = −10.16, P < 0.001), nightmare frequency (z = −5.79, P < 0.001) and had a later MSFsc (z = −2.67, P = 0.008) than the low-risk group. Nightmare-related distress was not significantly different across medium- and low-risk groups (z = −0.86, P = 0.39).
Table 4.
Sleep profiles by risk group.
The SCI has a validated clinical cutoff for probable Insomnia Disorder (total score ≤ 16; lower total score indicates poorer sleep).27 In the high-risk group, 71.7% scored below the clinical cut- off for probable Insomnia Disorder, in the medium-risk group 27.6% fell below the cutoff and 12.2% of the low risk group fell below the cutoff. Exploratory analysis revealed that the scores for each of the eight items on the SCI (i.e., each of the diagnostic criteria for DSM-5 Insomnia Disorder) were statistically significantly different across risk groups, χ2(2) = 24.35 to 165.10, all P < 0.001. The percentage of participants in each group achieving a DSM-5 score for each individual symptom is shown in Figure 2.
Figure 2.

Percentage of participants meeting Diagnostic and Statistical Manual of Mental Disorders, Fifth Edition (DSM-5) criteria for each Sleep Condition Indicator (SCI) measured insomnia symptom, as a function of risk grouping (high, medium, or low).
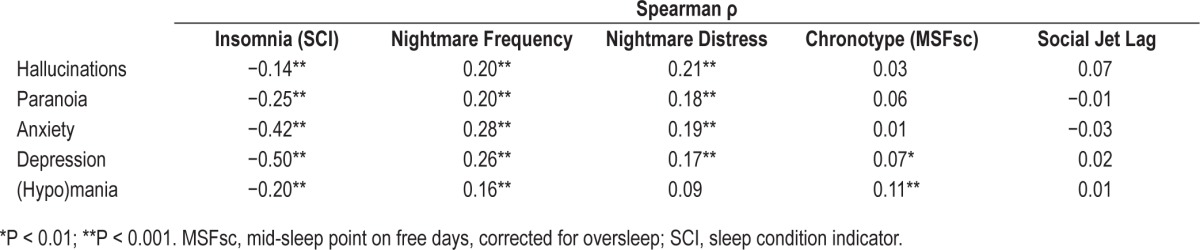
The individual associations between the five subsyndromal symptoms and the five sleep characteristics are shown in Table 5.
Table 5.
Spearman correlation coefficients between the subsyndromal psychiatric symptoms and sleep characteristics (n = 1,403).
DISCUSSION
Hierarchical clustering created a clinically useful grouping of the student cohort on the basis of five dimensional symptoms (paranoia, hallucinations, depression, anxiety, and mania). In the high-risk group all symptoms were elevated, suggestive of an elevated risk for the development of a SMI. In the low-risk group all risks were low, and the medium group fell directly between these two extreme groups. Face validity was confirmed by the participants' own global ratings of current mental health in the three clusters. Insomnia, nightmare frequency, and nightmare distress increase in a dose response fashion across the low-, medium-, and high-risk groups. There was evidence of a circadian phase delay in the high- and medium-risk groups, compared to the low-risk group, as assessed by mid sleep point on free days. Analysis of single insomnia symptoms (e.g., time to fall asleep, wake after sleep onset) suggest that all symptoms measured by the SCI contribute to higher levels of insomnia in the high-risk group (Figure 2). There is not a dominant insomnia symptom. SJL (the degree of misalignment between endogenous circadian phase and habitual sleep time) was not statistically different across groups.
The high-risk group was characterized by elevated levels of paranoid thoughts, hallucinatory experiences, manic symptoms and affective symptoms. The majority (60.9%) of the high-risk group rated their mental health as poor or very poor. There was an elevated family history of psychotic illness, and much higher rates of current depression or anxiety diagnoses compared to the medium- and low-risk groups. None of the groups self-reported a diagnosed psychotic illness, and the constellation of symptoms and risk factors was not very specific for schizophrenia on the one hand or bipolar disorder on the other. This lack of diagnostic specificity confirms what has been described in young clinic samples.22 However, such groups are likely to be at high risk for a SMI. They represent a group in which proof-of-concept studies for treatments to prevent the onset and progression of mental illness could be informative. The medium-risk group confirms the existence of a gradient between high- and low-risk participants.
The majority (71.7%) of the high-risk group screened positive for probable insomnia disorder. This was higher than the 12.2% in the low-risk group and markedly higher than the prevalence of insomnia in the general population (6% to 10%).1 In addition to high rates of insomnia, those in the high-risk group had a median nightmare frequency of one per week, reflective of moderately severe pathology28; furthermore, these nightmares were more distressing than those experienced by the medium- or low-risk groups. Analysis of the relationship between individual subsyndromal psychiatric symptoms and the sleep characteristics revealed statistically strong associations between insomnia and both depression and anxiety. However, weak relationships were also found for each of the five subsyndromal psychiatric symptoms with insomnia and nightmares (see Table 5). Weak associations were found between chronotype and both depression and (hypo)mania. It is likely that although each of these relationships is weak, there is a cumulative effect, such that those at high risk for SMI, presenting with multiple subsyndromal symptoms, have poorer sleep compared to those individuals with just one subsyndromal symptom.
Both Insomnia Disorder and Nightmare Disorder are DSM-5 diagnosable and treatable conditions, which commonly co-occur.42 Cognitive behavioral therapy (CBT) is the recommended first-line treatment for persistent insomnia and produces moderate to large improvements in sleep onset latency and sleep quality.43–45 Meta-analyses report that imagery rehearsal training (IRT) results in large reductions in nightmare frequency relative to control46,47 and are recommended, alongside pharmacological options (prazosin).48,49 Although chronotype was found to be later for the high- and medium-risk groups compared to the low-risk group, it should be noted that the median differences in sleep timings between the groups are relatively small (16 min between the low- and medium-risk groups and 29 min between the low- and high- risk groups). Nevertheless, chronotype and sleep preferences might be an important consideration in implementing these treatments. Although this high-risk group presents with less clearly defined subsyndromal symptoms, they clearly present with sleep disorders in need of treatment. The effect of sleep treatments on secondary psychiatric symptoms and the development of severe mental illness in young people is an important area of research that is already underway We are conducting a large randomized controlled trial (n > 2,000) of CBT for insomnia to investigate the effect on psychiatric symptoms, at an age when these begin to emerge (university students).50
Although the findings are compelling, there are limitations to the current study. The sample was homogenous, because all participants were University of Oxford students, which might limit generalizability of the results; moreover, the overall response rate is modest and students with sleep problems may have been more likely to complete the survey. Against this, the rates and distribution of hypomanic symptoms and distribution of depression scores were comparable to a previous survey of the student population without a sleep emphasis.51 Although self-report questionnaires facilitate the collection of a large sample size, they limit the depth of assessments. Retrospective accounts of sleep times lose some reliability compared to prospective sleep diaries, and future studies should aim to include these as well as objective measures of sleep such as actigraphy. Furthermore, this study is limited in its assessment of the variable nature of sleep patterns. Steps were taken to minimize the possible contributors to sleep variability: all students were assessed on work and free days during term time; the definition of work days was clarified for a student population, i.e., highlighting that work days can be at the weekend; and the survey was completed in the second academic term when there are fewer examinations. In terms of mental health status, a future study would benefit from a comprehensive interview to assess risk of psychiatric difficulties (e.g., the Comprehensive Assessment of At-Risk Mental States interview52). Alternatively, following the current groups longitudinally could add validity to their group status (high-, medium-, or low risk for SMI). Last, some of the high-risk sample self-reported a psychiatric diagnosis, but were unsure what it was (8.7%). A more thorough diagnostic interview or report from the participant's diagnosing care team would be important in future studies to validate the sample as high risk (rather than those already with a diagnosis).
In conclusion, increased rates of insomnia, nightmares, and to a lesser extent circadian phase delay are associated with psychiatric symptoms and poor mental health in a young population. Each of these sleep disturbances is treatable. The clinical challenge is to demonstrate that treatment has an effect on the development and course of severe psychiatric symptomatology in young people.
DISCLOSURE STATEMENT
This study is supported by a Wellcome Trust Strategic Award (098461/Z/12/Z) to the Oxford Sleep and Circadian Neuroscience Institute (SCNi). Dr. Goodwin holds shares in P1vital and has served in the past two years as consultant, advisor, or CME speaker for AstraZeneca, Abbvie, Cephalon/Teva, Convergence, Eli Lilly, GSK, Lundbeck, Medscape, Merck, Otsuka, P1Vital, Servier, Sunovion, and Takeda. Dr. Sheaves provides clinical support to Sleepio / Big Health Ltd. Dr. Espie holds shares in Sleepio/ Big Health Ltd and has served in the past two years as consultant, advisor, or speaker for Boots Pharmaceuticals, UCB pharma, and Novartis. Dr. Harrison receives royalties from Oxford University Press and Wiley Blackwell Publishers; has consulted for Boehringer Ingelheim; has been compensated for expert witness work for Sandoz Pharma, Teva (Israel) and Pinsent Mason, LLP; and has received honorarium as a Deputy Editor for the Society for Biological Psychiatry. The other authors have indicated no financial conflicts of interest. This work was completed at the University of Oxford.
REFERENCES
- 1.Ohayon M. Epidemiology of insomnia: what we know and what we still need to learn. Sleep Med Rev. 2002;6:97–111. doi: 10.1053/smrv.2002.0186. [DOI] [PubMed] [Google Scholar]
- 2.Walsh JK. Clinical and socioeconomic correlates of insomnia. J Clin Psychiatry. 2004;65:13–9. [PubMed] [Google Scholar]
- 3.Freeman D, Pugh K, Vorontsova N, Southgate L. Insomnia and paranoia. Schizophr Res. 2009;108:280–4. doi: 10.1016/j.schres.2008.12.001. [DOI] [PMC free article] [PubMed] [Google Scholar]
- 4.Wulff K, Dijk D-J, Middleton B, Foster RG, Joyce EM. Sleep and circadian rhythm disruption in schizophrenia. Br J Psychiatry. 2012;200:308–16. doi: 10.1192/bjp.bp.111.096321. [DOI] [PMC free article] [PubMed] [Google Scholar]
- 5.Harvey AG, Schmidt A, Scarnà A, Neitzert Semler C, Goodwin GM. Sleep-related functioning in euthymic patients with bipolar disorder, patients with insomnia, and subjects without sleep problems. Am J Psychiatry. 2005;162:50–7. doi: 10.1176/appi.ajp.162.1.50. [DOI] [PubMed] [Google Scholar]
- 6.Kaplan K, McGlinchey EL, Soehner A, et al. Hypersomnia subtypes, sleep and relapse in bipolar disorder. Psychol Med. 2014;17:1–13. doi: 10.1017/S0033291714002918. [DOI] [PMC free article] [PubMed] [Google Scholar]
- 7.Ruhrmann S, Schultz-Lutter F, Salokangas R, et al. Prediction of psychosis in adolescents and young adults at high risk. Arch Gen Psychiatry. 2010;67:241–51. doi: 10.1001/archgenpsychiatry.2009.206. [DOI] [PubMed] [Google Scholar]
- 8.Freeman D, Stahl D, McManus S, et al. Insomnia, worry, anxiety and depression as predictors of the occurrence and persistence of paranoid thinking. Soc Psychiatry Psychiatr Epidemiol. 2012;47:1195–203. doi: 10.1007/s00127-011-0433-1. [DOI] [PubMed] [Google Scholar]
- 9.Buysse DJ, Angst J, Gamma A, Ajdacic V, Eich D, Rössler W. Prevalence, Course, and Comorbidity of Insomnia and Depression in Young Adults. Sleep. 2008;31:473–80. doi: 10.1093/sleep/31.4.473. [DOI] [PMC free article] [PubMed] [Google Scholar]
- 10.Myers E, Startup H, Freeman D. Cognitive behavioural treatment of insomnia in individuals with persistent persecutory delusions: a pilot trial. J Behav Ther Exp Psychiatry. 2011;42:330–6. doi: 10.1016/j.jbtep.2011.02.004. [DOI] [PMC free article] [PubMed] [Google Scholar]
- 11.Manber R, Edinger JD, Gress JL, San Pedro-Salcedo MG, Kuo TF, Kalista T. Cognitive behavioral therapy for insomnia enhances depression outcome in patients with comorbid major depressive disorder and insomnia. Sleep. 2008;31:489–95. doi: 10.1093/sleep/31.4.489. [DOI] [PMC free article] [PubMed] [Google Scholar]
- 12.Espie CA, Kyle SD, Miller CB, Ong J, Hames P, Fleming L. Attribution, cognition and psychopathology in persistent insomnia disorder: outcome and mediation analysis from a randomized placebo-controlled trial of online cognitive behavioural therapy. Sleep Med. 2014;15:913–7. doi: 10.1016/j.sleep.2014.03.001. [DOI] [PubMed] [Google Scholar]
- 13.Ashworth D, Sletten T, Junge M, et al. A randomized controlled trial of cognitive behavioural therapy for insomnia: an effective treatment for comorbid insomnia and depression. J Couns Psychol. 2015;62:115–23. doi: 10.1037/cou0000059. [DOI] [PubMed] [Google Scholar]
- 14.Clarke G, McGlinchey EL, Hein K, et al. Cognitive-behavioral treatment of insomnia and depression in adolescents: a pilot randomized trial. Behav Res Ther. 2015;69:111–8. doi: 10.1016/j.brat.2015.04.009. [DOI] [PMC free article] [PubMed] [Google Scholar]
- 15.Barbini B, Benedetti F, Colombo C, et al. Dark therapy for mania: a pilot study. Bipolar Disord. 2005;7:98–101. doi: 10.1111/j.1399-5618.2004.00166.x. [DOI] [PubMed] [Google Scholar]
- 16.Harvey AG, Murray G, Chandler RA, Soehner A. Sleep disturbance as transdiagnostic: consideration of neurobiological mechanisms. Clin Psychol Rev. 2011;31:225–35. doi: 10.1016/j.cpr.2010.04.003. [DOI] [PMC free article] [PubMed] [Google Scholar]
- 17.Sheaves B, Onwumere J, Keen N, Stahl D, Kuipers E. Nightmares in patients with psychosis: the relationship with sleep, psychotic, affective and cognitive symptoms. Can J Psychiatry. 2015;60:354–61. doi: 10.1177/070674371506000804. [DOI] [PMC free article] [PubMed] [Google Scholar]
- 18.Robillard R, Hermens DF, Naismith SL, et al. Ambulatory sleep-wake patterns and variability in young people with emerging mental disorders. J Psychiatry Neurosci. 2015;40:28–37. doi: 10.1503/jpn.130247. [DOI] [PMC free article] [PubMed] [Google Scholar]
- 19.Laursen TM, Munk-Olsen T, Nordentoft M, Bo Mortensen P. A comparison of selected risk factors for unipolar depressive disorder, bipolar affective disorder, schizoaffective disorder, and schizophrenia from a danish population-based cohort. J Clin Psychiatry. 2007;68:1673–81. doi: 10.4088/jcp.v68n1106. [DOI] [PubMed] [Google Scholar]
- 20.Kennedy N, Boydell J, Kalidindi S, et al. Gender differences in incidence and age at onset of mania and bipolar disorder over a 35-year period in Camberwell, England. Am J Psychiatry. 2005;162:257–62. doi: 10.1176/appi.ajp.162.2.257. [DOI] [PubMed] [Google Scholar]
- 21.Weissman MM, Bland RC, Canino GJ, et al. Cross-national epidemiology of major depression and bipolar disorder. JAMA. 1996;276:293–9. [PubMed] [Google Scholar]
- 22.Hickie IB, Hermens DF, Naismith SL, et al. Evaluating differential developmental trajectories to adolescent-onset mood and psychotic disorders. BMC Psychiatry. 2013;13:303. doi: 10.1186/1471-244X-13-303. [DOI] [PMC free article] [PubMed] [Google Scholar]
- 23.Ronald A, Sieradzka D, Cardno AG, Haworth CM, McGuire P, Freeman D. Characterization of psychotic experiences in adolescence using the Specific Psychotic Experiences Questionnaire: findings from a study of 5000 16-year-old twins. Schizophr Bull. 2014;40:868–77. doi: 10.1093/schbul/sbt106. [DOI] [PMC free article] [PubMed] [Google Scholar]
- 24.Hirschfeld RoMA, Holzer C, Calabrese JR, et al. Validity of the mood disorder questionnaire: a general population study. Am J Psychiatry. 2003;160:178–80. doi: 10.1176/appi.ajp.160.1.178. [DOI] [PubMed] [Google Scholar]
- 25.Lovibond SH, Lovibond PF. Manual for the Depression Anxiety Stress Scales. Sydney: Psychology Foundation; 1995. [Google Scholar]
- 26.Henry JD, Crawford JR. The short-form version of the Depression Anxiety Stress Scales (DASS-21): construct validity and normative data in a large non-clinical sample. Br J Clin Psychol. 2005;44:227–39. doi: 10.1348/014466505X29657. [DOI] [PubMed] [Google Scholar]
- 27.Espie CA, Kyle SD, Hames P, Gardani M, Fleming L, Cape J. The Sleep Condition Indicator: a clinical screening tool to evaluate insomnia disorder. BMJ Open. 2014;4:e004183. doi: 10.1136/bmjopen-2013-004183. [DOI] [PMC free article] [PubMed] [Google Scholar]
- 28.American Psychiatric Association. Diagnostic and statistical manual of mental disorders. 5th ed. Arlington, VA: American Psychiatric Association; 2013. [Google Scholar]
- 29.Levin R, Fireman G. Nightmare prevalence, nightmare distress, and self-reported psychological disturbance. Sleep. 2002;25:205–12. [PubMed] [Google Scholar]
- 30.Robert G, Zadra A. Measuring nightmare and bad dream frequency: impact of retrospective and prospective instruments. J Sleep Res. 2008;17:132–9. doi: 10.1111/j.1365-2869.2008.00649.x. [DOI] [PubMed] [Google Scholar]
- 31.Roenneberg T, Wirz-Justice A, Merrow M. Life between clocks: daily temporal patterns of human chronotypes. J Biol Rhythms. 2003;18:80–90. doi: 10.1177/0748730402239679. [DOI] [PubMed] [Google Scholar]
- 32.Roenneberg T, Kuehnle T, Pramstaller PP, et al. A marker for the end of adolescence. Curr Biol. 2004;14:R1038–9. doi: 10.1016/j.cub.2004.11.039. [DOI] [PubMed] [Google Scholar]
- 33.Horne JA, Östberg O. A self-assessment questionnaire to determine morningness-eveningness in human circadian rhythms. Int J Chronobiol. 1976;4:97–100. [PubMed] [Google Scholar]
- 34.Avada A, Gordijn MCM, Beersma DGM, Daan S, Roenneberg T. Comparison of the Munich Chronotype Questionnaire with the Horne-Östberg's Morningness-Eveningness score. Chonobiology Int. 2005;22:267–78. doi: 10.1081/cbi-200053536. [DOI] [PubMed] [Google Scholar]
- 35.Wittmann M, Dinich J, Merrow M, Roenneberg T. Social jetlag: misalignment of biological and social time. Chronobiol Int. 2006;23:497–509. doi: 10.1080/07420520500545979. [DOI] [PubMed] [Google Scholar]
- 36.IBM Corp. Armonk, NY: IBM Corp; 2010. SPSS Statistics for Windows, version 19.0. [Google Scholar]
- 37.Hemphill J. Interpreting the magnitude of of correlation coefficients. Am Psychol. 2003;50:78–9. doi: 10.1037/0003-066x.58.1.78. [DOI] [PubMed] [Google Scholar]
- 38.Tsanas A, Little MA, McSharry PE. A methodology for the analysis of medical data. In: Sturmberg JP, Martin CM, editors. Handbook of Systems and Complexity in Health. New York: Springer; 2013. pp. 113–25. [Google Scholar]
- 39.Hastie T, Tibshirani R, Friedman J. Elements of Statistical Learning. 2nd ed. New York: Springer; 2009. [Google Scholar]
- 40.Lewandowski KE, Sperry SH, Cohen BM, Ongür D. Cognitive variability in psychotic disorders: a cross-diagnostic cluster analysis. Psychol Med. 2014;44:3239–48. doi: 10.1017/S0033291714000774. [DOI] [PMC free article] [PubMed] [Google Scholar]
- 41.Van der Maaten LJP, Hinton GE. Visualizing High-Dimensional Data Using t-SNE. J Mach Learn Res. 2008;9:2579–605. [Google Scholar]
- 42.Krakow B. Nightmare complaints in treatment-seeking patients in clinical sleep medicine settings: diagnostic and treatment implications. Sleep. 2006;29:1313–9. doi: 10.1093/sleep/29.10.1313. [DOI] [PubMed] [Google Scholar]
- 43.National Institute for Health and Care Excellence. Managing long term insomnia (> 4 weeks) NICE Clin Knowl Summ. 2015. [Accessed May 11, 2015]. Available at: http://cks.nice.org.uk/insomnia#!scenario:1.
- 44.Morin CM, Benca R. Chronic insomnia. Lancet. 2012;379:1129–41. doi: 10.1016/S0140-6736(11)60750-2. [DOI] [PubMed] [Google Scholar]
- 45.Wilson SJ, Nutt DJ, Alford C, et al. British Association for Psychopharmacology consensus statement on evidence-based treatment of insomnia, parasomnias and circadian rhythm disorders. J Psychopharmacol. 2010;24:1577–601. doi: 10.1177/0269881110379307. [DOI] [PubMed] [Google Scholar]
- 46.Casement MD, Swanson LM. A meta-analysis of imagery rehearsal for post-trauma nightmares: effects on nightmare frequency, sleep quality, and posttraumatic stress. Clin Psychol Rev. 2012;32:566–74. doi: 10.1016/j.cpr.2012.06.002. [DOI] [PMC free article] [PubMed] [Google Scholar]
- 47.Hansen K, Höfling V, Kröner-Borowik T, Stangier U, Steil R. Efficacy of psychological interventions aiming to reduce chronic nightmares: a meta-analysis. Clin Psychol Rev. 2013;33:146–55. doi: 10.1016/j.cpr.2012.10.012. [DOI] [PubMed] [Google Scholar]
- 48.Escamilla M, LaVoy M, Moore B, Krakow B. Management of post-traumatic nightmares: a review of pharmacologic and nonpharmacologic treatments since 2010. Curr Psychiatry Rep. 2012;14:529–35. doi: 10.1007/s11920-012-0306-7. [DOI] [PubMed] [Google Scholar]
- 49.Aurora RN, Zak RS, Auerbach SH, et al. Best practice guide for the treatment of nightmare disorder in adults. J Clin Sleep Med. 2010;6:389–401. [PMC free article] [PubMed] [Google Scholar]
- 50.Freeman D, Sheaves B, Goodwin GM, et al. Effects of cognitive behavioural therapy for insomnia on the mental health of university students: study protocol for a randomized controlled trial. Trials. 2015;16:236. doi: 10.1186/s13063-015-0756-4. [DOI] [PMC free article] [PubMed] [Google Scholar]
- 51.Chandler R, Wang PW, Ketter T, Goodwin GM. A new US-UK diagnostic project: mood elevation and depression in first-year undergraduates at Oxford and Stanford universities. Acta Psychiatr Scand. 2008;118:81–5. doi: 10.1111/j.1600-0447.2008.01193.x. [DOI] [PubMed] [Google Scholar]
- 52.Yung AR, Yuen HP, Mcgorry PD, et al. Mapping the onset of psychosis: the comprehensive assessment of at-risk mental states. Aust N Z J Psychiatry. 2005;39:964–71. doi: 10.1080/j.1440-1614.2005.01714.x. [DOI] [PubMed] [Google Scholar]
Associated Data
This section collects any data citations, data availability statements, or supplementary materials included in this article.