Abstract
Venous needle dislodgement (VND) is a life-threatening complication during haemodialysis (HD) treatment. When VND occurs, it only takes a few minutes for blood loss in an adult patient. According to the ANNA (American Nephrology Nurses’ Association) VND survey reports, VND is a concerning issue for the nephrology nurses/staff and patients. To ensure HD care and an effective treatment environment, this Letter proposes a combination of fractional order shape index ratio (SIR) and fuzzy colour relation analysis (CRA) to detect VND. If the venous needle drops out, clinical examinations show that both heart pulses and pressure wave variations have a low correlation at the venous anatomic site. Therefore, fractional order SIR is used to quantify the differences in transverse vibration pressures (TVPs) between the normal condition and meter reading. Linear regression shows that the fractional order SIR has a high correlation with the TVP variation. Fuzzy CRA is designed in a simple and visual message manner to identify the risk levels. A worst-case study demonstrated that the proposed model can be used for VND detection in clinical applications.
Keywords: cardiology, regression analysis, risk analysis, blood pressure measurement, patient treatment, patient monitoring
Keywords: risk level, TVP variation, linear regression, transverse vibration pressure, venous anatomic site, heart pressure wave variation, heart pulse variation, haemodialysis care, blood loss, haemodialysis treatment, colour relation analysis, fuzzy CRA, shape index ratio, fractional order SIR, VND detection, venous needle dislodgement
1. Introduction
According to the 2013 statistics, in Taiwan, more than 78,000 patients with end-stage renal disease and chronic kidney failure have received haemodialysis (HD) therapy. HD 3 days a week has become a routine treatment. However, some complications frequently occur from early clots and thrombosis progressing to outflow stenosis, resulting in a non-substantial intra-graft blood flow. The maintenance of proper function and blood flow is the most important issue for dialysis care; the flow threshold should be <600 ml/min for an arteriovenous fistula (AVF) and <400–500 ml/min for an arteriovenous graft (AVG). In addition, venous needle dislodgement (VND) is a life-threatening complication during HD therapy, leading to rapid blood loss in the patient and to mortality [1–3]. For a typical HD, at blood flow rates of 400–500 ml/min, it takes a few minutes for a patient to lose over 40% of the adult blood volume [4]. Therefore, it is important to reduce the risk of VND.
In a lecture [5] in 2012, ANNA (American Nephrology Nurses’ Association) VND survey reports revealed that more than 75% of the survey candidates indicated they had seen VND, with more than 8% having seen five events or more in the last 5 years. Survey results also showed that more than half of the candidates concerned about VND indicated that they were concerned about VND very often (>30%) or often (>20%). Six risk levels were identified in the ANNA VND survey results [1], and practice recommendations were also implemented to prevent VND [2, 6–9], such as selecting an access cannulation site beforehand, which serves a dual purpose, taping the needles securely, assuring access visibility, using a safety dialysis machine and monitoring devices during HD, monitoring dialysis catheters, pressure variations in bloodlines, and pressure/moisture monitoring. A typical HD machine pumps the patient's blood through a dialyser, as shown in Fig. 1. Various alarms have been built in an HD system and can signal system malfunction using pressure (pump pull and push), blood leaks, pump flow, and temperature monitors. It also has the ability to measure venous pressure to monitor VND with specific alarm ranges (−30 mmHg/+70 mmHg) during the HD [7, 10]. When a venous needle is dislodged, the pressure drop is used to detect blood loss and to stop the blood pump immediately. However, static pressures (30–40 mmHg) are influenced by patients’ movements, height changes, cannula sizes, blood flow rates, dialysis access (AVG/AVF), flow resistances, and blood viscosity during dialysis. The effect of height changes can be predicated in HD patients, others may add 5–10 mmHg variations. In addition, a pad as an early warning device is used to increase the possibility of the machine sounding an alarm [2]. As a customised product, a detection device (CE mark, Redsense® monitor, Halmstad, Sweden, FDA-approved) for high-risk patients and home HD can be used to detect blood loss at the access cannulation sites. It relied on an optical sensor and is not sensitive to clear but conductive fluids as saline. Wetness sensors are not only sensitive to blood but also to saline and other fluids in the patient environment [11]. They are an alarm device that cannot stop the blood pump as there is no interface with the HD machine. Therefore, this study proposes a method to measure the pressure wave variation in a blood line at the venous (outflow) site and fuzzy colour relation analysis (CRA) for VND detection.
Fig. 1.
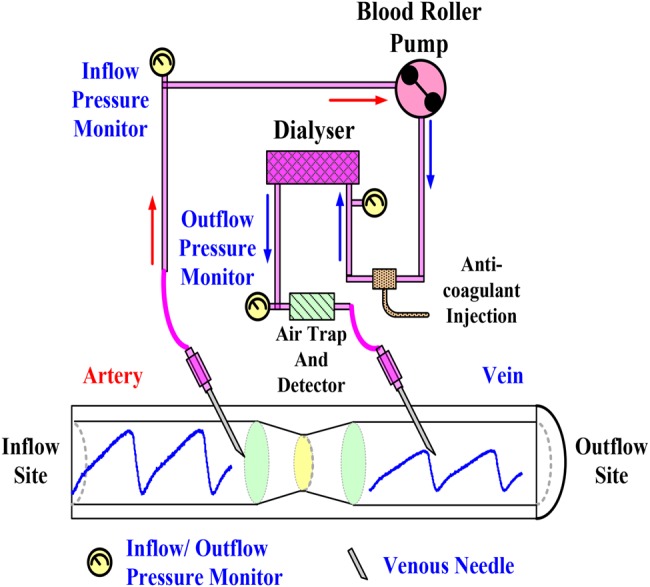
Vascular access and HD route diagram
The blood pressure wave (BPW) generated by a heartbeat propagates through the human vascular system and enters the extracorporeal blood circuit of the HD machine. BPW can be measured by pressure sensors connecting to the arterial line and the venous line. Previous studies [12–14] have shown that when a venous needle drops out or a blood pump stops, both heart pulses and BPW variations had a low correlation at the venous anatomic site. This critical information is used to identify disconnection of a venous needle in real life. In addition, the elastic vascular wall causes vibrations in the blood access route, due to the transverse vibration pressure (TVP). A TVP is a moving wave consisting of oscillations perpendicular to the direction of propagation of the BPW, which squeezes the blood flow forward. Vascular access compliance, blood flow rate, and flow resistance affect the TVP's oscillation amplitude, while TVP's amplitude or vibration decreases as a VND event occur or the blood circuit disconnect. Therefore, the outflow BPWs of an AVG are measured using venous needles and pressure sensors. TVPs can be extracted from BPWs using the detrending process [15] to remove the roller pump pressures and arterial access (fistula)/venous access (fistula) pressures [11] for further analysis. To quantify the differences in TVPs between the normal condition and a VND event occurrence, TVP variation is primarily used to define the risk levels of blood loss, with the blood flows of 200–500 ml/min, >500 ml blood loss, and <2.5 min reaction time for an adult [11]. Discrete fractional order integrator (FI) with finite computations, short-memory requirement, and a finite power series [16–19] is employed to calculate the shape index ratio (SIR) for in-line signal processing, while fractional order SIR is validated to identify the risk level, referring to TVP variations. Then, a fuzzy CRA-based classifier [20, 21] utilises a visual message manner to automatically detect VND during HD treatment.
The rest of this Letter is organised as follows. Section 2 describes the experimental setup and defines significant parameters, Section 3 addresses the methodology, including the discrete FI, fuzzy CRA, and perceptual colour manner, and Sections 4 and 5 present experimental results, discussions, and conclusions to demonstrate the efficiency of the proposed model.
2. Experimental setup
Fig. 2 shows an equivalent human cardiovascular system for an HD patient, representing the mock flow phenomena in the laboratory. This experimental circulation system uses a roller pump as a pressure source regulator (Precision blood pump, COBE, LAKEWOOD, CO 80215, USA), a VND model, an experimental AVG, a liquid tank, and silicone tubes as arteries and veins. The roller pump simulates the blood circulation for an adult. It is used to control the flow rate, blood pressure, and heart rate during HD condition with a flow rate of ∼400–500 ml/min. Heart rate, 80–120 beats/min, was used to drive the blood-mimicking fluid (BMF) flow through the circulation circuits. The circulation access was made by silicon tubes to mock the blood vessel. Their inner diameters were the same circular cross-section with constant wall thickness, 0.635 cm for in-vitro arteries and veins. The AVG consisted of a semi-cylindrical block of polydimethyl-siloxane with a refractive index of 1.40 [22]. It was used to mimic the blood vessel boundary within heterogeneous tissues. A VND model uses a control valve to adjust the volume of BMF loss. Degree of control valve (DCV), 0–100%, was used to simulate <200–500 ml/min BMF loss with the 10–30 s reaction time. Human blood viscosity corresponds approximately to a haematocrit value of 30–45%, which is the specific range for a normal adult. In this Letter, we did not have accurate temperature control. The temperature in our experimental study is ∼28°C; a decrease in temperature by 1°C results in a 2% increase in viscosity. Therefore, a mixture of water–glycerin fluid, with a haematocrit ratio of 38–62%, a kinematic viscosity of 3.2 × 10⁻⁶ m2/s, and a density of 1090 kg/m3 was used as a BMF, similar to a normal adult. The pressures were measured at the inflow and outflow sites using venous needles, pressure transducers, and pressure sensors, as shown in Fig. 2.
Fig. 2.
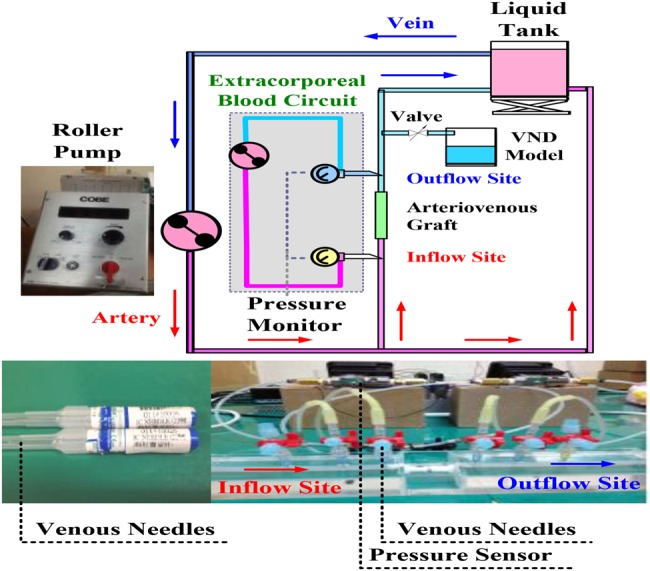
Equivalent human cardiovascular system for VND experiment
In previous lectures [12–14], a disconnection monitor has been proposed in an extracorporeal blood circuit being used for any blood processing treatment routine. The monitor included a pressure sensor for receiving the pressure pulse signal in the blood circuit, and a cardiac reference signal for receiving the patient's pulse. When a blood line got disconnected or a blood pump stopped in the venous return circuit, a processor cross-correlates the pressure pulses in the blood circuit and the patient's pulses within a specific time frame/cardiac cycles. This indicated that heart pulses and pressure variations are present and there is a high correlation at the inflow (arterial anatomic) site. However, both variations in the blood lines have a low correlation at the outflow (venous anatomic) site.
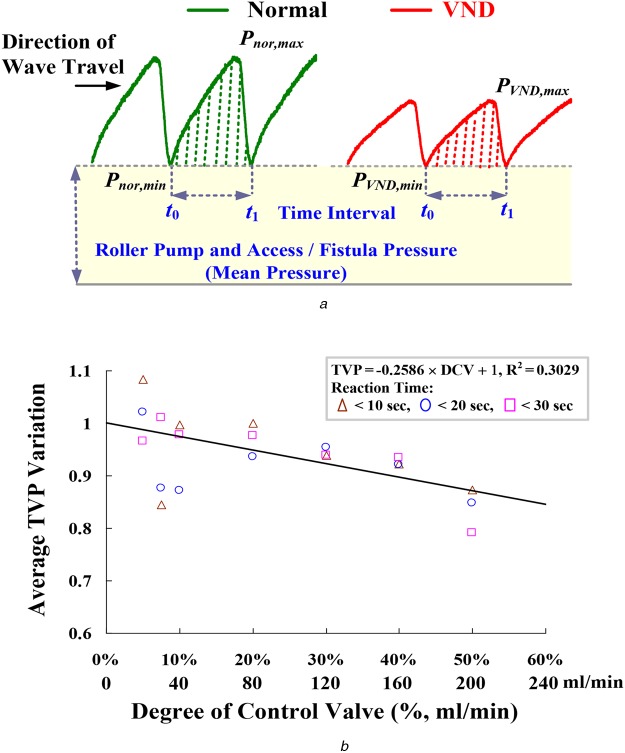
In addition, vessels contain elastic membranes in their wall, which produce pulsatile blood flow through the vascular system [12]. TVP will induce and drive the same blood volume forward during systole. However, a severe blood loss, an AVG stenosis, or a very irregular heart rhythm [12–14] indicates the amplitudes of TVP variations, as shown in Fig. 3a. In this study, detrending process [15] removes the roller pump pressures and mean vascular access pressures, while TVPs can be obtained. Then, SIR is used to evaluate the similarity and is defined as
| (1) |
Fig. 3.
Pressure variations and average TVP variation versus DCV
a Pressure variations in blood-line at outflow site
b Average TVP variation versus DCV, Pnor,min = 85–65 mmHg, PVND,min = 80–50 mmHg
TVP variation
| (2) |
where Pmea(t) is the TVP for the incoming measured pulse using the beat-by-beat measurement; Pnor(t) is the TVP for normal condition pulse, which is stored in the database before the detector setup, using the average of stable pulses about 1–3 min; Pmea,min = min{Pmea(t)} and Pnor,min = min{Pnor(t)} within the time interval [t0, t1]. For 28 measurements including 7 normal conditions and 21 VND events, TVPvar gradually decreases as the DVC varying 0–50% (0–200 ml/min) with the 10–30 s reaction time, as shown in Fig. 3b. SIR >0.5 and approaching 1.0 implies high correlation between the normal pulses and the measurement pulses, and STR <0.50 and approaching 0.0 means low correlation and provides an alarm signal for VND detection.
3. Methodology
3.1. Discrete FI
Traditional integer derivative or integral computations use integer-order differential operators with Tustin transforms and trapezoidal integration methods for geometrical interpretations. In contrast, fractional order calculus is with respect to time [16]. Thus, it is employed to describe dynamic phenomena both in the time domain and frequency domain behaviours. For signal processing, the fractional order integral implies all non-integer and irrational numbers to deal with signals, and the summation is computed using the ratios of the gamma function, Γ(α), incorporating the number of sampling data points in the range [t0, t1], and the fractional order parameters, α [16–19]. Therefore, there is a broad range to analyse time-varying signals, such as fluid flows and bio-signals. The original FI, the αth FI of function P(t), 0 < α < 1, α ∈ R, is given by
| (3) |
where numerical integration is computed using the Riemann sum over the variable t at time step τ. For the purpose of computation, Riemann–Liouville or Grünwald–Letnikov (G–L) fractional approximations [17] is carried out as the basis for a discrete formulation. Therefore, (3) is modified using the G–L definition as [12–14]
| (4) |
where 0 < α < 1 for the FI process, α ∈ R; −1 < α < 0 for the fractional derivative (FD) process; for α as integer is integer-order differentiation or integration process; n is the number of sampling points, i = 1, 2, 3, …, n; and the binomial coefficients are given as
| (5) |
time step
| (6) |
Timing parameters, t0 and t1, are the bounds of each time interval. That is, (1) can be modified as a discrete approximated formulation, and the fractional order SIR is defined as
| (7) |
where the discrete measured TVP at the outflow site is referred to as Pmea[i]; the normal TVP at the outflow site is referred to as Pnor[i], i ∈ [0, n − 1]. The SIR(α) is a function of the variable fractional order and it has a broad range to extract the characteristics of the time-varying signals. In addition, numerical evaluation with finite computations, short-memory requirement, and finite power series is an advantage for computer programming, summation operation, and numerical regression.
3.2. Fuzzy colour relation analysis
When VND occurs in the patient, there is 300 ml/min blood loss, which is usually discovered after about 20 s. A severe case has >500 ml lethal blood flow with exceeding 2.5 min. Patients have acute blood pressure drop or amplitudes of TVP variations during a VND event. According to the SIR, its value appears as the correlation between the Pmea and Pnor, which implies the degree of similarity. These normal condition and risk levels can be parameterised with certainty factors (CFs), as shown in Fig. 4. The CF values versus fractional order SIRs can be presented as follows
| (8) |
| (9) |
| (10) |
where μ1 is the probability value between ‘0’ and ‘1’ for normal condition, μ2 for blood loss risk, <200 ml, and μ3 for major blood loss, 200–500 ml or more than 500 ml [11].
Fig. 4.
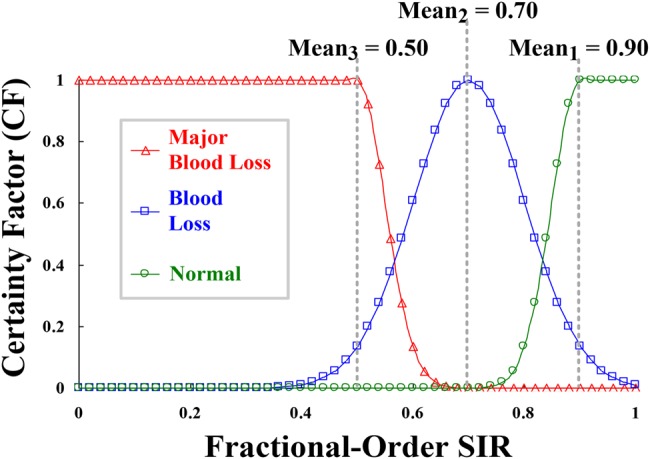
CFs versus fractional order SIR
Then, CF = [μ1, μ2, μ3] is converted to grey grade ρj ∝ ξ, j = 1, 2, 3, by nonlinear transformation, as described in previous studies [20, 21]
| (11) |
where ξ is the recognition coefficient with interval (0, ∞); ξ = 5.0 in this Letter. Transformation is a nonlinear Gaussian function, as shown in Fig. 5a. Thus, intensity adjustment is used to enhance contrast and provides better contrast to separate examination data in two classes. The minimum and maximum grades can be obtained as follows
| (12) |
| (13) |
where ρmin ≠ ρmax. According to the hue-saturation value (HSV) colour model, the CRA-based classifier [20, 21] is defined mathematically by transformations between red-green-blue (RGB) and HSV colour spaces [23]. Grey grades were converted to primary colour grades, r(red), g(green), and b(blue) as follows
| (14) |
where r, g, and b ∈ [0, ξ] are the red, green, and blue coordinates in the RGB colour space. Primary colour grades are employed to identify the normal condition and VND's risk levels. The hue angle H∈[0, 360] of the HSV colour space is determined as follows
| (15) |
| (16) |
| (17) |
Fig. 5.
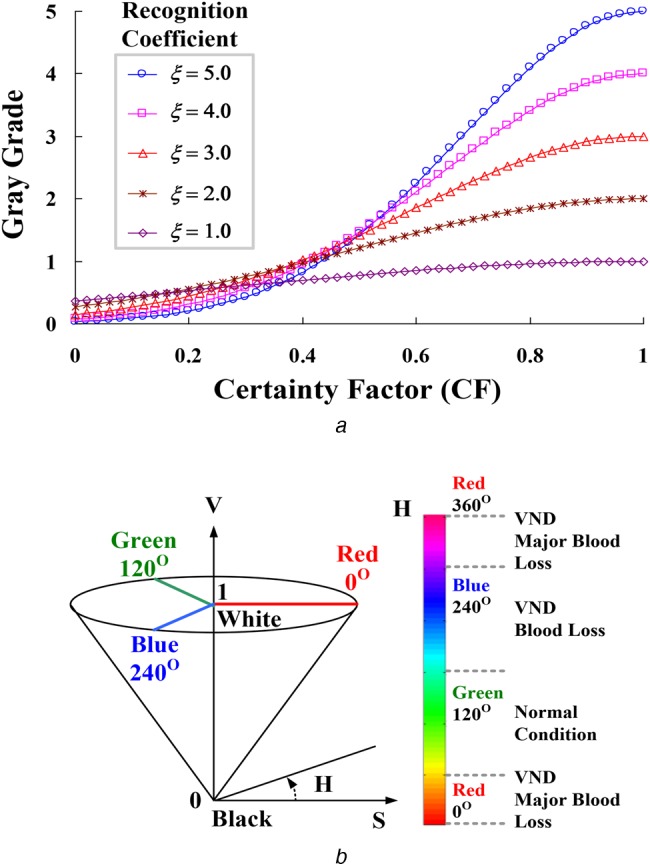
Grey grade conversion and HSV colour model
a Grey grade versus CF
b RGB colour space and transformation
Index Hj (Hj = 1, 2, and 3) is used to identify the three risk levels, in terms of fraction order SIRs, which are the green-series colour for normal condition: 0.9–1.0, blue-series colour for VND event-blood loss: 0.5–0.9, and red-series colour for VND event-major blood loss: <0.5, as shown in Fig. 5b. The saturation, S, and value, V, are defined as follows
| (18) |
The value of index, H, is generally normalised to lie between 0° and 360°, while ρmin = ρmax and S = 0 with no geometric meaning. For VND detection, index H is carried out to identify the risk levels as angle points, as shown in Fig. 5b. Subsequently, index S of 0.5–1.0 provides high confidence for confirming the possible level.
4. Experimental results
The experimental system mimics the human cardiovascular system and extracorporeal blood circuit in the laboratory, as shown in Fig. 2. The inflow and outflow pressures could be measured using two venous needles (Terumo Surflash 22G) and two pressure transducers (NOSHOK, Inc.). A flow rate of 600 ml/min was used to drive the BMF through the blood circuits and an AVG access by a roller pump. Measurement data was transferred from analogue to digital with a compatible PC via a Data Acquisition (DAQ) card (NI™). When VND occurs, normalised TVPs (average Pnor,max = 100 mmHg) at the outflow site are shown in Fig. 6a. The amplitudes of TVPs in the patient's blood pressure varied from TVPvar = 1.0 to 0.1, which also indicated the situations from the normal condition to severe blood loss. In addition, the discrete FI and fuzzy CRA were designed to process measurement data and evaluate the VND risk levels using LabVIEW graphical programming software (National Instruments™ Corporation, Austin, Texas, USA) and MATLAB software (MathWorks, Natick, Massachusetts, USA). The flowchart of the overall detection procedure using the FI and fuzzy CRA is shown in Fig. 7.
Fig. 6.
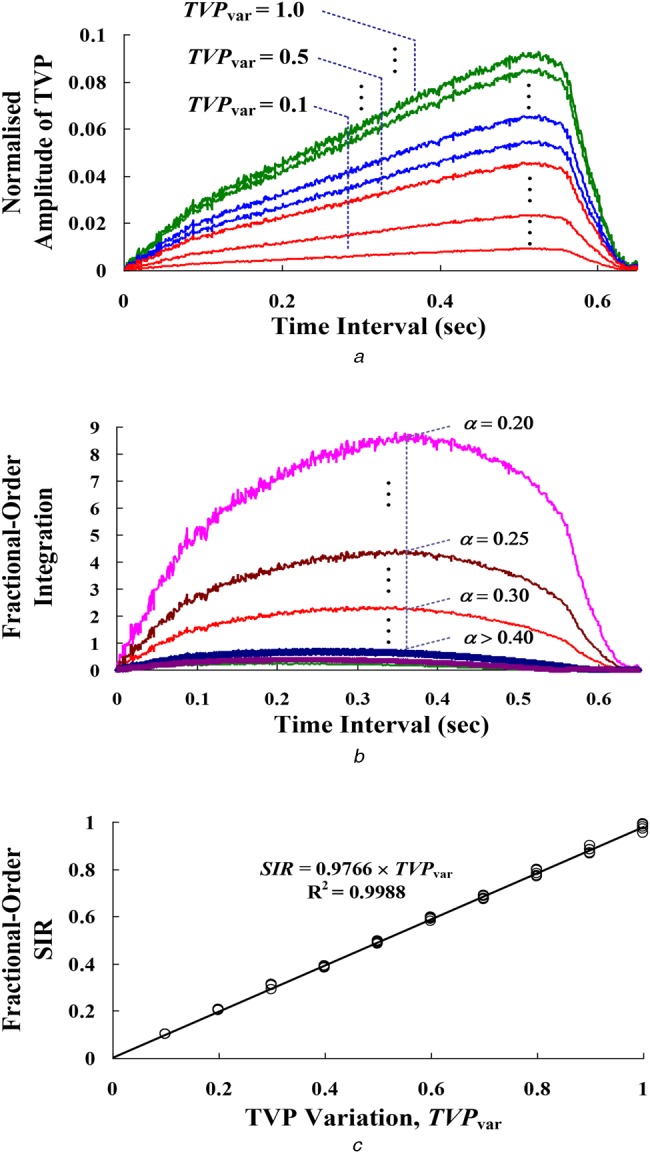
Extraction features
a Amplitudes of TVPs varied from TVPvar = 1.00 to 0.10
b FI computations with fractional order, α = 0.20 –> 0.40
c Fractional order SIR versus the TVP variation
Fig. 7.
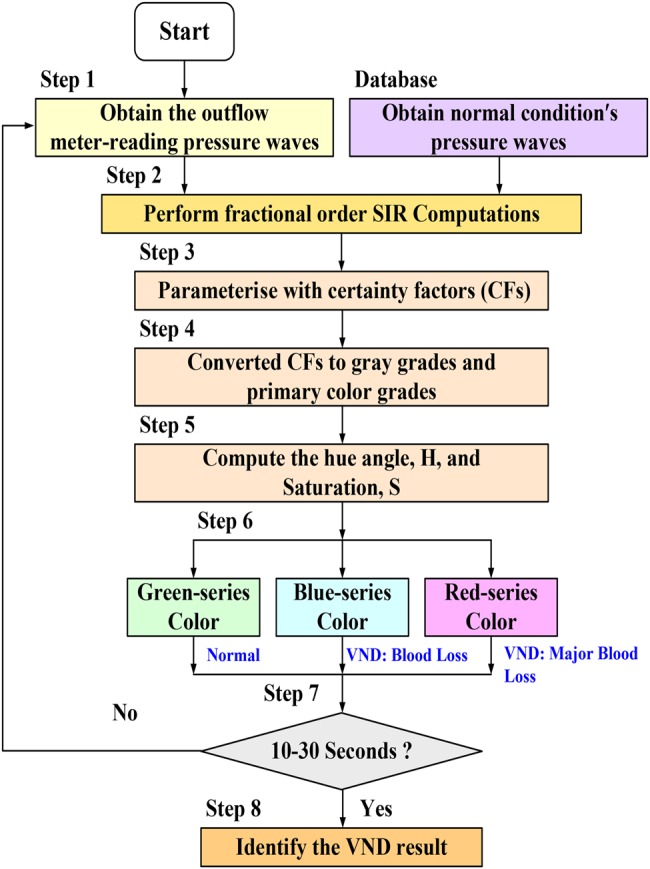
Flowchart of VND detection procedure
In the signal processing stage, the FI with fractional order, α = 0.2 –> 0.4, was calculated using (4)–(6), as shown in Fig. 6b. Distinguishable features with a fractional order, α < 0.3 can be seen. For time and frequency domain analysis, the variations of rise time, settling time, peak time, time constant, and per cent overshoot are with respect to the fractional order, α. The discretisation-technique FIs and FDs have been designed with order 0.25–0.50 for different feature extractions in real-time applications, such as the detection of ECG QRS Complex sequences in atrial rhythms and the detection of edges in an image [14]. Hence, α = 0.3 was chosen in this study. Then, fractional order SIR was calculated using (5)–(7). For 50 examination data, linear regression is used to perform a least square curve fit, and the correlation can be seen as fractional order SIR = 0.9766 × TVPvar, R2 = 0.9988, as seen in Fig. 6c. Hence, the index, SIR, decreases in VND detection as the blood loss worsens.
The experimental tests were conducted as follows: (i) meter-reading and normal TVP waves were obtained using the measurement device and chosen from the database (at least 10–30 s), respectively; (ii) fractional order SIRs were calculated, and (iii) automation VND detection was conducted using the fuzzy CRA. For examination data, Fig. 8a shows the ten normalised TVP waves in time domain, with a sampling rate of 1.0 kHz and an average cardiac cycle of about 0.68 s. Numerical computations with fractional calculus were performed and then fractional order SIRs could be presented in Fig. 8b. Suppose VND occurs at the sixth cardiac cycle, the critical changes at the beginning of VND occurrence was noted by observing SIR. It appears that SIR suddenly increases because of a serious variation in the TVP wave. Thus, its value (average SIR = 0.5010) can be used to identify the normal or VND risks. The fuzzy CRA is a visual model to represent the different risk levels in a colour circular manner, using the indices average H = 120.01 (pure-green colour) and average S = 0.9933 for ‘normal condition’ and average H = 309.59 (red-series colour) and average S = 0.9926 for ‘VND event-major blood loss’, as shown in Figs. 8c and d. Twenty-one VND events were made to quantify the performance of signal identification. Positive predictivity is more than 90% (total of 15–45 TVP waves, about 10–30 s) without or with a slight noisy background. The experimental study confirms that the proposed VND detection model allows accurate examinations for on-line analysis.
Fig. 8.
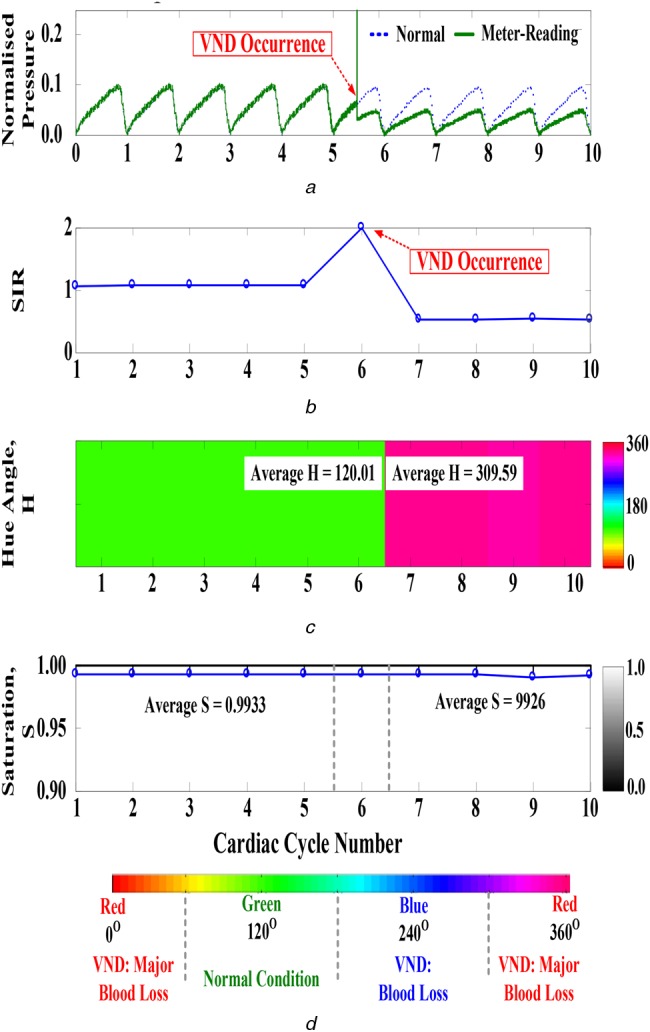
Experimental results
a Time-domain normal and meter-reading TVP waves at outflow site
b Fractional order SIR during ten cardiac cycles
c Hue angles during ten cardiac cycles
d Saturation during ten cardiac cycles
5. Conclusion and discussion
Previous studies have discussed the life-threatening complication of VND in ANNA survey reports. VND education, VND materials (handouts and posters) [1], and easy-to-use assistant tools provide promising strategies and recommendations to reduce the risk of VND in patients. To ensure HD care, dialysis organisations have established evidence-based procedures that provided a safe and effective treatment environment for the nephrology nurses/staff and patients, such as securing and positioning the bloodlines, maintaining blood line visibility, and monitoring dialysis access during HD treatment [1]. Detection tools are also provided to monitor venous pressure, and extra monitors were used to detect blood loss using a moisture/wetness sensor and an optical sensor. These promising resources have been designed to generate an alarm and serve as reminders to reduce the risk of VND occurrences but lack an automatic identification function to stop the HD machine's blood pump.
Venous pressure variation is also a factor to detect VND. However, static pressure measurements are influenced by extracorporeal circuit's blood flow, blood viscosity, flow resistances, dialysis access pressure, and venous cannula sizes. This study proposed a VND detection model with the discrete FI and fuzzy CRA to evaluate the risk of blood loss during HD treatment. The experimental examinations were conducted in an equivalent human cardiovascular system and in-vitro AVGs. In the measurement system, pressure sensors were used to acquire meter-reading pressures at the outflow sites. Adjusting the BMF loss via a control valve, the variation of TVP, TVPvar, is correlated with the SIR as validated by the fractional order SIR. With a linear regression (R2 = 0.9988), fractional order SIR also refers to the risk levels of blood loss. Then, fuzzy CRA is a flexibility inference mechanism to identify the risk level, and its mathematical computation requires no iterative computation to update any parameter. Adjustable parameters such as recognition coefficient, ξ, monotonously increases to enhance the accuracy. For a worse case, TVPvar = 0.50 (blood loss >200 ml), experimental results confirm that the proposed model and detection procedure have reliable positive predictivity for on-line analysis. Therefore, an automatic detection tool and visual message-based model can be achieved to detect blood loss and further generate alarm to stop the roller pump for nephrology nurses. The risk of major blood loss will be reduced to an acceptable level, <500 ml.
In addition, fuzzy CRA can overcome the complexity of an adjustable mechanism. Recognition coefficient is the only adjustable parameter to enhance contrast, which is used to separate the margin into two or more classes. Thus, further research can use the proposed detection model to implement the inference algorithm in an embedded system (ES) or a programmable microprocessor. An ES's current technique can be applied to design a detector, such as (i) using a built-in digital signal processor to support signal preprocessing; (ii) implementing the inference algorithm in a programmable processor, such as NI™ myRIO embedded student design device [24]. Researchers can easily use graphical programming to solve the specific problem and to design the proposed model without a cumbersome tool. The discretisation-technique FI with fractional order, α = 0.3, can also be designed by power series expansion and can be implemented in real time using a programmable processor. The results also indicate that the prototype model could be integrated in a clinical HD machine without the need for extra devices. For future applications, an HD machine integrated with the monitoring device could be achieved during HD.
6. Acknowledgment
This work was supported by the research grant of National Cheng Kung University, under contract number: NCKUH-103-05001, duration: January 1, 2014 ∼ December 31, 2014, and the research grant of Kaohsiung Veterans General Hospital, under contract number: VGHKS 104-057, duration: January 1, 2015 ∼ December 31, 2015.
7. Conflict of interests and ethical approval
The authors declare that there is no conflict of interests regarding the publication of this paper. The study doesn't involve human and animal subjects.
8 References
- 1.Axley B., Speranza-Reid J., Williams H.: ‘Venous needle dislodgement in patients on hemodialysis’, Nephrol. Nurs. J., 2012, 39, (6), pp. 435–445. [PubMed] [Google Scholar]
- 2.Hurst J.: ‘It can happen without warning: venous needle dislodgement’, Ren. Bus. Today, 2009, 4, (9), pp. 18–22 [Google Scholar]
- 3.Hurst J.: ‘A costly complication: venous needle dislodgement’, Ren. Bus. Today, 2010, 5, (9), pp. 18–22 [Google Scholar]
- 4.Reines G.G., Gutierrez W.: ‘Clinical review: hemorrhagic shock’, Crit. Care, 2004, 8, (5), pp. 373–381 (doi: ) [DOI] [PMC free article] [PubMed] [Google Scholar]
- 5.American Nephrology Nurses’ Association (ANNA): 2012. Available at https://www.annanurse.org/resources/venous-needle-dislodgement
- 6.Dinwiddie L.C.: ‘Vascular access for hemodialysis’, in American Nephrology Nurses' Association: ‘Core curriculum for nephrology nursing’ (C.S. Counts, 2008), pp. 756–758 [Google Scholar]
- 7.Mactier R., Worth D.: ‘Minimizing the risks of needle dislodgement during haemodialysis’, Artery, 2007, 41, (3), pp. 9–13 [Google Scholar]
- 8.Sandroni S.: ‘Venous needle dislodgement during hemodialysis: an unresolved risk of catastrophic hemorrhage’. Briefing paper presented for discussion for the EDTNA/ERCA Journal Club, 2005
- 9.R. Fields: ‘When needles dislodge, dialysis can turn deadly’, 2010. Available at http://www.propublica.org/article/when-needles-dislodge-dialysis-canturn-deadly
- 10.Van Waeleghem J.P., Chamney M., Lindley E.J., et al. : ‘Venous needle dislodgment: how to minimize the risks’, J. Ren. Care, 2008, 34, (4), pp. 163–168 (doi: ) [DOI] [PubMed] [Google Scholar]
- 11.Polaschegg H.-D.: ‘Venous needle dislodgement: the pitfalls of venous pressure measurement and possible alternatives, a review’, J. Ren. Care, 2010, 36, (1), pp. 41–48 (doi: ) [DOI] [PubMed] [Google Scholar]
- 12.Frinak S., Zasuwa G., Yee J., et al. : ‘Method of monitoring dislodgement of venous needles in dialysis patients’. Patent Application Publication, Pub. No. US 2010/0073171 A1, March 25, 2010
- 13.Fulkerson B.N., Braig J.R.: ‘System and method for detection of disconnection in an extracorporeal blood circuit’. Patent Application Publication, Pub. No. US 2010/0234786 A1, September 16, 2010
- 14.Holmer M., Sandberg F., Solem K., et al. : ‘Extracting sardiac signal from the extracorporeal pressure sensors of a hemodialysis machine’, IEEE Trans. Biomed. Eng., 2015, 62, (5), pp. 1305–1315 (doi: ) [DOI] [PubMed] [Google Scholar]
- 15.Syntax: detrend. Available at www.mathworks.com/help/matlab/ref/detrend.html#syntax
- 16.Ikeda F.: ‘A numerical algorithm of discrete fractional calculus by using inhomogeneous sampling data’, Trans. Soc. Instrum. Control Eng., 2006, 42, (8), pp. 941–948 (doi: ) [Google Scholar]
- 17.Das S.: ‘Functional fractional calculus for system identification and control’ (Springer Berlin Heidelberg, New York, 2008), Ch. 1 [Google Scholar]
- 18.Charef A., Bensouici T.: ‘Design of digital FIR variable fractional order integrator and differentiator’, Signal Image Video Process., 2012, 6, (4), pp. 679–689 (doi: ) [Google Scholar]
- 19.Krishna B.T.: ‘Studies on fractional order differentiators and integrators: a survey’, Signal Process., 2011, 91, (3), pp. 386–426 (doi: ) [Google Scholar]
- 20.Lin C.-H.: ‘Assessment of bilateral photoplethysmography for lower limb peripheral vascular occlusive disease using color relation analysis classifier’, Comput. Method Program Biomed., 2011, 103, (3), pp. 121–131 (doi: ) [DOI] [PubMed] [Google Scholar]
- 21.Li C.-M., Du Y.-C., Wu J.-X., et al. : ‘Dynamic analysis with a fractional-order chaotic system for estimation of peripheral arterial disease in diabetic foot’, Meas. Sci. Technol., 2013, 24, (8), pp. 1–11 (doi: ) [Google Scholar]
- 22.Knuttel A., Boehlau-Godau M.: ‘Spatially confined and temporally resolved refractive index and scattering evaluation in human performed with optical coherence tomography’, J. Biomed. Opt., 2000, 5, (1), pp. 83–92 (doi: ) [DOI] [PubMed] [Google Scholar]
- 23.Khan T., Shrestha R., Shamin Imtiaz Md., et al. : ‘Colour-reproduction algorithm for transmitting variable video frames and its application to capsule endoscopy’, IET Healthc. Technol. Lett., 2015, 2, (2), pp. 52–57, (doi: ) [DOI] [PMC free article] [PubMed] [Google Scholar]
- 24.Doering E.: ‘NI myRIO-project essentials guide’ (National Technology and Science Press, 2014) [Google Scholar]


