


Abstract
Deeper understanding of the anatomical intermediaries for disease and other complex genetic traits is essential to understanding mechanisms and developing new interventions. Existing ontology tools provide functional, curated annotations for many genes and can be used to develop mechanistic hypotheses; yet information about the spatial expression of genes may be equally useful in interpreting results and forming novel hypotheses for a trait. Therefore, we developed an approach for statistically testing the relationship between gene expression across the body and sets of candidate genes from across the genome. We validated this tool and tested its utility on three applications. First, we show that the expression of genes in associated loci from GWA studies implicates specific tissues for 57 out of 98 traits. Second, we tested the ability of the tool to identify novel relationships between gene expression and phenotypes. Specifically, we experimentally confirmed an underappreciated prediction highlighted by our tool: that white blood cell count – a quantitative trait of the immune system – is genetically modulated by genes expressed in the skin. Finally, using gene lists derived from exome sequencing data, we show that human genes under selective constraint are disproportionately expressed in nervous system tissues.
INTRODUCTION
A major goal of human genetics has been to identify loci that are associated with diseases or quantitative traits. Using techniques such as linkage analysis, genome wide association (GWA), and next generation sequencing, researchers have implicated thousands of loci across diseases and traits: there are over 3,674 phenotypes with molecular basis reported in OMIM, and over 15,396 SNPs implicated in at least one phenotype in the NHGRI GWAS catalog. Functional follow-up of genes is difficult to do in human populations and must be carried out in simplified model systems, but having some a priori information about the genes of interest can direct hypotheses for functional studies as well as impact our knowledge of the human traits. Tools such as Gene Ontologies (1), the KEGG database, and others (2–4) serve as a rich source of functional data, but are static resources (5) that rely on manually curated information. Approaches that utilize dynamic sources of information, such as gene expression across tissues, have shown that disease genes are more likely to be selectively expressed in affected tissues (6–10), and this tissue-level information can be used to form testable hypotheses about the mechanisms by which the genes act. Furthermore, knowledge of which genes are more specifically expressed by a tissue, and which traits are caused by genes that are specifically expressed in a given tissue, can provide insight to the physiology of poorly understood traits and diseases as well as elucidate new and interesting relationships between our traits and our anatomy. Here, we present the Tissue Specific Expression Analysis (TSEA), a flexible statistical framework that incorporates tissue expression across the human adult body. The framework has two parts – the first is an algorithm to define sets of genes with enriched or specific expression in each tissue, and the second is a tool to identify and display significant overlaps between tissue-enriched gene sets and lists of candidate genes from any source (e.g. disease/trait associated genes).
The TSEA allows us to expand upon work done to test the hypothesis that genes associated with diseases are more likely to be highly expressed in the affected tissues (from here on referred to as the selective expression hypothesis). Previous work examining this hypothesis has included text-mining strategies that show the average expression of genes associated with a disease is higher in the tissue that is most highly correlated to the disease compared to lower-ranked tissue-disease correlations (9). This strategy provides support for the selective expression hypothesis, but relies heavily on well-curated and well-studied genes and disorders. A recent tool, geneTIER (6) assumes that disease genes are more highly expressed in an affected tissue to prioritize genes for follow-up studies. To test their assumption, the authors compare the distribution of gene expression of disease genes in affected and unaffected tissues and show that gene expression in unaffected tissues is significantly lower than in affected tissues. Similar to (9), they provide statistical support for the selective expression hypothesis, but do not quantify the number of diseases to which this hypothesis applies, and the tool requires an assumption about the affection status of tissues (6). Finally, the hypothesis has also been assessed using mouse expression and phenotype data. Oellrich et al. show that they are able to highlight a specific tissue for a phenotype based on tissue specific gene expression 72–76% of the time, but provide no statistical assessment of this result (8). Yet, despite the mounting evidence that is consistent with the selective expression hypothesis, there are examples of diseases caused by ubiquitously expressed genes. For example, Amyotrophic Lateral Sclerosis, a disease that leads to the degeneration of motor neurons, can be caused by mutations in SOD1, a mitochondrial gene expressed in every cell in the body (11). In contrast mutations of the HCRT gene (12), expressed only within a small number of hypothalamic neurons in the brain, causes the disorder narcolepsy – a phenotype that can be recapitulated by experimentally ablating these same neurons. Thus, since exemplars exist at both extremes, it is unclear to what extent the selective expression hypothesis might apply across a variety of trait and gene combinations.
Building upon the prior work in this area, the framework of the TSEA allows us to now extend testing of this hypothesis to include human complex quantitative traits, provide statistical evidence, and estimate the number of phenotypes, to which this hypothesis might apply. The method assigns diseases/traits to tissues by using the Fisher's Exact test to identify significant overlaps between genes in associated loci for diseases/traits and tissue-specific gene sets. First, we use our previously published pSI statistic to define tissue-enriched gene sets using publicly available RNA-seq data across the healthy, adult human body (13). We validate our tissue-enriched gene sets, and the ability of Fisher's exact test to detect meaningful relationships between gene sets and tissues, by using a set of GO-terms as positive controls. Then, to test the selective expression hypothesis, we derive disease/trait-associated gene lists for 98 diseases/traits from the GWAS catalog (14) and quantify the number of the diseases/traits demonstrating a significant relationship to a tissue (57/98). We then test if this is greater than the number one would expect by chance.
In addition, we show that our tool can provide biological insights for future experiments. Our tool identified a relationship between human skin gene expression and the hematological trait of white blood cell count – a trait most would assume is mediated primarily by genes expressed in the blood. This finding suggested that skin integrity is a major modifier of white blood cell count in humans. This hypothesis is inline with previous work in mice showing skin-specific disruption of notch signaling or stratum corneum formation can alter lymphoblast (15) and granulocyte (16) proliferation. We further test this hypothesis in the mouse, where we show that white blood cell count is strongly predicted by inside-out skin barrier function across a range of genetic mutations in distinct molecular pathways. This functional analysis shows the utility of our method in helping to rapidly identify the relevant tissues and highlight perhaps unexpected anatomical relationships for particular traits from human genetic data. Finally, to demonstrate that our approach can be broadly useful for interpreting gene lists derived from data sources beyond GWAS, we show that human genes under purifying selection are disproportionately expressed in nervous system tissues.
MATERIALS AND METHODS
GTEx dataset
The gene expression data used is the previously normalized set of RNA-Seq data downloaded from the GTEx project (GTEx Analysis 1/31/13 data release, summarized to genes) (17). This GTEx dataset is comprised of 1,839 samples derived from 189 post-mortem subjects (18). The 1/31/13 release included samples from 45 different tissues, with some tissues offering multiple ‘sub-tissue’ types (i.e. multiple brain dissections). To clearly analyze the data at the tissue level, RPKM values for the sub-tissue types were averaged resulting in 25 ‘whole-tissue’ types (per Supplemental Tables S1 and S2). The average number of distinct human samples per sub-tissue type was 36.9 samples and the tissue-level aggregation of the data yielded an average of 66.4 samples per tissue, and all but two had n>6. Thus, the transcripts detected as enriched in each tissue here should be fairly representative of the population, with the possible exceptions of the kidneys (n = 3), and fallopian tubes (n = 1), which should be regarded more tenuously. To prepare the already normalized data for input to the pSI algorithm, biological replicates were averaged and genes were filtered to include well-annotated protein-coding genes designated by RefSeq (release 60) gene annotations. After filtering, 18,056 transcripts remained.
To summarize the variance of sample expression across tissue types, the multivariate total sum of squares (TSS) was calculated as the sum of squared Euclidian distances of individual expression profiles to the average expression across all samples (i.e. centroid of the expression profiles). The within group sum of squares (WSS) was calculated as the sum of squared distances of expression profiles to the corresponding within group average of expressions. The within group variance component was calculated as WSS/TSS. The statistical significance of this measure was estimated by permutation (Supplementary Figure S1).
TSEA:pSI values, tissue-enriched gene sets, and enrichment analysis for traits
Using the pSI R package function specificity.index (19,20), the RPKM values for each transcript were used to calculate a pSI value for that transcript in each of the tissues. pSI values were calculated for all detectably expressed (>0.3 RPKM, as per (21)) protein coding transcripts. Briefly, the pSI is calculated as follows. First, a specificity index value SI is calculated for gene i in tissue t by the following equation adapted from (22)
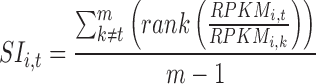 |
(1) |
where k are the other tissues available and m is the total number of tissues. RPKMi,t is the expression value of gene i in tissue t,  is the fold change of expression of gene i in tissue t compared to the expression of gene i in tissue k. This fold change is calculated for each gene and then ordered by descending fold change. The average rank of gene i when comparing tissue t to all other tissues is the SI value for gene i in tissue t (Supplementary Figure S2). The SI value for a gene in a tissue contains information about the magnitude of the expression of the gene in a given tissue compared to its expression in all other tissues and normalizes the distribution of fold change values of genes within a tissue. However, raw SIs are not readily comparable across tissues, as different tissues have different total numbers of genes with measurable expression (>0.3 RPKM). A p-value is assigned to each SI value, resulting in a pSI, for each gene in each tissue, allowing for a sliding window view of tissue specificity and a readily comparable value across tissues. To calculate pSI, for each tissue we constructed an empirical null distribution of SI values by repeatedly shuffling RPKM values of genes within the tissue of interest and calculating new SI values. We then compared our observed SI value for each gene in a tissue with the null distribution of SI values for that tissue. To limit computations, we first find the SI value that will produce a pSI of less than or equal to 0.1 and only calculate pSI for genes with SI values greater than this. Thus a pSI for gene i in tissue t, is the Pr (SIi,t| Data of tissue t). Supplemental Table S3 contains the pSI values used in this paper.
We use the pSI values as a guide to determine which genes are specifically enriched in a given tissue. We utilize different threshold pSI values to generate tissue-enriched gene sets with varying stringencies. Throughout the paper we use thresholds (pSI <0.05, <0.01, <0.001, <0.0001). Choosing ways to partition genes into tissue specific categories has not been rigorously defined and requires some arbitrary definitions of how to bin genes into tissues (8,10,23,24). We chose to use the pSI values because they incorporate information about how likely the enrichment of a gene in a tissue is, and it is tailored for each tissue such that more unique tissues will have a larger number of genes reaching a particular pSI threshold. For additional discussion and empirical validation of this approach see (20,22).
As an independent method of generating tissue specific gene lists, we calculated the Shannon entropy as described in (23) and used the permutation method that is implemented in the specificity.index function to assign p-values to the Shannon entropy measures. Briefly, the Shannon entropy is calculated by first defining the relative expression of a gene i in tissue t. This is the proportion of expression of a gene in a specific tissue compared to the gene's expression in all tissues
 |
(2) |
The entropy for a gene i is
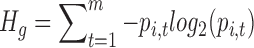 |
(3) |
Hg is a measure of how broadly a gene is expressed (e.g. a value of zero corresponds to expression in a single tissue). To determine how specifically a gene is expressed in a tissue we calculate Qi,t
 |
(4) |
Equations (2) through (4) are adapted from (23). In our implementation of the method we restricted Q to be between zero and one as opposed to zero and positive infinity. A Q value close to zero means that the gene is specifically expressed (i.e. highly expressed in a few tissues including the tissue t of interest). We ranked the Q values for each gene within the tissues and assigned p-values in the same way for the SI values. The SI values and entropy values for all genes within tissues are highly correlated (average Spearman correlation across tissues is 0.96)(Supplementary Figure S3). Since low values of Q indicate specificity and high values of SI indicate specificity, the correlation coefficients have been multiplied by negative one.
To analyze the enrichment of a candidate gene list in tissues, we calculate the significance of the overlap between the candidate gene list and the transcripts enriched in each tissue using the Fisher's Exact test. P-values are further adjusted using a Benjamini–Hochberg (B–H) correction across tissues to account for multiple comparisons. This is done using the fisher.iteration function in the pSI R package.
RPKM heatmaps
To evaluate the expression of genes specific to tissues at various thresholds, the RPKM values for those genes were visualized using the R package gplots. At each pSI threshold (0.05, 0.01, 0.001, 0.0001), the union of all tissue-specific genes was taken and their respective log-transformed RPKM values were plotted as heatmaps. For visualization, samples were hierarchically clustered at the least stringent pSI threshold (0.05) and the resulting order was kept for all figures. To prevent infinite values after log-transformation, genes with RPKM values equal to zero had a constant of 1E−5 added. Similarly, the overlap of the gene list for each tissue at various thresholds was plotted as a heatmap and hierarchically clustered to observe the amount of list-wise sharing between tissue specific gene lists (Supplementary Figure S2).
Validation of TSEA tool with gene ontology (GO)
For every tissue in GTEx, we identified a GO term associated with the development of that tissue. All human genes associated with that term were downloaded and subjected to TSEA. ‘On Target’ hits were defined as a significant enrichment in the appropriate tissue. For comparison, random lists of genes, consisting of the same number of genes as those for each GO term, were also selected and analyzed by TSEA.
Candidate gene lists
The GWAS catalog is a curated dataset of GWA studies with the variants and genes that were reported associated with 940 traits and diseases (14). We only used traits that had more than 30 associated genes; n = 98 traits passed this filter. To avoid any bias using the author reported genes, we also performed the TSEA analysis using genes the SNPs mapped to based on proximity, determined by NHGRI staff (n = 87 traits). There are n = 75 traits that had greater than 30 genes using either the author reported genes or the NHGRI mapped genes. When SNPs were reported as intergenic, we used the closest of either the up or downstream genes. Previous modeling work indicated that >30 genes provides sufficient power to detect enrichment in these analyses (20). The exome gene lists are described previously (25,26). The top 1003 constrained genes are described in (25).
Testing the selective expression hypothesis
We first characterized the distribution of results from the true candidate gene lists for each of the 98 GWAS traits to the transcript-enriched list of each tissue from the Fisher's Exact test, implemented in the fisher.iteration function in the pSI R package (20). Significant P-values after B–H correction indicate an overrepresentation of a trait's candidate gene list in at least one tissue's transcript-enriched list. We compared the number of real traits that had at least one tissue identified by TSEA, to an empirically derived null distribution of the same number of ‘traits’ that had at least one tissue identified, by using 1000 sets of random gene-lists size-matched for each GWAS trait (98 000 iterations total). This analysis was repeated using 87 GWAS traits and their mapped genes provided by NHGRI.
Ethics statement
All procedures using mice were approved by the Washington University School of Medicine Animal Studies Committee and were performed in accordance with the Animal Welfare Act and the NIH Guide for the Care and Use of Laboratory Animals.
Skin integrity mouse model
The mice were housed in a pathogen-free barrier facility, with a 12 h:12 h light dark cycle and ad libitim access to standard laboratory chow and water. Msx2-Cre/+; RBP-jf/f (RBPj cKO) (15) and Lamc2−/−(27); K14-rtTA; TetO-LamC2+ (Lamc2 rKO) mice have been described previously and were maintained on mixed genetic backgrounds. To generate Msx2-Cre/+; Ikk2f/f (Ikk2 cKO) mice, Msx2-Cre/+ transgenic mice (28,29) were bred with Ikk2f/f mice (30), and the offspring were intercrossed. Doxycycline (dox; 1 mg/ml) was provided in the drinking water of Lamc2 rKO mice from conception until 8 weeks old, and then omitted from their drinking water for 6 weeks prior to transepidermal water loss (TEWL) and white blood cell (WBC) measurements. RBPj cKO and Ikk2 cKO mice were examined at 3 weeks of age.
TEWL, a marker of epidermal skin barrier function, was measured using a VapoMeter (Delfin Technologies) directly on the RBPj cKO and Ikk2 cKO mice, as these mice exhibit hair loss in the dorsal midline region. Hair was removed from Lamc2 rKO mice using Nair depilatory cream 24 h prior to examination. Blood samples were collected and the WBC counts were measured using the Hemavet 950 analyzer (Drew Scientific). These studies were performed using separate groups of mice at least three independent times.
RESULTS
Identification of transcripts enriched in each tissue
As a source of data to identify selectively expressed and enriched transcripts across tissues, we leveraged a publically available analysis of the GTEx RNAseq data. The GTEx project has assessed the expression of 18,056 protein-coding genes across 45 tissue types. Some of these tissues are different dissections of a larger tissue (e.g. the substantia nigra and frontal cortex are regions of the brain). Still other tissue samples come from different anatomical branches of a larger tissue system (e.g. both aorta and capillaries are blood vessels). We used all available data to summarize gene expression in each tissue to a single mean measurement across all individuals to provide a reasonable estimate of the normal expression of this gene in each tissue across the population. This is justified because variation in gene expression is driven primarily by differences between tissues rather than between individuals who donated tissue samples (Supplementary Figure S1).
We next used the pSI algorithm, previously developed for identifying transcripts enriched in particular cell types in the brain (19) to identify transcripts enriched in each tissue (Supplementary Figure S2). In brief, the expression of a gene in a specific tissue is compared to its expression in every other tissue, generating a ‘fold change’ of expression of the gene for each specific comparison. The SI value for a gene in a tissue is the average rank of that gene's fold change of expression across all comparisons. The SI value for a gene in a tissue is assigned a P-value (pSI) by permutation. Calculating the SI value and using the rank allows us to order the genes from the most highly enriched in a particular tissue to more ubiquitous, and by calculating pSI for genes we can choose consistent thresholds across tissues for identifying which genes to include in a tissue-specific list; using more stringent thresholds will limit downstream analyses to more specifically expressed genes (Supplementary Figure S2). As there is no a priori way to define the appropriate threshold, here we varied this parameter systematically and used four pSI thresholds (0.05, 0.01, 0.001, 0.0001). The pSI algorithm performed as expected as more stringent thresholds produced smaller yet more specific gene lists, as illustrated with a heatmap for counts of the genes that are shared between each pairwise tissue comparison (Supplementary Figure S2).
Though the pSI algorithm is relatively robust to minor changes in the sample composition of the inputted gene expression dataset (20) we were concerned that including multiple sub-tissue dissections may slightly detract from our ability to identify tissue-enriched genes more broadly. Therefore we focused on a ‘whole-tissue’ version of the analysis where all brain dissections (and similar sub-dissections of other organs) were averaged to a single measure prior to calculation of pSI. This served to slightly increase the number of genes detected as enriched in the whole-tissues at a given pSI threshold and simplified future interpretation to only 25 tissues for the remainder of the analyses. Consistent with earlier reports using microarray data from a smaller number of tissues (21) by far the most unique tissue in either analysis was the testis, with 560 highly enriched (pSI < 0.0001) transcripts, with the second most unique tissue being the brain (193 transcripts at the same threshold).
At less stringent thresholds, overall there were 6,922 transcripts detected as modestly enriched (pSI < 0.01) in any tissue, with high expression in one tissue and some expression in related tissues (Figure 1A). For example, the brain, the adrenal gland, and the pituitary all release synaptic vesicles full of chemical transmitters, and all share in their enrichment for a number of transcripts related to this process (e.g. CPLX2: brain pSI < 1E–6, adrenal gland: pSI < 0.02; pituitary: pSI < 0.002). On average, a transcript showing a pSI < 0.01 in at least one tissue might also show a modest enrichment (pSI < 0.1) in 2.6 other tissues (±1.6 SD). Using a more stringent threshold (pSI < 0.0001) identifies a smaller number of transcripts in all (1,301 across all tissues), but much more likely to have specific expression in a single tissue (Figure 1B and Supplementary Figure S2). 564 of these highly tissue enriched transcripts do not even show a trend (pSI < 0.1) towards enrichment in any other tissue. These transcripts with highly enriched expression in one tissue include clear examples known to be essential to the functioning of particular tissues (e.g. Figure 1C). This result is supported by using the DAVID tool (3); the 501 genes with pSI < 0.001 in brain are massively enriched for a large number of biological process terms related to the functioning of the nervous system (e.g. Synaptic Transmission, P-value < 2.6E−56, B–H corrected; Neurological Systems Process, P-value < 2.4E−33), while the 1,132 genes with pSI < 0.001 from the testis are enriched for the GO terms Sexual Reproduction (P-value < 1E−64), or Spermatogenesis (P-value < 1E−56).
Figure 1.

The pSI algorithm can be used to identify transcripts enriched in each tissue. (A) Clustering of genes modestly enriched (pSI < 0.01) in any tissue, reveals some tissues are more unique (e.g. testis, blood, brain), though some transcripts are found across tissues with related functions. (B) Transcripts identified as highly enriched (pSI < 0.0001) by pSI clearly show high expression in fewer tissues. (C) Examples of annotated genes identified by pSI as highly enriched in the brain include many known neuronal genes. (D) Examples of unannotated genes that also show specificity and enrichment of brain expression.
We view the tissue-enriched gene sets generated here as potentially a complementary resource to the curated gene annotation resources such as GO. Note that relative to GO, our analysis also provides information for poorly annotated and largely unstudied transcripts (Figure 1D), which won't be represented in the GO databases (988 out of 18,056 genes (5.47%) do not have an associated GO term). For these, a variation of ‘guilt-by-association’ logic (guilt-by-expression) would suggest that they might also be important for the particular tissue in which they are enriched. To facilitate future investigations of these transcripts from any tissue, we provide a matrix of pSI values for all tissues and genes as Supplemental Table S3.
Development and validation of a tissue specific enrichment analysis tool (TSEA)
We next developed a tool to perform an enrichment analysis using the tissue specific expression information. The purpose of this tool is to identify whether a set of ‘candidate genes’ for a trait of interest are disproportionately transcribed in a particular tissue. This is meant to be analogous to existing tools for identifying overabundances of particular GO or KEGG terms in gene lists (2,3,31,32), and implements a similar statistical framework: Fisher's Exact test (33) coupled with B–H multiple testing correction (34). A similar hypergeometric distribution was used to detect overlap between gene sets and tissue specific lists in the mouse (8). However, there are two unique properties of our TSEA with respect to GO enrichment. First, unlike GO terms, expression data is not built upon manual curation – thus even poorly annotated and unstudied genes, such as those in Figure 1D, have the opportunity to contribute signal to a TSEA analysis. Second, the pSI statistic provides for a nuanced definition of ‘tissue-specific’ or ‘tissue-enriched’ transcripts. This is important because, while we are testing for an enrichment, a priori there is no clear expectation of exactly how uniquely disease genes ought to be expressed in the tissue of interest. For example, mutations in the cystic fibrosis transmembrane conductance regulator gene CFTR, cause cystic fibrosis, which affects many different tissues including the lungs, pancreas, and kidney. Though not widely expressed, setting too stringent an expression threshold might exclude this gene from one or the other relevant tissue specific lists (pSI kidney = 0.042, lung = 0.027, pancreas = 0.0011, colon = 0.003). Thus, currently the tool is set up to vary pSI systematically and report Fisher's exact test results at multiple pSI thresholds. Graphically, these results are displayed as a set of concentric hexagons for each tissue, with each smaller hexagon representing a more stringent pSI threshold. The size of the hexagon is scaled to the number of genes meeting the pSI threshold, and its color indicates results of the Fisher's exact test (Figure 2). For example, we can query the tool with the 14 genes annotated by GO as functioning in Renal Water Homeostasis (GO:0003091), or the 66 genes associated with T Cell Activation (GO:0002286), and rapidly identify that these genes are enriched in the Kidney (Figure 3A) and Blood (Figure 3B), respectively. Note that GO Immune-related terms often map via TSEA to the blood and the lung, both tissues in which lymphoblasts are expected to contribute a substantial portion of the mRNA.
Figure 2.

Interpretation of TSEA plots. (A) The dendrogram skeleton depicts an approximation of a hierarchical clustering of the tissues based on gene expression. (B) The outer white hexagon's size is proportional to the number of transcripts enriched in a particular tissue at the least stringent threshold of pSI <0.05. (C) The size of the gray concentric hexagons is proportional to the number of transcripts enriched in a particular tissue at the more stringent threshold (0.001, 0.001, 0.0001 from outermost to innermost). (D) A heatmap color scheme is added ot the appropriate hexagon to depict the significance of the Fisher's Exact test. Note, any significance in the outermost hexagon is hashed to reflect that the transcript lists at this threshold are less specific. The results shown here highlight the enriched expression of the 69 genes associated with the GO term ‘Glycogen Metabolic Process’ in multiple relevant tissues.
Figure 3.

Tissue-specific expression analysis (TSEA) correctly identifies tissues related to known biological processes. (A) TSEA using the Gene Ontology (GO) term ‘Renal Water Homeostasis’ as the candidate list indicates that these transcripts have enriched expression in the kidney. (B) TSEA for GO term ‘T cell activation involved in immune response’ reveals enrichment for these transcripts in the blood and the lungs, tissues with a substantial proportion of lymphoblasts. (C) Across TSEA for GO terms for the development of each tissue, 20/25 GO term gene lists were correctly ascribed to the relevant tissue by TSEA (orange dots, P-values in –log10 scale), while 0/25 same-sized random lists of genes identified any tissue by TSEA at any pSI threshold (blue dots). Horizontal dotted line represents –log10(0.05).
To more thoroughly validate both the functioning of the tool and the pSI statistic, we conducted a systematic analysis of gene lists derived from the GO resource. As GO does not currently include expression information, or a broad term for the genes used in the functioning of a particular tissue in the adult, our best choice as a ‘positive control’ gene list for each tissue was the set of genes annotated as being involved in the development of that particular tissue. For example, GO term 0060537, Muscle Development, is associated with 320 human genes. Though the GTEx data is based on adult tissue, a large subset of these genes is clearly still expressed after development: there are robust statistical signals by TSEA in the muscle at all pSI thresholds (B–H corrected Fishers Exact test P-values of <0.0005 to 10E−21). Across GO terms for all tissues the relevant tissue was correctly identified by TSEA in at least one pSI threshold in 20 out of 25 tissues. The remaining tissues each had fewer than 30 genes associated with their GO terms (Supplemental Table S4). Compared to this, 0 out of 25 random lists of genes identified any tissue by TSEA at any threshold (Figure 3C). Thus, via the adult GTEx expression information alone, the TSEA tool can accurately identify tissues from a list of genes relevant to their development. This test validates both the functioning of the tool and the quality of the pSI derived lists of tissue specific genes, and indicates the overall approach (generating tissue enriched gene sets with pSI and Fisher's Exact testing for gene set enrichment) performs well in identifying in which tissue a candidate gene set is overrepresented based on its expression. Nonetheless, to make sure our gene lists were robust to how we define tissue specificity we also tested a second method, a variation of Shannon entropy (23). Overall, the SI and entropy values for gene expression within a tissue are highly correlated (Supplementary Figure S3). However, the transcript lists determined by the Shannon entropy are smaller subsets of the transcript lists produced by the pSI method at the same threshold, so we utilized the pSI for the remaining analyses.
Test of the selective expression hypothesis
To test the selective expression hypothesis on traits influenced by common variants, we applied TSEA to every trait in the publicly available GWAS catalog with a reasonable number of genes reported by the authors of the study (>30 genes). Using these 98 ‘candidate gene’ lists, the results from the TSEA are consistent with the known biology for many of the complex and disease associated traits (Figures 4 and 5). Genes associated with metabolic traits map to their tissues of origin. For example, urate-level (35–43) associated genes map to the kidney and bilirubin, a blood metabolite indicative of liver function, maps to the liver (Figure 4A and B). Similarly physical traits, such as heart rate (44–50), map to the responsible tissue (Figure 4C). Furthermore, in agreement with the recent observation that obesity genes include many genes with high transcription in the brain (51), we see clear enrichment of expression in the brain for genes controlling BMI (52,53) (Figure 4D). This relationship between the brain and BMI is also seen in the mouse (8). Most autoimmune diseases, such as inflammatory bowel disease (54–59), and rheumatoid arthritis (60–72) map strongly to tissues containing a high proportion of immune cells (blood and lungs, Figure 5A and B), with some occasional signal in the tissue targeted by auto-immune attack. Chronic kidney disease shows signal in the kidney as well as the thyroid, liver, and prostate, highlighting the affected tissue as well as possibly deranged tissues affecting the pathogenesis of the disease (Figure 5C). Finally, genes associated with cognitive decline in Alzheimer's disease (73) are disproportionately expressed in the brain (Figure 5D), as are other genes associated with psychiatric disease and cognitive function (Movie S1). TSEA results for any significant trait across the 98 candidate gene lists are shown sequentially in Movie S1.
Figure 4.

Tissue specific expression analysis identifies tissues associated with human complex traits. (A) Genes associated with urate acid levels are disproportionately transcribed in the kidney, with signal in the liver as well. (B) Genes associated with Bilirubin levels are disproportionately enriched in the liver. (C) Genes regulating heart rate are disproportionately enriched in the heart. (D) Genes regulating body mass index are disproportionately transcribed in the brain, with some suggestive signal in the pituitary.
Figure 5.

Tissue-specific expression analysis identifies tissues associated with human disease traits. (A) Autoimmune diseases, such as IBD, show enrichment for transcripts found in blood and lung. There is also suggestive signal in stomach. (B) Rheumatoid arthritis shows an overrepresentation of transcripts expressed in the blood and lung. (C) Genes associated with chronic kidney disease show signal in the kidney, thryoid, prostate, and liver. (D) Genes associated with cognitive decline in Alzheimer's are disproportionately transcribed in the brain.
Overall, our analyses identified significant overlap between candidate gene lists and transcript-enriched lists for a tissue for 57 out of the 98 traits, providing general support for the selective expression hypothesis across a large number of traits. Out of the 57 traits that were able to be mapped to a tissue, 36 were mapped to more than one tissue. The tissues that were found significant for each trait are often consistent with the known biology of the trait.
To determine if the TSEA method is detecting a larger number of tissue specific relationships than expected by chance (a prediction of the selective expression hypothesis), we repeated the TSEA analysis on 98 more ‘traits’ with randomly constructed candidate gene lists and repeated the process 1,000 times. The distribution in Figure 6A shows the number of randomly constructed ‘traits’ with a significant overlap with at least one tissue. The maximum number of significant hits from the thousand random trials is 21 out of 98 traits for the whole-tissue dataset (median: 8/98). Therefore the ‘true’ set of 57/98 GWAS traits are mapping to specific tissues far more than expected by chance (P-value < 0.001). Furthermore, we compared the distribution of the –log10(P-values) from the randomly constructed ‘traits’ and the true GWAS traits (Figure 6B). The –log10(P-values) generated by the random gene lists have a small range (min = 1.30, max = 5.55, median = 1.58) and tend toward lesser significance. In contrast, the GWAS candidate gene lists produce -log10(p-values) that have a wider range (min = 1, max = 27.07, median = 2.57) and a longer tail towards greater significance. A Wilcoxon Rank Sum test supports that the two distributions are different (P < 2.2E–16). Similar results are seen when using the sub-tissue dataset (data not shown). These results are consistent with the hypothesis, across a diverse range of phenotypes, that trait-associated genes have enriched expression in particular tissues.
Figure 6.

Randomization testing is consistent with the selective expression hypothesis. (A) Of the 98 quantitative and disease trait associated gene lists examined, 57 (red line), showed enrichment in at least one tissue. One thousand randomizations of 98 equivalently sized random gene lists resulted in a mean of 8.81 (±3.53 SD) gene lists showing enrichment (blue distribution). (B) Median statistical enrichment of those random gene lists showing signal was P-value = 0.026 (1.58 as plotted in –log10 scale, blue distribution, range: 0.05 to 2.83E–6), while those from disease and trait associated lists was P-value = 0.0027 (2.57, pink distribution, range: 0.05 to 8.50E–28).
To confirm this key result was not a consequence of the manner in which we summarized either the expression data or the GWAS results, we tested the robustness of our analysis to different input parameters. First, we were concerned that when a region containing multiple genes was implicated, it is possible that the authors may have been biased in reporting the genes that seemed most plausible to them (i.e. known to be expressed in the relevant tissue). Thus, to avoid this bias we repeated the analysis using the gene-to-SNP mapping reported by the NHGRI staff. These mapped genes include the gene in which the SNP is located. If a SNP is intergenic the upstream and downstream genes are reported; the closer gene was used in the analysis. We repeated the analysis with the 87 traits with >30 genes when using the genes reported by the NHGRI opposed to the author reported genes. Using theses candidate gene lists, we found that there was significant overlap between the candidate gene list and a tissue for 54/87 traits, again a result highly unlikely by chance (Supplementary Figure S4). Overall, there were 75 traits in common between the 87 traits that have >30 genes when using the NGHRI-mapped genes and the 98 traits that have >30 genes when using the author reported genes. Out of these 75, 64 traits (84%) were mapped to the same tissue regardless of how the candidate gene lists was defined, either author-mapped or NHGRI-mapped. The 11 remaining traits typically showed enrichment in a tissue using one mapping strategy but no evidence of overlap with the other mapping strategy, suggesting that the discrepancies were mostly due to false-negatives. Furthermore, out of the 23 traits that only have greater than 30 reported genes when using one mapping strategy but less than 30 in the other, we still see 74% concordance suggesting smaller gene lists can also yield consistent signals. Neither mapping was systematically more sensitive than the other, suggesting author bias contributed little to the signal in the first analysis. Second, we confirmed that our results were not strongly biased by the choice of descriptive statistic used for summarizing the expression data. Thus, we also used the median RPKM value of biological replicates as opposed to the mean to make sure that outliers were not artificially inflating expression values of genes, making some genes seem more specifically expressed. When the median is used, 82 out of the 98 (83%) traits highlight similar tissues, and only three were discordant. The remaining 13 showed signal with either one summary statistic, or the other, as above suggesting neither approach was systematically more sensitive. Finally, we repeated the analysis also using the sub tissue data to confirm that we were not limiting our ability to detect overlaps by averaging across anatomically similar tissues. The results were again highly concordant (71%). Overall, all analyses supported the primary conclusion that trait-associated genes have enriched expression in particular tissues, but also suggested that different ways of summarizing data and defining candidate gene lists can capture slightly different relationships, just as running the same gene list through slightly different implementations of GO-based analyses usually highlights similar, but not identical, pathways across tools.
Also, note that the challenge of attributing a SNP to a gene is not unique to our work and presents an ongoing problem for all common variant studies. It is a testimony to the robustness of both our method and the finding that the selective expression holds in spite of an unknown level of SNP-to-gene mismapping in the NHGRI summary catalog. This further suggests that our approach may be even more robust and sensitive when applied to contexts where the causative gene is more clear – e.g. exome sequencing studies of de novo mutation or sets of genes discovered from mendelian disorders. Indeed, TSEA results for several traits using highly penetrant genes identified using these rare variant methods (Supplementary Figure S5) identified clear signal in the relevant tissue: genes that had multiple de novo mutations identified in children with autism or epilepsy have signal in the brain (26,74). Thus, our approach is readily applicable to results from rare variant analyses as well. To further show that our method is agnostic to how the candidate gene sets are determined we make use of a list of 1003 genes that have been identified as highly constrained (25). These genes are constrained in the sense that they harbor fewer nonsynonymous mutations than expected. The TSEA highlights that there is an overrepresentation of genes that are expressed in the brain, nerves, and the pituitary (Figure 7). A result that is consistent with (10).
Figure 7.

Constrained genes are expressed in the brain, nerve and pituitary. The top 1003 constrained genes as identified by (23) show an over representation of genes expressed in the brain, pituitary and nerve.
TSEA indicates skin-expressed loci are key regulators of white blood cell count
We next sought to test whether this now-established relationship between anatomical expression and disease risk might be used to provide insight into the tissues that actually mediate complex traits. One initially unexpected TSEA result was that genes associated with the quantitative trait white blood cell count (WBC) are enriched in the set of transcripts that are found highly expressed in the skin, rather than transcripts from the blood, where the WBC are themselves most abundant (Figure 8A, Table 1). This human finding joins others from model organisms suggesting that there may be an important pleiotropic relationship between the genetic factors contributing to skin integrity and the regulation of this hemopoeitic trait. The first evidence for this relationship was reported in mice with an allelic series of skin specific knockouts in the Notch pathway or the fatty acid transporter gene Slc27a4/Fatp4 (15), which led the authors to suggest that a barrier defect resulted in increased thymic stromal lymphopoietin (TSLP) protein, which drove WBC. The increase in TSLP and WBC was proportional to the macroscopic assessment of the severity of the skin lesions produced by the different loss of function (LOF) alleles. However, a direct measurement of barrier function, such as transepidermal water loss (TEWL), and its correlation to WBC has not been reported. This leaves open the possibility that the previous WBC increase seen in Notch mutants was caused directly by failed skin differentiation, rather than barrier dysfunction specifically.
Figure 8.

TSEA can identify novel relationships between candidate genes and tissues. (A) Genes found to be associated with white blood cell count are disproportionately transcribed in the skin. (B) Wild type control mouse, Ikk2 cKO mouse, and Rbpj cKO mouse (from left to right). (C) White blood cell count (103cells/ml) as a function of TEWL (g/m2 h) in control mice (n = 26), Rbpj cKO mice (n = 20), Ikk2 cKO mice (n = 14), and double cKO Rbpj/Ikk2 mice (n = 3). (D) Wild type control mouse, Lamc2 rKO mouse on Dox, and Lamc2 rKO mouse off dox. (E) White blood cell count as a function of TEWL in control mice (n = 8), Lamc2 rKO mice on dox (n = 9), Lamc2 rKO mice off dox (n = 7).
Table 1. Genes associated with ‘White blood cell count’ as listed in the GWAS catalog. Bold and underlined genes have pSI < 0.05 in the skin.
| PUBMEDID | Region | Reported genes* | Mapped genesa |
|---|---|---|---|
| 20139978 | 1q23.2 | DARC | DARC |
| 20139978 | 1q23.2 | DARC | DARC |
| 20139978 | 7q21.2 | CDK6 | CDK6 |
| 20139978 | NR | CDSN, PSORS1C1 | CDSN; PSORS1C1 |
| 20139978 | 6q23.3 | HBS1L, MYB | HBS1L - MYB |
| 21738479 | 6p21.33 | MUC21, HCG22, C6orf15, CDSN, PSORS1C1, PSORS1C2, CCHCR1 | HCG22 - C6orf15 |
| 21738479 | 17q21.1 | GSDMA, PSMD3, CSF3, MED24 | PSMD3 |
| 21738480 | 3q21.3 | LOC90246, C3orf27, RPN1 | C3orf27 - RPN1 |
| 21738480 | 6p21.33 | PSORS1C3, HCG27, HLA-C, HLA-B | HCG27 - USP8P1 |
| 21738480 | 19p13.11 | C19orf44, EPS15L1, CALR3 | EPS15L1 |
| 21738480 | 8q24.21 | MLZE, FAM49B | MIR3686 - GSDMC |
| 21738480 | 9q31.3 | EDG2, OR2K2 | RNY4P18 - MIR7702 |
| 21738480 | 17q21.1 | GSDMB, ORMDL3, GSDMA, PSMD3, CSF3, MED24, SNORD124, THRA, NR1D1 | PSMD3 - CSF3 |
| 21738480 | 17q21.1 | CSF3, PSMD3, GSDM1, MED24, GSDMB, ORMDL3, GSDMA, SNORD124, THRA, NR1D1 | PSMD3 - CSF3 |
| 21738480 | 4q13.3 | CXCL2 | CXCL2 - MTHFD2L |
| 21738480 | 12q15 | RAP1B, NUP107, SLC35E3 | RPSAP12 - RPL10P12 |
| 21738480 | 7q21.2 | CDK6 | CDK6 |
| 22037903 | 17q21.1 | GSDMA | GSDMA |
| 22037903 | 2q31.3 | ITGA4, CERKL | MIR4437 - ITGA4 |
| 22037903 | 3q21.3 | GATA2, LOC90246, C3orf27, RPN1 | C3orf27 - RPN1 |
*Genes identified more than once were only counted once.
aMapped genes as reported by NHGRI. If SNP is intergenic the upstream and downstream genes are separated by a hyphen. The closer gene was considered in the analysis.
NR indicates ‘not reported’.
We set out to distinguish these possibilities by measuring TEWL, a quantitative measure of skin integrity. In addition, the candidate gene list for human WBC we culled from the GWAS catalog did not include the Notch gene family nor TSLP gene, and the TSEA analysis suggested that the relationship between skin expressed genes and WBC exists across many different molecular genetic pathways impacting the skin barrier. Thus, we tested three lines of mutant mice with genetic lesions including two in distinct, Notch-independent pathways. These included conditional knockouts of the gene Rbpj (75), a signal mediator in the Notch pathway previously included in our morphological study (15), and Ikk2, a regulator of NF-κB signaling (28). Because these pathways are unrelated, we could separate their common impact on the barrier from their specific pathway-related biology. For each of these genes, we used a Cre-Lox deletion strategy to remove the gene only in keratinocytes located along the dorsal and ventral midline (Msx2-Cre (15)), leaving the genes intact within all other tissues including the immune system. As reported, these mutant mice display clear dermatological abnormalities with the Rbpj cKOs having a more severe phenotype than the Ikk2 cKOs (Figure 8B). In all mice we quantitatively evaluated the integrity of the skin barrier by taking TEWL measurements (inside-out barrier function). In parallel we collected blood and determined the WBC count. In all mice we observed a strong correlation between WBC and the integrity of the inside-out skin barrier (Figure 8C, r2 = 0.9006). In addition, as Ikk2 mutants are thought to have impaired sensing of outside-in barrier function, the results with these mice suggest that pathogen infiltration (outside-in) barrier function may not be necessary to trigger elevated WBC.
We also tested the quantitative relationship between barrier integrity and WBC using a milder model of skin disruption. Junctional epidermolysis bullosa (JEB) is a skin blistering disease, most often caused by mutations in one of the three chains of laminin (Lm)-332, the α3, β3 or γ2 chains (29,76–81). Mice that lack expression of Lm-332 die shortly after birth with blistering of the skin and oral mucosa (82–84). We have rescued the laminin γ2-deficient (Lamc2−/−) mice by expressing a doxycycline (dox)-controllable human laminin γ2 transgene under the keratinocyte-specific K14 promoter (Lamc2 rKO)(27). In the absence of doxycycline in their drinking water, these mice gradually develop phenotypes similar to that observed in JEB. Unlike the models above, these mice do not develop severe lesions upon their backs, and undergo normal skin differentiation. Rather, upon withdrawal of doxycycline the mice evidence a macroscopic slight reddening of all skin and the presence of blistering on the paws (Figure 8D), along with additional microscopic evidence of JEB. TEWL and WBC measures were collected from age-matched animals either maintained or withdrawn from doxycycline. Here, we show again that as the skin barrier loses integrity, WBC increases (Figure 8E, r2 = 0.8956). These manipulations clearly provide quantitative validation of previous Notch analyses and show that genetic modifiers with a range of molecular mechanisms for decreasing skin integrity consistently increase WBC. This supports the suggestion that polymorphism which regulates skin genes in humans may also contribute to phenotypic variation in human WBC.
DISCUSSION
To build a foundational resource for expression based ‘pathway-like’ analyses, we have systematically defined sets of genes with enriched expression across a range of tissues, and tested the utility of this resource for several applications. First, we have formally tested the long-held assumption that diseases genes overall should be enriched in their expression in the tissues afflicted by the disease. Second, we defined the tissues implicated by this assumption for every trait available in the NHGRI catalog (Movie S1). Third, we conducted mice experiments based on observations from this approach, demonstrating a quantitative relationship between the genetics of skin integrity and the immunological trait of white blood cell count. Finally, we show that our resource and approach have applications to gene sets derived from data sources beyond GWAS. It is also worth noting that the TSEA method is not limited to disease gene lists and can be used to highlight tissues related to gene lists from any analysis. We have shown this utility by analyzing data from exome sequencing studies (25,26) as well as a list of genes under purifying selection (25) (Figure 7). This last finding is noteworthy because it suggests that much of the evolutionary pressures of human selection might be occurring on genes mediating behavior, rather than other physiological traits.
Note that our conclusions regarding the selective expression hypothesis do not state that every disease gene will follow this pattern, as there are well known examples of broadly expressed genes that still disrupt very specific cell types or tissues (e.g. mutations in the mitochondrial protein SOD1, expressed in every cell, can lead to the specific destruction of motor neurons in Amyotrophic Lateral Sclerosis) (11). Rather, the conclusion is that across a large number of genes for a given diseases, there will be a relative overabundance of those with enriched expression in the relevant tissue.
Overall, we found 57/98 traits had a relationship to particular tissues. This is a remarkably high proportion, especially given that many of these studies utilized a fairly simple method (genomic proximity) of attributing SNPs to genes, and thus there was likely some added noise in the analysis. We do not believe this noise influences our main conclusions because previous modeling adding spurious genes actually decreased our power to detect tissue-specific enrichment (20), and thus would contribute only to false negatives rather than false positives. Nonetheless, false negatives here should be interpreted with caution until future analyses incorporating new data better integrating gene expression and genomic polymorphisms are included. These, along with results from exome sequencing studies, will likely improve our ability to ascribe genetic risk to particular genes and thus improve the sensitivity of the method.
We have demonstrated the utility of the TSEA method by providing support for the selective expression hypothesis. Presented here are at least three clear practical future applications of the TSEA. (i) In situations where the genetic analyses are robust but the biological mechanisms are not well understood, TSEA may be used to identify the relevant tissues. For example, GWAS signals for uric acid levels clearly identify the kidney as the source of the metabolite (Figure 4). For future disease biomarkers of unknown tissue source, GWAS in conjunction with TSEA may provide some biological insight. (ii) Systematic use of expression data has the potential to help prioritize variants discovered in GWAS or exome studies. Furthermore, in studies where the relevant tissue is known, TSEA could provide biological prior information for GWA analysis, which could increase the power of studies to detect disease loci, or help to determine which SNPs or genes within large LD blocks might be the most relevant. This is an area that will be pursued in the future. (iii) Even when the relevant tissue is thought to be well understood, TSEA may provide novel insights into the data. For example, we were initially surprised to see data indicating that BMI is regulated by genes expressed in the brain, but in the last three years this has become accepted by human geneticists studying obesity with the tentative explanation that genes regulating appetite probably contribute substantially to weight (51). Here, we have provided a hypothesis driven experiment that was designed from the observed results of the TSEA. The TSEA suggests that disruptions of genes expressed in the skin can alter the WBC. Using three different mouse models of skin disorders and a quantitative measure of skin integrity, we show that there is a relationship between the skin's function as a barrier and WBC. The genes highlighted by the TSEA were not directly tested, but MYB plays a role in the Notch-mediated HES/HEY network as well as RPBJ (85). The TSEA has provided a list of genes that can be experimentally manipulated in a model system to further characterize the relationship between skin and white blood cell count (Table 1).
Thus, to facilitate hypothesis generation and other analyses by the scientific community, we have implemented a simple TSEA tool on our website (http://genetics.wustl.edu/jdlab/tsea/). More importantly, we have provided an R package to calculate pSI values (pSI), and provided pre-calculated pSI values for each tissue type (Supplemental Table S3) to permit other researchers to apply these approaches to their own data, as well as to facilitate the propagation of these sets of tissue enriched genes into other tools for gene set enrichment analysis (2,3,31,32).
Supplementary Material
Acknowledgments
The authors would like the thank D. Conrad, J. Lowe, I. Borecki and N. Parikshak for helpful discussions and analytical assistance. The authors declare no conflicts of interest. We would like to thank J.Abu-Amar and M. Pasparakis for mouse lines. The authors would also like to thank S. Volpi, K. Ardlie, and the researchers of the Genotype-Tissue Expression (GTEx) Project.
SUPPLEMENTARY DATA
Supplementary Data are available at NAR Online.
FUNDING
Children's Discovery Institute of Washington University in St. Louis, and the National Institutes of Health (NIH) [1R01 HG008687, R21 NS083052-02, R21 DA038458-01]. Funding for open access charge: NIH [R21MH099798-01].
Conflict of interest statement. None declared.
REFERENCES
- 1.Ashburner M., Ball C.A., Blake J.A., Botstein D., Butler H., Cherry J.M., Davis A.P., Dolinski K., Dwight S.S., Eppig J.T., et al. Gene ontology: tool for the unification of biology. The Gene Ontology Consortium. Nat. Genet. 2000;25:25–29. doi: 10.1038/75556. [DOI] [PMC free article] [PubMed] [Google Scholar]
- 2.Mi H., Muruganujan A., Casagrande J.T., Thomas P.D. Large-scale gene function analysis with the PANTHER classification system. Nat. Protoc. 2013;8:1551–1566. doi: 10.1038/nprot.2013.092. [DOI] [PMC free article] [PubMed] [Google Scholar]
- 3.Huang D.W., Sherman B.T., Tan Q., Kir J., Liu D., Bryant D., Guo Y., Stephens R., Baseler M.W., Lane H.C., et al. DAVID Bioinformatics Resources: expanded annotation database and novel algorithms to better extract biology from large gene lists. Nucleic Acids Res. 2007;35:W169–W175. doi: 10.1093/nar/gkm415. [DOI] [PMC free article] [PubMed] [Google Scholar]
- 4.Subramanian A., Tamayo P., Mootha V.K., Mukherjee S., Ebert B.L., Gillette M.A., Paulovich A., Pomeroy S.L., Golub T.R., Lander E.S., et al. Gene set enrichment analysis: a knowledge-based approach for interpreting genome-wide expression profiles. Proc. Natl. Acad. Sci. U.S.A. 2005;102:15545–15550. doi: 10.1073/pnas.0506580102. [DOI] [PMC free article] [PubMed] [Google Scholar]
- 5.Willsey A.J., State M.W. Autism spectrum disorders: from genes to neurobiology. Curr. Opin. Neurobiol. 2015;30:92–99. doi: 10.1016/j.conb.2014.10.015. [DOI] [PMC free article] [PubMed] [Google Scholar]
- 6.Antanaviciute A., Daly C., Crinnion L.A., Markham A.F., Watson C.M., Bonthron D.T., Carr I.M. GeneTIER: prioritization of candidate disease genes using tissue-specific gene expression profiles. Bioinformatics. 2015;31:2728–2735. doi: 10.1093/bioinformatics/btv196. [DOI] [PMC free article] [PubMed] [Google Scholar]
- 7.Goh K.I., Cusick M.E., Valle D., Childs B., Vidal M., Barabasi A.L. The human disease network. Proc. Natl. Acad. Sci. U.S.A. 2007;104:8685–8690. doi: 10.1073/pnas.0701361104. [DOI] [PMC free article] [PubMed] [Google Scholar]
- 8.Oellrich A., Smedley D. Linking tissues to phenotypes using gene expression profiles. Database (Oxford) 2014:bau017. doi: 10.1093/database/bau017. [DOI] [PMC free article] [PubMed] [Google Scholar]
- 9.Lage K., Hansen N.T., Karlberg E.O., Eklund A.C., Roque F.S., Donahoe P.K., Szallasi Z., Jensen T.S., Brunak S. A large-scale analysis of tissue-specific pathology and gene expression of human disease genes and complexes. Proc. Natl. Acad. Sci. U.S.A. 2008;105:20870–20875. doi: 10.1073/pnas.0810772105. [DOI] [PMC free article] [PubMed] [Google Scholar]
- 10.Winter E.E., Goodstadt L., Ponting C.P. Elevated rates of protein secretion, evolution, and disease among tissue-specific genes. Genome Res. 2004;14:54–61. doi: 10.1101/gr.1924004. [DOI] [PMC free article] [PubMed] [Google Scholar]
- 11.Sau D., Biasi S., Vitellaro-Zuccarello L., Riso P., Guarnieri S., Porrini M., Simeoni S., Crippa V., Onesto E., Palazzolo I., et al. Mutation of SOD1 in ALS: a gain of a loss of function. Hum. Mol. Genet. 2007;16:1604–1618. doi: 10.1093/hmg/ddm110. [DOI] [PubMed] [Google Scholar]
- 12.Peyron C., Faraco J., Rogers W., Ripley B., Overeem S., Charnay Y., Nevsimalova S., Aldrich M., Reynolds D., Albin R., et al. A mutation in a case of early onset narcolepsy and a generalized absence of hypocretin peptides in human narcoleptic brains. Nat. Med. 2000;6:991–997. doi: 10.1038/79690. [DOI] [PubMed] [Google Scholar]
- 13.GTEx Consortium. The Genotype-Tissue Expression (GTEx) project. Nat. Genet. 2013;45:580–585. doi: 10.1038/ng.2653. [DOI] [PMC free article] [PubMed] [Google Scholar]
- 14.Hindorff L.A., Sethupathy P., Junkins H.A., Ramos E.M., Mehta J.P., Collins F.S., Manolio T.A. Potential etiologic and functional implications of genome-wide association loci for human diseases and traits. Proc. Natl. Acad. Sci. U.S.A. 2009;106:9362–9367. doi: 10.1073/pnas.0903103106. [DOI] [PMC free article] [PubMed] [Google Scholar]
- 15.Demehri S., Liu Z., Lee J., Lin M.H., Crosby S.D., Roberts C.J., Grigsby P.W., Miner J.H., Farr A.G., Kopan R. Notch-deficient skin induces a lethal systemic B-lymphoproliferative disorder by secreting TSLP, a sentinel for epidermal integrity. PLoS Biol. 2008;6:e123. doi: 10.1371/journal.pbio.0060123. [DOI] [PMC free article] [PubMed] [Google Scholar]
- 16.Dumortier A., Durham A.-D., Di Piazza M., Vauclair S., Koch U., Ferrand G., Ferrero I., Demehri S., Song L.L., Farr A.G., et al. Atopic dermatitis-like disease and associated lethal myeloproliferative disorder arise from loss of notch signaling in the murine skin. PLoS ONE. 2010;5:e9258. doi: 10.1371/journal.pone.0009258. [DOI] [PMC free article] [PubMed] [Google Scholar]
- 17.GTEx Consortium. The genotype-tissue expression (GTEx) project. Nat. Genet. 2013;45:580–585. doi: 10.1038/ng.2653. [DOI] [PMC free article] [PubMed] [Google Scholar]
- 18.Mele M., Ferreira P.G., Reverter F., DeLuca D.S., Monlong J., Sammeth M., Young T.R., Goldmann J.M., Pervouchine D.D., Sullivan T.J., et al. Human genomics. The human transcriptome across tissues and individuals. Science. 2015;348:660–665. doi: 10.1126/science.aaa0355. [DOI] [PMC free article] [PubMed] [Google Scholar]
- 19.Dougherty J.D., Schmidt E.F., Nakajima M., Heintz N. Analytical approaches to RNA profiling data for the identification of genes enriched in specific cells. Nucleic Acids Res. 2010;38:4218–4230. doi: 10.1093/nar/gkq130. [DOI] [PMC free article] [PubMed] [Google Scholar]
- 20.Xu X., Wells A.B., O'Brien D.R., Nehorai A., Dougherty J.D. Cell type-specific expression analysis to identify putative cellular mechanisms for neurogenetic disorders. J. Neurosci. 2014;34:1420–1431. doi: 10.1523/JNEUROSCI.4488-13.2014. [DOI] [PMC free article] [PubMed] [Google Scholar]
- 21.Ramsköld D., Wang E.T., Burge C.B., Sandberg R. An abundance of ubiquitously expressed genes revealed by tissue transcriptome sequence data. PLoS Comput. Biol. 2009;5:e1000598. doi: 10.1371/journal.pcbi.1000598. [DOI] [PMC free article] [PubMed] [Google Scholar]
- 22.Dougherty J.D., Schmidt E.F., Nakajima M., Heintz N. Analytical approaches to RNA profiling data for the identification of genes enriched in specific cells. Nucleic Acids Res. 2010;38:4218–4230. doi: 10.1093/nar/gkq130. [DOI] [PMC free article] [PubMed] [Google Scholar]
- 23.Schug J., Schuller W.P., Kappen C., Salbaum J.M., Bucan M., Stoeckert C.J. Jr. Promoter features related to tissue specificity as measured by Shannon entropy. Genome Biol. 2005;6:R33. doi: 10.1186/gb-2005-6-4-r33. [DOI] [PMC free article] [PubMed] [Google Scholar]
- 24.Lercher M.J., Urrutia A.O., Hurst L.D. Clustering of housekeeping genes provides a unified model of gene order in the human genome. Nat. Genet. 2002;31:180–183. doi: 10.1038/ng887. [DOI] [PubMed] [Google Scholar]
- 25.Samocha K.E., Robinson E.B., Sanders S.J., Stevens C., Sabo A., McGrath L.M., Kosmicki J.A., Rehnstrom K., Mallick S., Kirby A., et al. A framework for the interpretation of de novo mutation in human disease. Nat. Genet. 2014;46:944–950. doi: 10.1038/ng.3050. [DOI] [PMC free article] [PubMed] [Google Scholar]
- 26.EuroEPINOMICS-RES Consortium., Epilepsy Phenome/Genome Project., Epi4K Consortium. De novo mutations in synaptic transmission genes including DNM1 cause epileptic encephalopathies. Am. J. Hum. Genet. 2014;95:360–370. doi: 10.1016/j.ajhg.2014.08.013. [DOI] [PMC free article] [PubMed] [Google Scholar]
- 27.Adair-Kirk T.L., Griffin G.L., Meyer M.J., Kelley D.G., Miner J.H., Keene D.R., Marinkovich M.P., Ruppert J.M., Uitto J., Senior R.M. Keratinocyte-targeted expression of human laminin gamma2 rescues skin blistering and early lethality of laminin gamma2 deficient mice. PLoS One. 2012;7:e45546. doi: 10.1371/journal.pone.0045546. [DOI] [PMC free article] [PubMed] [Google Scholar]
- 28.Nenci A., Becker C., Wullaert A., Gareus R., van Loo G., Danese S., Huth M., Nikolaev A., Neufert C., Madison B., et al. Epithelial NEMO links innate immunity to chronic intestinal inflammation. Nature. 2007;446:557–561. doi: 10.1038/nature05698. [DOI] [PubMed] [Google Scholar]
- 29.Li Q., Lu Q., Hwang J.Y., Buscher D., Lee K.F., Izpisua-Belmonte J.C., Verma I.M. IKK1-deficient mice exhibit abnormal development of skin and skeleton. Genes Dev. 1999;13:1322–1328. doi: 10.1101/gad.13.10.1322. [DOI] [PMC free article] [PubMed] [Google Scholar]
- 30.Pasparakis M., Courtois G., Hafner M., Schmidt-Supprian M., Nenci A., Toksoy A., Krampert M., Goebeler M., Gillitzer R., Israel A., et al. TNF-mediated inflammatory skin disease in mice with epidermis-specific deletion of IKK2. Nature. 2002;417:861–866. doi: 10.1038/nature00820. [DOI] [PubMed] [Google Scholar]
- 31.Maere S., Heymans K., Kuiper M. BiNGO: a Cytoscape plugin to assess overrepresentation of gene ontology categories in biological networks. Bioinformatics. 2005;21:3448–3449. doi: 10.1093/bioinformatics/bti551. [DOI] [PubMed] [Google Scholar]
- 32.Shi J., Walker M.G. Gene set enrichment analysis (GSEA) for interpreting gene expression profiles. Curr. Bioinform. 2007;2:133–137. [Google Scholar]
- 33.Fisher R.A. On the interpretation of χ2 from contingency tables, and the calculation of P. J. Roy. Stat. Soc. B Met. 1922;85:87–94. [Google Scholar]
- 34.Benjamini Y., Hochberg Y. Controlling the false discovery rate – a practical and powerful approach to multiple testing. J. Roy. Stat. Soc. B Met. 1995;57:289–300. [Google Scholar]
- 35.Kottgen A., Albrecht E., Teumer A., Vitart V., Krumsiek J., Hundertmark C., Pistis G., Ruggiero D., O'Seaghdha C.M., Haller T., et al. Genome-wide association analyses identify 18 new loci associated with serum urate concentrations. Nat. Genet. 2013;45:145–154. doi: 10.1038/ng.2500. [DOI] [PMC free article] [PubMed] [Google Scholar]
- 36.Tin A., Woodward O.M., Kao W.H.L., Liu C.T., Lu X.N., Nalls M.A., Shriner D., Semmo M., Akylbekova E.L., Wyatt S.B., et al. Genome-wide association study for serum urate concentrations and gout among African Americans identifies genomic risk loci and a novel URAT1 loss-of-function allele. Hum. Mol. Genet. 2011;20:4056–4068. doi: 10.1093/hmg/ddr307. [DOI] [PMC free article] [PubMed] [Google Scholar]
- 37.Yang Q.O., Kottgen A., Dehghan A., Smith A.V., Glazer N.L., Chen M.H., Chasman D.I., Aspelund T., Eiriksdottir G., Harris T.B., et al. Multiple genetic loci influence serum urate levels and their relationship with gout and cardiovascular disease risk factors. Circ-Cardiovasc. Gene. 2010;3:523–530. doi: 10.1161/CIRCGENETICS.109.934455. [DOI] [PMC free article] [PubMed] [Google Scholar]
- 38.Kamatani Y., Matsuda K., Okada Y., Kubo M., Hosono N., Daigo Y., Nakamura Y., Kamatani N. Genome-wide association study of hematological and biochemical traits in a Japanese population. Nat. Genet. 2010;42:U210–U225. doi: 10.1038/ng.531. [DOI] [PubMed] [Google Scholar]
- 39.Dehghan A., Kottgen A., Yang Q., Hwang S.J., Kao W.H.L., Rivadeneira F., Boerwinkle E., Levy D., Hofman A., Astor B.C., et al. Association of three genetic loci with uric acid concentration and risk of gout: a genome-wide association study. Lancet. 2008;372:1953–1961. doi: 10.1016/S0140-6736(08)61343-4. [DOI] [PMC free article] [PubMed] [Google Scholar]
- 40.Doring A., Gieger C., Mehta D., Gohlke H., Prokisch H., Coassin S., Fischer G., Henke K., Klopp N., Kronenberg F., et al. SLC2A9 influences uric acid concentrations with pronounced sex-specific effects. Nat. Genet. 2008;40:430–436. doi: 10.1038/ng.107. [DOI] [PubMed] [Google Scholar]
- 41.Vitart V., Rudan I., Hayward C., Gray N.K., Floyd J., Palmer C.N., Knott S.A., Kolcic I., Polasek O., Graessler J., et al. SLC2A9 is a newly identified urate transporter influencing serum urate concentration, urate excretion and gout. Nat. Genet. 2008;40:437–442. doi: 10.1038/ng.106. [DOI] [PubMed] [Google Scholar]
- 42.Wallace C., Newhouse S.J., Braund P., Zhang F., Tobin M., Falchi M., Ahmadi K., Dobson R.J., Marcano A.C., Hajat C., et al. Genome-wide association study identifies genes for biomarkers of cardiovascular disease: serum urate and dyslipidemia. Am. J. Hum. Genet. 2008;82:139–149. doi: 10.1016/j.ajhg.2007.11.001. [DOI] [PMC free article] [PubMed] [Google Scholar]
- 43.Li S., Sanna S., Maschio A., Busonero F., Usala G., Mulas A., Lai S., Dei M., Orru M., Albai G., et al. The GLUT9 gene is associated with serum uric acid levels in Sardinia and chianti cohorts. PLoS Genet. 2007;3:2156–2162. doi: 10.1371/journal.pgen.0030194. [DOI] [PMC free article] [PubMed] [Google Scholar]
- 44.den Hoed M., Eijgelsheim M., Esko T., Brundel B.J.J.M., Peal D.S., Evans D.M., Nolte I.M., Segre A.V., Holm H., Handsaker R.E., et al. Identification of heart rate-associated loci and their effects on cardiac conduction and rhythm disorders. Nat. Genet. 2013;45:621. doi: 10.1038/ng.2610. [DOI] [PMC free article] [PubMed] [Google Scholar]
- 45.Jeff J.M., Ritchie M.D., Denny J.C., Kho A.N., Ramirez A.H., Crosslin D., Armstrong L., Basford M.A., Wolf W.A., Pacheco J.A., et al. Generalization of Variants Identified by Genome-Wide Association Studies for Electrocardiographic Traits in African Americans. Ann. Hum. Genet. 2013;77:321–332. doi: 10.1111/ahg.12023. [DOI] [PMC free article] [PubMed] [Google Scholar]
- 46.Deo R., Nalls M.A., Avery C.L., Smith J.G., Evans D.S., Keller M.F., Butler A.M., Buxbaum S.G., Li G., Miguel Quibrera P., et al. Common genetic variation near the connexin-43 gene is associated with resting heart rate in African Americans: a genome-wide association study of 13,372 participants. Heart Rhythm. 2013;10:401–408. doi: 10.1016/j.hrthm.2012.11.014. [DOI] [PMC free article] [PubMed] [Google Scholar]
- 47.Rankinen T., Sung Y.J., Sarzynski M.A., Rice T.K., Rao D.C., Bouchard C. Heritability of submaximal exercise heart rate response to exercise training is accounted for by nine SNPs. J. Appl. Physiol. 2012;112:892–897. doi: 10.1152/japplphysiol.01287.2011. [DOI] [PMC free article] [PubMed] [Google Scholar]
- 48.Eijgelsheim M., Newton-Cheh C., Sotoodehnia N., de Bakker P.I., Muller M., Morrison A.C., Smith A.V., Isaacs A., Sanna S., Dorr M., et al. Genome-wide association analysis identifies multiple loci related to resting heart rate. Hum. Mol. Genet. 2010;19:3885–3894. doi: 10.1093/hmg/ddq303. [DOI] [PMC free article] [PubMed] [Google Scholar]
- 49.Marroni F., Pfeufer A., Aulchenko Y.S., Franklin C.S., Isaacs A., Pichler I., Wild S.H., Oostra B.A., Wright A.F., Campbell H., et al. A genome-wide association scan of RR and QT interval duration in 3 European genetically isolated populations: the EUROSPAN project. Circ. Cardiovasc. Genet. 2009;2:322–328. doi: 10.1161/CIRCGENETICS.108.833806. [DOI] [PMC free article] [PubMed] [Google Scholar]
- 50.Newton-Cheh C., Guo C.Y., Wang T.J., O'Donnell C.J., Levy D., Larson M.G. Genome-wide association study of electrocardiographic and heart rate variability traits: the Framingham Heart Study. BMC Med. Genet. 2007;8(Suppl. 1):S7. doi: 10.1186/1471-2350-8-S1-S7. [DOI] [PMC free article] [PubMed] [Google Scholar]
- 51.Berndt S.I., Gustafsson S., Magi R., Ganna A., Wheeler E., Feitosa M.F., Justice A.E., Monda K.L., Croteau-Chonka D.C., Day F.R., et al. Genome-wide meta-analysis identifies 11 new loci for anthropometric traits and provides insights into genetic architecture. Nat. Genet. 2013;45:U501–U569. doi: 10.1038/ng.2606. [DOI] [PMC free article] [PubMed] [Google Scholar]
- 52.Manning A.K., Hivert M.F., Scott R.A., Grimsby J.L., Bouatia-Naji N., Chen H., Rybin D., Liu C.T., Bielak L.F., Prokopenko I., et al. A genome-wide approach accounting for body mass index identifies genetic variants influencing fasting glycemic traits and insulin resistance. Nat. Genet. 2012;44:659–669. doi: 10.1038/ng.2274. [DOI] [PMC free article] [PubMed] [Google Scholar]
- 53.Fox C.S., Liu Y., White C.C., Feitosa M., Smith A.V., Heard-Costa N., Lohman K., Consortium G., Consortium M., Consortium G., et al. Genome-wide association for abdominal subcutaneous and visceral adipose reveals a novel locus for visceral fat in women. PLoS Genet. 2012;8:e1002695. doi: 10.1371/journal.pgen.1002695. [DOI] [PMC free article] [PubMed] [Google Scholar]
- 54.Jostins L., Ripke S., Weersma R.K., Duerr R.H., McGovern D.P., Hui K.Y., Lee J.C., Schumm L.P., Sharma Y., Anderson C.A., et al. Host-microbe interactions have shaped the genetic architecture of inflammatory bowel disease. Nature. 2012;491:119–124. doi: 10.1038/nature11582. [DOI] [PMC free article] [PubMed] [Google Scholar]
- 55.Okada Y., Yamazaki K., Umeno J., Takahashi A., Kumasaka N., Ashikawa K., Aoi T., Takazoe M., Matsui T., Hirano A., et al. HLA-Cw*1202-B*5201-DRB1*1502 haplotype increases risk for ulcerative colitis but reduces risk for Crohn's disease. Gastroenterology. 2011;141:864–871. doi: 10.1053/j.gastro.2011.05.048. [DOI] [PubMed] [Google Scholar]
- 56.Dubinsky M.C., Mei L., Friedman M., Dhere T., Haritunians T., Hakonarson H., Kim C., Glessner J., Targan S.R., McGovern D.P., et al. Genome wide association (GWA) predictors of anti-TNFalpha therapeutic responsiveness in pediatric inflammatory bowel disease. Inflamm. Bowel Dis. 2010;16:1357–1366. doi: 10.1002/ibd.21174. [DOI] [PMC free article] [PubMed] [Google Scholar]
- 57.Imielinski M., Baldassano R.N., Griffiths A., Russell R.K., Annese V., Dubinsky M., Kugathasan S., Bradfield J.P., Walters T.D., Sleiman P., et al. Common variants at five new loci associated with early-onset inflammatory bowel disease. Nat. Genet. 2009;41:U1335–U1107. doi: 10.1038/ng.489. [DOI] [PMC free article] [PubMed] [Google Scholar]
- 58.Kugathasan S., Baldassano R.N., Bradfield J.P., Sleiman P.M., Imielinski M., Guthery S.L., Cucchiara S., Kim C.E., Frackelton E.C., Annaiah K., et al. Loci on 20q13 and 21q22 are associated with pediatric-onset inflammatory bowel disease. Nat. Genet. 2008;40:1211–1215. doi: 10.1038/ng.203. [DOI] [PMC free article] [PubMed] [Google Scholar]
- 59.Duerr R.H., Taylor K.D., Brant S.R., Rioux J.D., Silverberg M.S., Daly M.J., Steinhart A.H., Abraham C., Regueiro M., Griffiths A., et al. A genome-wide association study identifies IL23R as an inflammatory bowel disease gene. Science. 2006;314:1461–1463. doi: 10.1126/science.1135245. [DOI] [PMC free article] [PubMed] [Google Scholar]
- 60.Myouzen K., Kochi Y., Okada Y., Terao C., Suzuki A., Ikari K., Tsunoda T., Takahashi A., Kubo M., Taniguchi A., et al. Functional variants in NFKBIE and RTKN2 involved in activation of the NF-kappaB pathway are associated with rheumatoid arthritis in Japanese. PLoS Genet. 2012;8:e1002949. doi: 10.1371/journal.pgen.1002949. [DOI] [PMC free article] [PubMed] [Google Scholar]
- 61.Okada Y., Terao C., Ikari K., Kochi Y., Ohmura K., Suzuki A., Kawaguchi T., Stahl E.A., Kurreeman F.A., Nishida N., et al. Meta-analysis identifies nine new loci associated with rheumatoid arthritis in the Japanese population. Nat. Genet. 2012;44:511–516. doi: 10.1038/ng.2231. [DOI] [PubMed] [Google Scholar]
- 62.Hu H.J., Jin E.H., Yim S.H., Yang S.Y., Jung S.H., Shin S.H., Kim W.U., Shim S.C., Kim T.G., Chung Y.J. Common variants at the promoter region of the APOM confer a risk of rheumatoid arthritis. Exp. Mol. Med. 2011;43:613–621. doi: 10.3858/emm.2011.43.11.068. [DOI] [PMC free article] [PubMed] [Google Scholar]
- 63.Eleftherohorinou H., Hoggart C.J., Wright V.J., Levin M., Coin L.J. Pathway-driven gene stability selection of two rheumatoid arthritis GWAS identifies and validates new susceptibility genes in receptor mediated signalling pathways. Hum. Mol. Genet. 2011;20:3494–3506. doi: 10.1093/hmg/ddr248. [DOI] [PubMed] [Google Scholar]
- 64.Terao C., Yamada R., Ohmura K., Takahashi M., Kawaguchi T., Kochi Y., Okada Y., Nakamura Y., Yamamoto K., Melchers I., et al. The human AIRE gene at chromosome 21q22 is a genetic determinant for the predisposition to rheumatoid arthritis in Japanese population. Hum. Mol. Genet. 2011;20:2680–2685. doi: 10.1093/hmg/ddr161. [DOI] [PubMed] [Google Scholar]
- 65.Freudenberg J., Lee H.S., Han B.G., Shin H.D., Kang Y.M., Sung Y.K., Shim S.C., Choi C.B., Lee A.T., Gregersen P.K., et al. Genome-Wide Association Study of Rheumatoid Arthritis in Koreans. Arthritis Rheum-Us. 2011;63:884–893. doi: 10.1002/art.30235. [DOI] [PubMed] [Google Scholar]
- 66.Kochi Y., Okada Y., Suzuki A., Ikari K., Terao C., Takahashi A., Yamazaki K., Hosono N., Myouzen K., Tsunoda T., et al. A regulatory variant in CCR6 is associated with rheumatoid arthritis susceptibility. Nat. Genet. 2010;42:U515–U563. doi: 10.1038/ng.583. [DOI] [PubMed] [Google Scholar]
- 67.Gregersen P.K., Amos C.I., Lee A.T., Lu Y., Remmers E.F., Kastner D.L., Seldin M.F., Criswell L.A., Plenge R.M., Holers V.M., et al. REL, encoding a member of the NF-kappa B family of transcription factors, is a newly defined risk locus for rheumatoid arthritis. Nat. Genet. 2009;41:U820–U877. doi: 10.1038/ng.395. [DOI] [PMC free article] [PubMed] [Google Scholar]
- 68.Raychaudhuri S., Remmers E.F., Lee A.T., Hackett R., Guiducci C., Burtt N.P., Gianniny L., Korman B.D., Padyukov L., Kurreeman F.A.S., et al. Common variants at CD40 and other loci confer risk of rheumatoid arthritis. Nat. Genet. 2008;40:1216–1223. doi: 10.1038/ng.233. [DOI] [PMC free article] [PubMed] [Google Scholar]
- 69.Julia A., Ballina J., Canete J.D., Balsa A., Tornero-Molina J., Naranjo A., Alperi-Lopez M., Erra A., Pascual-Salcedo D., Barcelo P., et al. Genome-wide association study of rheumatoid arthritis in the Spanish population: KLF12 as a risk locus for rheumatoid arthritis susceptibility. Arthritis Rheum. 2008;58:2275–2286. doi: 10.1002/art.23623. [DOI] [PubMed] [Google Scholar]
- 70.Plenge R.M., Cotsapas C., Davies L., Price A.L., Bakker P.I.W., Maller J., Pe'er I., Burtt N.P., Blumenstiel B., DeFelice M., et al. Two independent alleles at 6q23 associated with risk of rheumatoid arthritis. Nat. Genet. 2007;39:1477–1482. doi: 10.1038/ng.2007.27. [DOI] [PMC free article] [PubMed] [Google Scholar]
- 71.Plenge R.M., Seielstad M., Padyukov L., Lee A.T., Remmers E.F., Ding B., Liew A., Khalili H., Chandrasekaran A., Davies L.R.L., et al. TRAF1-C5 as a risk locus for rheumatoid arthritis - A genomewide study. N. Engl. J. Med. 2007;357:1199–1209. doi: 10.1056/NEJMoa073491. [DOI] [PMC free article] [PubMed] [Google Scholar]
- 72.Wellcome Trust Case Control Consortium. Genome-wide association study of 14,000 cases of seven common diseases and 3,000 shared controls. Nature. 2007;447:661–678. doi: 10.1038/nature05911. [DOI] [PMC free article] [PubMed] [Google Scholar]
- 73.Sherva R., Tripodis Y., Bennett D.A., Chibnik L.B., Crane P.K., de Jager P.L., Farrer L.A., Saykin A.J., Shulman J.M., Naj A., et al. Genome-wide association study of the rate of cognitive decline in Alzheimer's disease. Alzheimers Dement. 2014;10:45–52. doi: 10.1016/j.jalz.2013.01.008. [DOI] [PMC free article] [PubMed] [Google Scholar]
- 74.Samocha K.E., Robinson E.B., Sanders S.J., Stevens C., Sabo A., McGrath L.M., Kosmicki J.A., Rehnstrom K., Mallick S., Kirby A., et al. A framework for the interpretation of de novo mutation in human disease. Nat. Genet. 2014;46:944–950. doi: 10.1038/ng.3050. [DOI] [PMC free article] [PubMed] [Google Scholar]
- 75.Kopan R., Ilagan M.X. The canonical notch signaling pathway: unfolding the activation mechanism. Cell. 2009;137:216–233. doi: 10.1016/j.cell.2009.03.045. [DOI] [PMC free article] [PubMed] [Google Scholar]
- 76.Laimer M., Lanschuetzer C.M., Diem A., Bauer J.W. Herlitz junctional epidermolysis bullosa. Dermatol. Clin. 2010;28:55–60. doi: 10.1016/j.det.2009.10.006. [DOI] [PubMed] [Google Scholar]
- 77.Bauer J., Schumann H., Sonnichsen K., Tomaske M., Bosk A., Bruckner-Tuderman L., Rassner G., Garbe C. Molecular diagnostics facilitate distinction between lethal and non-lethal subtypes of junctional epidermolysis bullosa: a case report and review of the literature. Eur. J. Pediatr. 2002;161:672–679. doi: 10.1007/s00431-001-0851-2. [DOI] [PubMed] [Google Scholar]
- 78.Meneguzzi G., Marinkovich M.P., Aberdam D., Pisani A., Burgeson R., Ortonne J.P. Kalinin is abnormally expressed in epithelial basement membranes of Herlitz's junctional epidermolysis bullosa patients. Exp. Dermatol. 1992;1:221–229. doi: 10.1111/j.1600-0625.1992.tb00080.x. [DOI] [PubMed] [Google Scholar]
- 79.Nakano A., Chao S.C., Pulkkinen L., Murrell D., Bruckner-Tuderman L., Pfendner E., Uitto J. Laminin 5 mutations in junctional epidermolysis bullosa: molecular basis of Herlitz vs. non-Herlitz phenotypes. Hum. Genet. 2002;110:41–51. doi: 10.1007/s00439-001-0630-1. [DOI] [PubMed] [Google Scholar]
- 80.Pulkkinen L., Uitto J. Mutation analysis and molecular genetics of epidermolysis bullosa. Matrix Biol. 1999;18:29–42. doi: 10.1016/s0945-053x(98)00005-5. [DOI] [PubMed] [Google Scholar]
- 81.Yancey K.B., Hintner H. Non-herlitz junctional epidermolysis bullosa. Dermatol. Clin. 2010;28:67–77. doi: 10.1016/j.det.2009.10.008. [DOI] [PubMed] [Google Scholar]
- 82.Ryan M.C., Lee K., Miyashita Y., Carter W.G. Targeted disruption of the LAMA3 gene in mice reveals abnormalities in survival and late stage differentiation of epithelial cells. J. Cell Biol. 1999;145:1309–1323. doi: 10.1083/jcb.145.6.1309. [DOI] [PMC free article] [PubMed] [Google Scholar]
- 83.Meng X., Klement J.F., Leperi D.A., Birk D.E., Sasaki T., Timpl R., Uitto J., Pulkkinen L. Targeted inactivation of murine laminin gamma2-chain gene recapitulates human junctional epidermolysis bullosa. J. Invest. Dermatol. 2003;121:720–731. doi: 10.1046/j.1523-1747.2003.12515.x. [DOI] [PubMed] [Google Scholar]
- 84.Kuster J.E., Guarnieri M.H., Ault J.G., Flaherty L., Swiatek P.J. IAP insertion in the murine LamB3 gene results in junctional epidermolysis bullosa. Mamm. Genome. 1997;8:673–681. doi: 10.1007/s003359900535. [DOI] [PubMed] [Google Scholar]
- 85.Ansieau S., Strobl L.J., Leutz A. Activation of the Notch-regulated transcription factor CBF1/RBP-Jkappa through the 13SE1A oncoprotein. Genes Dev. 2001;15:380–385. doi: 10.1101/gad.189301. [DOI] [PMC free article] [PubMed] [Google Scholar]
Associated Data
This section collects any data citations, data availability statements, or supplementary materials included in this article.