

1. INTRODUCTION
According to the Centers for Disease Control and Prevention (CDC), an estimated 1.7 million American civilians sustain a traumatic brain injury (TBI) every year(1). Approximately 5–30% of patients with traumatic brain injury will develop posttraumatic epilepsy (PTE), depending on injury severity(2). Studies to date have shown that a variety of drugs, including antiepileptic drugs (AEDs) such as phenytoin, carbamazepine and valproic acid, administered during the period between injury and clinical epilepsy onset (clinical latent period), do not prevent the development of PTE(3–7). Empiric prophylactic treatment with these AEDs can also carry both cognitive(8–10) and systemic risks, including a trend toward higher mortality in the AED treated group in one study(11).
The NIH defines a biomarker as a “specific physical trait used to measure or indicate the effects or progress of a disease or condition” and has made discovery of biomarkers to predict the development of epilepsy in at-risk individuals (human or animal) a part of its Epilepsy Research Benchmark program (2007 NINDS Epilepsy Research Benchmark, Area I- C2). In the past, many features of traumatic brain injury cases, a clear at-risk group for the development of epilepsy, have been studied in attempts to predict who will develop PTE. Some of these injury features, particularly the presence of acute intracerebral hemorrhage, have then been used to select high risk groups of patients for testing the ability of drugs to prevent the development of PTE(7). The identification and selection of particularly high risk individuals in early stages of TBI, however, is not yet widely used in preclinical animal studies, despite some evidence that certain quantitative magnetic resonance imaging (MRI) measures correlate with measures of seizure susceptibility after experimental TBI(12). The present study is designed to further elucidate the power of multiparametric MRI endpoints, such as apparent diffusion coefficient (ADC) mapping by diffusion-weighted MRI (DWI) and injury-related brain swelling and blood-brain barrier disruption by contrast-enhanced T1-MRI, to predict differences in seizure susceptibility after fluid percussion injury (FPI).
2. METHODS
2.1. Animals
A total of 25 adult male Sprague-Dawley rats, weighing between 250 and 300gm (Harlan), were housed in conformance with the requirements of the US Department of Health and Human Services and the Institutional Animal Care and Use Committee (IACUC) of the University of Colorado, Denver. Animals were housed in temperature- and light-controlled housing and given free access to food and water prior to and after injury.
2.2. Establishment of dural access and performance of fluid percussion injury
Establishment of dural access and performance of fluid percussion injury (FPI) were performed using a previously validated and published protocol(13–14). Briefly, animals were anesthetized with 3–3.5% isoflurane (Isosol, VEDCO, Inc., St. Joseph, MO) via nose cone. A 3 mm diameter craniotomy was created and centered at −3mm from bregma and 3.5mm left of the sagittal suture. A female Luer-Loc hub (inside diameter of 3.5 mm) was centered over the craniotomy site and bonded to the skull with cyanoacrylate adhesive. Dental acrylic (Snap, Parkell, Inc., Edgewood, NJ) was poured around the Luer hub and support screws. After the acrylic hardened, antibiotic ointment was placed around the injury cap and the animal was returned to his cage to recover. Fifteen to twenty hours later, the animals were re-anesthetized with isoflurane in a 2:1 chamber. The animal was then removed from the chamber, immediately connected to the FPI apparatus and received a 20 msec pulse of pressurized fluid (2.5–3.0 atm- moderate impact force) on the intact dural surface before awakening from anesthesia(13–14). Sham-injured animals underwent establishment of dural access and were anesthetized and connected to the FPI apparatus, but the injury pulse was not triggered. All procedures as described were approved by the University of Colorado IACUC. After each procedure, post-procedural analgesia was provided using buprenorphine (0.4mg/kg subcutaneously twice daily).
2.3. Rotarod testing
After a pre-injury period of learning trials over the week prior to injury (four trials per day), each animal underwent rotarod testing at each of eight selected time points (one week, 10 days, two weeks, three weeks, four weeks, five weeks, six weeks and eight weeks after injury). The rod’s rotation was programmed to accelerate from 0 to 50 rpm over the course of 5 minutes (300s.)(15). Four trials were run at each selected time point after injury and the individual trial and mean times for each animal were recorded(15).
2.4. MRI acquisition protocols
All MRI studies were performed in the UCD Small Animal Imaging Facility. All animals underwent MRI imaging at 72 hours, one week, one month and two months after injury, using pre- and post-gadolinium-enhanced (0.2 mmol/kg Omniscan® IV) T1-weighted, T2-weighted, and diffusion-weighted sequences. For all MRIs, the rats were anesthetized with 2.5% isoflurane. Scans were performed on a 4.7 Tesla Bruker PharmaScan. A quadrature birdcage coil (inner diameter 38 mm, so-called “rat-brain-coil”), tuned to the 1H frequency of 200.27 MHz, was used for RF transmission and reception. T2-weighted MRI (to visualize and confirm injury) was acquired using a rapid acquisition with relaxation enhancement (RARE, Bruker manufacturer label for a fast spin echo sequence) protocol with following parameters: Field of view (FOV) = 4.6 cm; echo time/repetition time (TE/TR) = 100/4,000 msec; slice thickness = 1.20mm; no interslice gaps; number of slices = 18; number of averages = 8; matrix size = 128×256; total acquisition time = 8 min 31 sec. T1-weighted MR images (for volumetric measurements and BBBD assessment) were acquired using a multi-slice multi-echo (MSME, Bruker manufacturer label for a spin echo sequence, in this case with one echo) sequence, before and 5 minutes after administration of 0.2 mmol/kg Omniscan® via tail vein. The following acquisition parameters were used: FOV = 4.6 cm TE/TR = 11/900 msec; slice thickness =1.20 mm with no gaps applied; number of slices = 18; number of averages = 2; matrix size = 128×256; total acquisition time = 3 min 50 sec. Finally, the DWI protocol (for water diffusity/edema assessment) with 6 b-values was acquired using echo-planar imaging with the following parameters: FOV = 4.6 cm; TE/TR = 40/3,000 msec; slice thickness =2 mm with an interslice gap = 0.5 mm between the slices; number of slices = 4; number of averages = 16; b-values = 0, 150, 300, 600, 800 and 1000 sec/mm2 in the x-direction; matrix size = 64×64; total acquisition time = 4 min 48 sec. All images were acquired in the axial orientation.
2.5. MRI analysis
Hemispheric volumes
For each set of T1-weighted post-contrast images, the perimeter of each hemisphere was outlined on contiguous slices using manual segmentation and the intra-perimeter areas calculated (Image J, NIH). The volume of each forebrain hemisphere was estimated using these areas and the known slice thickness of 1.2 mm. As a measure of injury-related brain edema, the difference between the injured (Inj) and contralateral (CL) brain hemisphere volumes was calculated and normalized to the volume of the CL hemisphere, using the following formula: {(Volume(Inj)− Volume(CL)) / Volume(CL)} * 100%. This parameter, labeled the normalized interhemispheric volume difference, or NIVD, has been previously validated and published(13).
T1 signal intensity and calculation of blood-brain barrier disruption (BBBD)
T1-weighted MR imaging was collected both before and after the administration of intravenous gadolinium contrast. Extravasation of the intravenous dye due to injury-related blood-brain barrier breakdown brightens T1 signal intensities on post-contrast images. Single pre- and post-contrast T1-weighted MR images were selected for each animal at a standard level of the injury along the rostal-caudal axis (approximately 4mm caudal to bregma) for further analysis. An Image J script was written to automate the analysis of all these images. Using this script, three circular, 7 pixel diameter regions of interest (ROI), representing an average sample of left frontoparietal cortex (at the injury site), the ipsilateral hippocampus, and naive brain were mapped to the image in question. These regions can be adjusted to standardize ROI position even between images that may not be aligned in the same way. Once the regions were placed satisfactorily, pixel-by-pixel T1 signal intensity data were collected and averaged throughout the entire ROI. To account for potential differences in baseline signal intensities between scans, the normalized signal intensity (SI) for the cortical and hippocampal ROIs was calculated using the following formula: [mean SI (ROI)- mean SI (naïve)/mean SI (naïve)]; where ‘naïve’ was an uninvolved area in the contralateral brain. The difference in normalized T1 signal intensity in the same region of interest between the pre- and post-contrast images was used to quantitate the degree of blood-brain barrier disruption (BBBD).
ADC mapping
Using ParaVision 3.0.2 software (Bruker), four circular, approximate 0.009 cm2 diameter ROIs, representing an average sample of left frontoparietal cortex (at the injury site), the contralateral homologous cortex, and both hippocampi, respectively, were mapped to the DWI images. The dtraceb software function from the Bruker sequence analysis library was then used to generate the average ADC value for each ROI, based on the equation: ADC = ln(S0/Sn)/bn, where S0 is the intensity of the T2-weighted image (b=0), Sn is the intensity of the diffusion-weighted image with bn as the diffusion gradient attenuation factor. On review of the acquired ADC data, it was noted that one animal in the sham-injured group had calculated ADC values that were substantially different from all other animals. Review of the source images suggested poor quality of the diffusion-weighted images for that animal only and therefore, the ADC values for that animal were considered inaccurate and were excluded from further analyses. The radiologist scientists who performed the ADC analysis were blinded to the group assignment of the animals (sham vs. injured).
2.6. Electrode implantation/ EEG collection
Twelve weeks after injury, each animal was anesthetized and implanted with five dural screw electrodes (Plastics One) in the following positions: left frontal (rostral to FPI craniotomy), right frontal, left parietal (caudal to FPI craniotomy), right parietal, and caudal to lambda (ground electrode). The distal ends of the electrodes are inserted into a plastic head mount (Plastics One) and the electrodes and head mount cemented to the skull using dental cement (A–M Systems). The body temperature of each animal during the surgery and recovery period was maintained at 37°C using a homeothermic blanket apparatus. Five to seven days after implantation, allowing time for healing and “setting” of the cement, the animals were moved to a station in our video-electroencephalogram (EEG) monitoring facility and continuous two-channel EEG data (Channel 1: left frontal-right frontal/ Channel 2: left frontal-right parietal, although the volume of the rat brain is such that there is bihemispheric representation for most spike and all seizure discharges) and time-synched video data was acquired using Pinnacle Technologies’ EEG system and Sirenia acquisition and review software (Pinnacle Technologies, Lawrence, KS). Thirty minute baseline recordings were acquired prior to and one hour recordings were acquired after kainate administration for each animal.
2.7. Kainate challenge protocol
Kainate challenge was performed using a previously validated and published method, modified for use in adult animals(16–17). Briefly, at a single time point, 3 months after FPI or sham injury, each animal was given an 8mg/kg dose of kainic acid (KA) in sterile saline subcutaneously (SQ, total volume 1.0 ml). A 30 minute baseline EEG recording was done for each animal prior to KA administration. After KA administration, the EEG was collected for an additional 60 minutes for off-line analysis as detailed below.
2.8. EEG analysis
All EEG analysis was done subsequent to collection by a single investigator (LF). Similar to previously published studies, an electrographic seizure was defined as a greater than 5 second EEG period containing a rhythmic discharge with a clear onset, evolution in both waveform frequency and amplitude, a clear offset, and an amplitude greater than 2 times average baseline(12, 16). The beginning of a seizure was defined as the point of take-off for the first positive or negative deflection meeting the amplitude criterion. The end of a seizure was marked as the point of return to the baseline of the last positive or negative deflection meeting the amplitude criterion. Four separate measures were used to characterize the recorded seizure activity after administration of kainate: (1) latency to the beginning of the first electrographic seizure (in minutes), (2) total number of seizures in the first 60 minutes after kainate administration, (3) mean seizure duration (beginning to end, in seconds) and (4) total time spent seizing in the first 60 minutes after kainate administration (in seconds). Latency to first electrographic seizure was defined as the time from kainate administration to the onset of the first recorded electrographic seizure.
2.9. Statistical analysis
All correlations were performed using a two-tailed Spearman correlation with alpha= 0.05 (GraphPad software, LaJolla, CA). All comparisons between injured and sham-injured group mean parameters were performed using a Mann-Whitney U-test. A detailed description of the methods comparison analysis can be found in Altman (1991)(18).
3. RESULTS
3.1. Assessment of injury severity and occurrence of injury-related mortality
Twenty-five animals began the protocol: 14 in the FPI group (moderate impact force = 2.5–3.0 atm) and 11 in the sham-injured control group. In the FPI group, one animal did not survive injury (mortality rate= 7.1%). The impact force dislodged the implanted Luer hub in three additional animals, which were immediately euthanized. One injured animal died during an MRI scan (probably, anesthesia-related). Therefore, of the 14 original animals in the FPI group, nine survived the injury/anesthesia process. All of the animals in the sham-injured control group survived the study protocol.
3.2. Initial assessment of injury-related hemorrhagic brain damage
On initial visual analysis of the first post-injury MRI scan (72 hours after injury), we found a wide range of severities for the injury-related hemorrhage. In order to systematically describe the range of pathology seen, three different objective parameters were chosen: the existence of a subdural hematoma (SDH), the existence of a cortical contusion (CC), and the existence of intraventricular blood (IVH). Together, these parameters describe the extent of injury-related hemorrhage and were specifically chosen because posttraumatic hemorrhage has been shown in human epidemiological studies to be the strongest risk factor for the development of seizures after TBI(2, 19). The SDH and CC indicators were stratified into three categories: absent, present-small (rostral-caudal extent <= 2 slices for SDH; <= 5 slices for CC; slice thickness= 0.12mm), and present-large (rostral-caudal extent > 2 slices for SDH; > 5 slices for CC; slice thickness=0.12mm), for each animal, using their MR images at 72 hours after injury. The degree of IVH was graded as either present or absent. As a means of measuring the overall severity of the injury-related hemorrhage seen on initial MRI, we combined the three injury-related hemorrhage indicators to create a visual injury severity (VIS) score, similar to the hemorrhage score used by Immonen, et al., in a similar previous study(20). The VIS score was determined for each animal (see Table 1) in the injured and sham-injured groups. In order to have distinct groups of injured and control animals, animals with VIS=1, which was common to both the injured and sham-injured control groups, were excluded from further study. Only animals with VIS=2 or 3 (n=6) were continued in the injured group and only those animals with VIS=0 (n=6) were continued in the sham-injured group. The VIS assignments were considered to be further validated by a significant correlation with long-term vestibulomotor outcomes. As seen in Figure 1, VIS scores were significantly correlated with rotarod performance at 8 weeks after injury (r= −0.6111 and p=0.0042). The rotarod test has been shown to be a sensitive index of injury-induced vestibulomotor dysfunction following even mild fluid percussion injury(15, 21).
Table 1.
Visual Impact Severity (VIS) hemorrhage score determination.
| VISd=0 | VIS=1 | VIS=2 | VIS=3 | |
|---|---|---|---|---|
| SDHa | Absent | Absent | Present-small | Present-large |
| CCb | Absent | Present-small | Present-small | Present-large |
| IVHc | Absent | Absent | Present | Present |
| Number of injured animals | 0 | 3 | 4 | 2 |
| Number of “sham-injured” animals | 6 | 5 | 0 | 0 |
SDH: Subdural Hematoma;
CC: Cortical Contusion;
IVH: Intraventricular Hemorrhage;
VIS: Visual Injury Severity score
Figure 1.
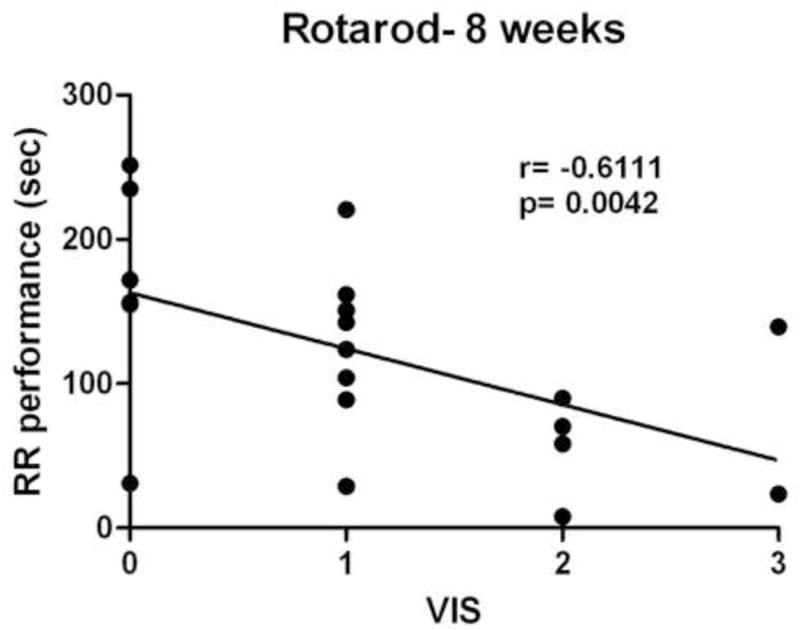
VIS scores were significantly correlated with functional neurological outcomes after FPI, measured at 8 weeks after injury. Rotarod (RR) performance was the mean duration (4 trials each) spent on the rotarod.
3.3. Multiple MRI endpoints reliably distinguish between injured and sham-injured animals
Overall, the MRI endpoints collected were: (1) an estimate of injury-related brain swelling (NIVD) as a volumetric end-point from T1-MRI; (2) signal enhancement as an assessment of blood-brain barrier disruption (BBBD) by gadolinium-enhanced T1-MRI; and (3) ADC values as a marker of tissue diffusivity by DWI. Representative T1-weighted pre- and post-contrast images (A) and DW images (B) from one sham and one injured animal at 72 hrs after FPI are presented in Figure 2. Each endpoint was measured in injured cortex and ipsilateral hippocampus, as well as the contralateral homologous structures, at 72 hours, 1 week, 1 month and 2 months after injury. As shown in Figure 2A, a significant enhancement due to tissue penetration of gadolinium through the disrupted BBB can be seen in the injured animals in injured cortical regions.
Figure 2.
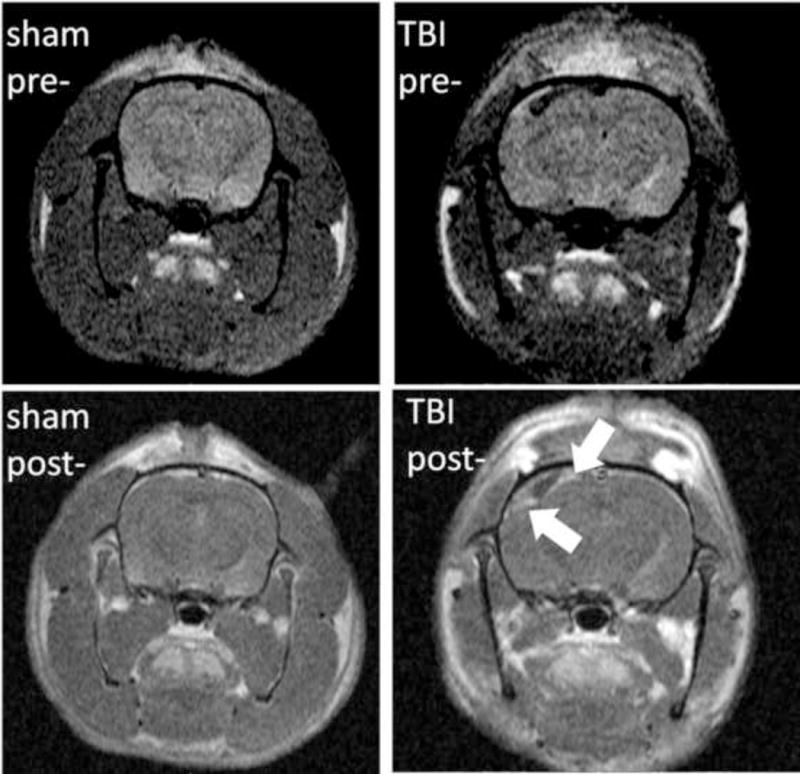
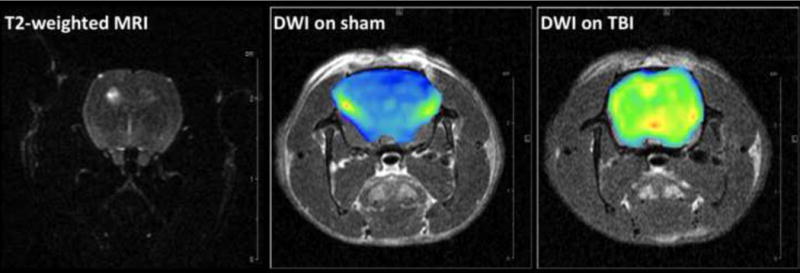
Representative T1-weighted pre- and post-contrast images (A) and DW images (B) from one sham and one injured animal at 72 hrs after FPI. (A): T1-MRI after gadolinium injection (0.2 mmol/kg) shows homogenous distribution in the sham animal with no hyperintense areas (left column) since gadolinium chelates cannot cross the BBB. In the injured animal, a significant accumulation of gadolinium in injured cortex can be observed in the post-contrast image (right column) due to BBBD and leakage of gadolinium into the brain tissue (blue arrows). (B): T2-weighted MRI (where b values are 0) and generated brain DW images (from 6 b-values) as color diagrams overlying anatomic T1-MRI. The sham animal is represented with homogenous low-intensity DWI (corresponding to higher ADC values); while a significant areas of hyperintensity are visible in the injured animal.
As shown in Figure 3A, mean NIVD values at 72 hours after injury were significantly different between injured (VIS=2 or 3) and sham-injured animals (Mean ± SEM. Injured: 3.95% swelling ± 0.37% vs. sham-injured: 0.97% swelling ± 0.42%, p=0.002). Mean BBBD values in injured cortex at 72 hours after injury were also significantly different between injured and sham-injured animals (Mean ± SEM. Injured: 36.45 ± 8.73 vs. sham-injured: 2.04 ± 2.20, p=0.002, Figure 3B). Lastly, mean ADC values (calculated from DWI using 6 different b-values) in injured cortex were significantly different between injured and sham-injured animals at 72 hours after injury (Mean ± SEM. Injured: 7.77×10⁻⁴ mm2/sec ± 0.90 mm2/sec vs. sham-injured: 12.93×10⁻⁴ mm2/sec ± 3.5 mm2/sec, p< 0.05, Figures 3C and 4). Mean ADC values in the injured cortex were not significantly different between injured and sham-injured animals at any other time point (Figure 4). The ADC values in the ipsilateral hippocampus were not significantly different between injured and sham-injured animals at any time point measured (Figure 4).
Figure 3.
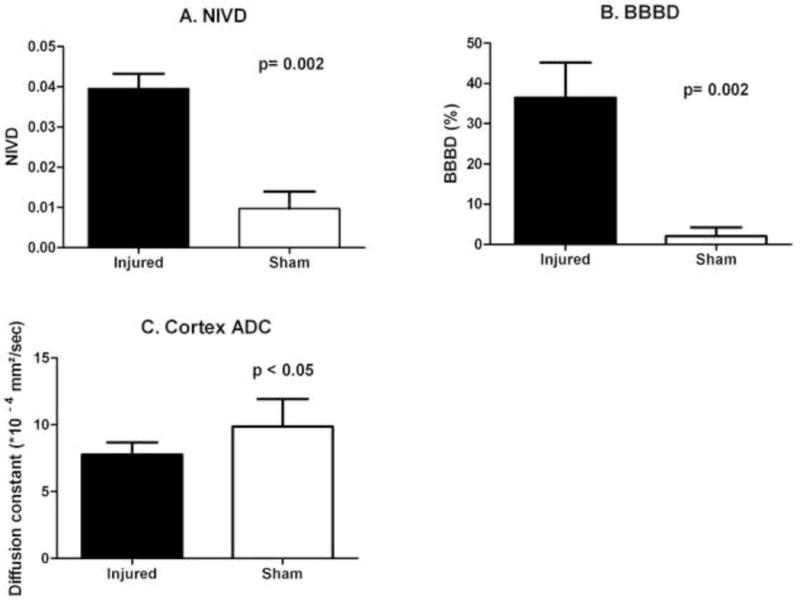
Mean normalized interhemispheric volume difference (NIVD, A), mean degree of post-injury blood-brain barrier disruption in the injured cortex (BBBD, B) and the mean ADC values (C) in injured cortex, all measured at 72 hours after injury, were significantly different between injured (n=6) and sham-injured (n=6; n=5 for ADC analyses) groups.
Figure 4.
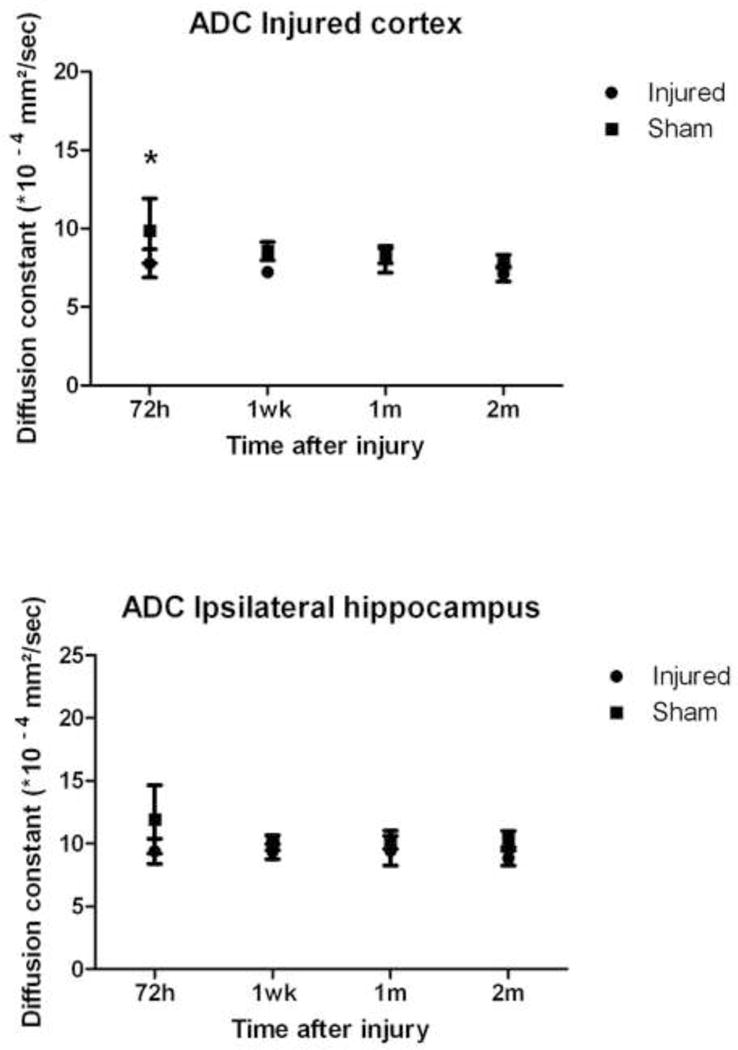
Timecourse for the change in ADC values in injured cortex and ipsilateral hippocampus after moderate to severe FPI in both injured (n=6) and sham-injured (n=5) animals. (*p< 0.05).
3.4. Selection of regions of interest (ROI) for T1 signal intensity and hemisphere volume calculations were reliable across animals and trials
The reliability of ROI selection for the BBBD and NIVD calculations was assessed using a methods comparison analysis on a subset of analyzed images from 72 hours and 1 week after injury(18). The mean difference and standard deviation of the comparison were: 0.132 and 3.872 for the BBBD comparison analysis and −0.853 mm3 and 1.837 mm3 in the hemisphere volumes analysis, supporting a high degree of reliability in ROI selection(18).
3.5. Response to kainate challenge reliably distinguished between injured and sham-injured animals
No seizures or spikes were present on the thirty minute baseline recordings performed on each animal (n=6 injured, n=6 sham-injured) prior to kainate administration at 3 months after FPI or sham-injury. A further sixty minutes of EEG recording was performed immediately after kainate administration and analyzed to determine four parameters of seizure susceptibility: (1) latency to first EEG seizure, (2) total number of seizures, (3) mean seizure duration and (4) total seizure time in the first 60 minutes after kainate administration. As shown in Figure 5, mean latency to first EEG seizure, mean total seizure time, and mean total number of seizures in the first 60 minutes after kainate administration were all significantly different between the injured and sham-injured groups of animals (Injured vs. sham-injured (mean ± SEM): 8.80 sec ± 0.61 sec vs. 20.17 sec ± 3.2 sec for mean latency; 19.60 ± 2.02 vs. 11.33 ± 0.88 for mean total number of seizures; 612.7 sec ± 81.08 sec vs. 269 sec ± 38.79 sec for mean total seizure time). Mean seizure duration was not significantly different between injured and sham-injured animals. Concurrent video recordings were also reviewed to assess behavioral correlates for the electrographic seizures. None of the animals exhibited seizures of greater than grade “3” on a modified Racine scale(22).
Figure 5.
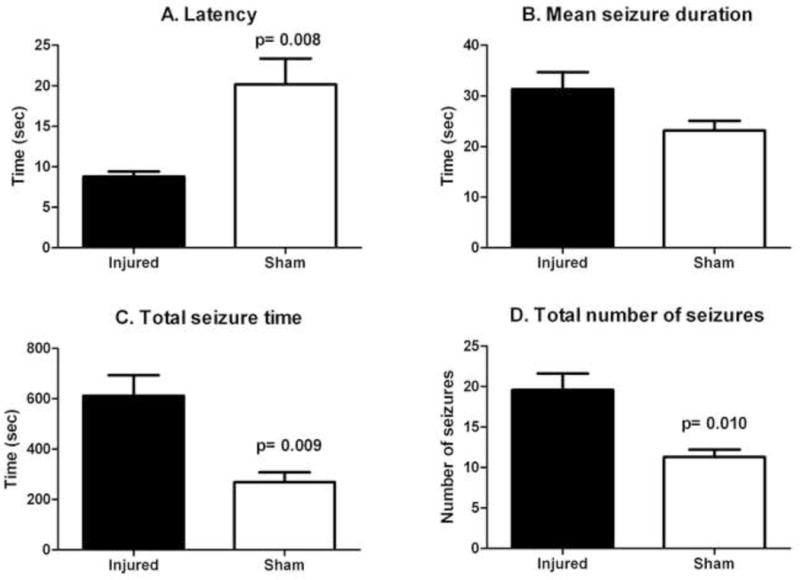
Latency to first seizure (A), total seizure time (C) and total number of seizures (D) after kainate challenge were significantly different between injured (n=6) and sham-injured groups (n=6). The difference in mean seizure duration (B) between injured and sham-injured animals was not statistically significant.
3.6. Multiple MRI endpoints predict seizure susceptibility at 3 months after injury
As shown in Figure 6, multiple MRI endpoints were significantly correlated with electrographic seizure susceptibility parameters. The ADC values in the injured cortex at 72 hours after injury were significantly correlated with total seizure time (Figure 6A). The ADC values in the injured cortex at 1 week after injury were significantly correlated with total seizure time and with mean seizure duration (Figures 6B and C). The degree of injury-related BBBD at 72 hours after injury was significantly correlated with total number of seizures in the first 60 minutes after kainate administration and with latency to seizure onset (Figures 6D and E). The degree of injury-related brain edema at 72 hours after injury was significantly correlated with latency to seizure onset (Figure 6F).
Figure 6.
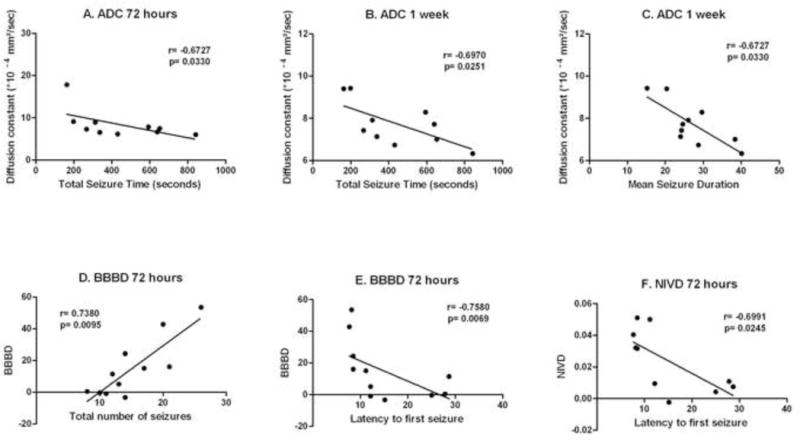
ADC values in the injured cortex at 72 hours after injury were significantly correlated with total seizure time (A) in the first 60 minutes after kainate administration. ADC values in the injured cortex at 1 week after injury were significantly correlated with total seizure time (B) and with mean seizure duration (C) in the first 60 minutes after kainate administration. The degree of injury-related blood-brain barrier disruption (BBBD) in injured cortex at 72 hours after injury was significantly correlated with total number of seizures in the first 60 minutes after kainate administration (D) and with latency to seizure onset (E). The degree of injury-related brain edema at 72 hours after injury (NIVD) was significantly correlated with latency to seizure onset (F).
4. DISCUSSION
This study describes the significant changes in multiparametric MRI endpoints in an established model of PTE and their potential to predict later post-injury seizure susceptibility.
4.1. Quantitative MRI endpoints non-invasively characterize FPI-related pathology and reliably differentiate between injured and sham-injured animals
On initial imaging, at 72 hours after injury, we found that the animals’ brain MRIs revealed a wider than expected range in the degree of hemorrhage present, despite a standardized injury protocol and standardized impact force. In response to this finding, as described above, we designed a semiquantitative method for categorizing hemorrhage severity (VIS score) in an effort to ensure that our injury and sham-injured groups were relatively homogenous and clearly different from each other. The VIS score criteria were specifically chosen to highlight those imaging findings that have been strongly associated with risk of the development of PTE in human epidemiological studies(2). For this reason, it is probable that our injury group was also relatively homogenous and clearly different from the sham-injured group with respect to their theoretical risk of developing PTE.
At least three possible explanations exist for the variability of VIS scores in our group of injured animals, despite the standardized impact force and injury protocol. First, the FPI apparatus could deliver a variable impact force, despite standardized settings. The main source of potential variability of our FPI apparatus is the compressibility of the air at the top of the fluid column(13). However, in previous testing, we did not find wide variability in either the slope of the upstroke or the peak amplitudes of the pressure waveform, as might be expected if the compressibility of air in the PFPI column was widely variable(13). Secondly, different impact forces may have been received by individual animals, even if identical impact forces were generated by the injury apparatus. In FPI, impact forces are measured proximal to the skull and not measured at the level of the brain, a recognized disadvantage of the model. Impact forces can be modified by factors such as partial dural hardening or minor variability in craniotomy location, for examples(23). These factors, plus interanimal variations in animal susceptibility, most likely contributed to the variability in injury severity seen in our study. The most likely possible explanation for variability of VIS within the sham-injured group is the occurrence of unrecognized mild damage to the brain surface during establishment of the craniotomy. The rate of this occurrence has not been assessed in previously published studies, but was low here.
Given that many of the above factors cannot be controlled for in experimental design or performance, we concluded that dividing animals simply into injured and sham-injured groups may not be the optimal identification of testing groups and selected animals into our study based on their VIS scores, instead. The validity of using the VIS score as a semi-quantitative method of describing the degree of injury-related brain damage seen on post-injury MRI scanning was further supported by its correlation with long-term vestibulomotor outcome at 8 weeks after injury (Figure 1). MRI-based confirmation of injury and categorization of injured animals into more homogeneous groups based on injury severity may also be of benefit in future studies either in experimental TBI or PTE, especially since inclusion criteria for many human trials for the treatment of TBI or the prevention of PTE are based on the degree of clinical and radiological evidence of injury(5–7, 11, 24–25).
The time point of 72 hours after injury was selected for the initial post-injury scan as it offered several advantages over either earlier or later time points. First, seventy-two hours allows for the development and stabilization of acute injury-related hemorrhage and brain swelling and, in fact, is thought to represent the time of maximal TBI-related edema production in many models of TBI(26–27). Secondly, because the appearance of hemoglobin deposits in brain tissue changes with time after injury on MRI scans, the selection of a single time for MRI analysis for all animals increased our chances of sampling a consistent point in the metabolism of intracranial hemoglobin, thus introducing minimal systematic bias to the study. Lastly, we wanted a relatively early time point to assess the predictive power of our MRI parameters as soon as possible after injury.
Three of our measured MRI endpoints (NIVD, BBBD and ADC) reliably differentiated between the groups of injured and sham-injured animals (Figure 3). The NIVD parameter, a measure of injury-related brain swelling, has been used before by us comparing groups of injured and sham-injured animals(13) and was expected to be significantly different between our current groups of injured and sham-injured animals, based on group sizes (Figure 3). In many published studies using the FPI model of experimental TBI, measurement of injury-related brain edema is done by comparing the wet and dry weights of each hemisphere. Our NIVD measurement offers a relative advantage over the wet weight-dry weight method is that it non-invasive and does not require immediate animal sacrifice, allowing for repeated measures over time using the same animal. We considered using lesion volume, or the estimated volume of damaged tissue, as an alternate measure to injury-related hemispheric edema, as there is evidence that lesion volume, as measured by triphenyltetrazolium chloride (TTC)-staining or MRI, can distinguish between injured and sham-injured animals, as well as among groups of differently-treated animals(14). However, this method also requires animal sacrifice and does not necessarily correlate with measures of functional neurological outcome(28).
We found a significant difference in mean ADC values between injured and sham-injured groups at 72 hours in the injured cortex and a trend towards a similar difference in the ispilateral hippocampus at the same time point (Figure 4). Decreased ADC values (arising from hyperintense DW images, Figure 2B) are believed to indicate diminished extracellular space caused by cytotoxic edema(29–30). The initial lower mean ADC value in FPI-injured cortex, when compared to homologous areas in sham-injured animals, is similar to that seen in previously published reports(29,31). The timecourse of mean ADC values over the whole study (Figure 4) seems to suggest that these initial lower ADC values in the FPI group at 72 hours may actually be due to a relative increase in mean ADC values in the sham-injured animals, as the mean ADC values in the sham-injured animals drop at the 1 week, 1 month and 2 month time points, while the mean ADC values in the FPI groups remain relatively stable. There is some support in the literature to suggest that this may be the case. Van Putten, et al., also documented a transient increase in mean left parietal (uninjured) cortex ADC values at 24 hours after sham-injury that then decreased to injured levels by 1 week later(31). Although speculative, a possible pathophysiological explanation for these findings might be that fluid shifts during the craniotomy and hub implantation surgery or relative dehydration in the 72 hours after FPI or sham-injury affects the brain more than might be expected. FPI then interrupts the brain’s reaction to these stressors, blocking the relative increase in mean ADC values seen in the sham-injured animals. Then, by one week after injury, the acute stressors are no longer affecting the sham-injured animals and their mean ADC values drop to levels similar to those seen in the FPI animals, although they still retain predictive value for response to chemoconvulsant challenge, as described below.
4.2. Response to chemoconvulsant challenge with kainic acid was significantly different between injured and sham-injured animals
In our study, we found that: (1) mean latency to first electrographic seizure was significantly shorter in injured animals; (2) mean total time spent seizing in the first 60 minutes after KA administration was significantly higher in injured animals; and (3) mean total number of seizures in the first 60 minutes after KA administration was significantly higher in injured animals at 3 months after FPI in adult rats (Figure 5). Similar results have been found in younger animals by other investigators. Administration of KA to juvenile FPI-injured animals resulted in a significantly reduced latency to first induced seizure and a significantly higher total time spent seizing in the first 60 minutes after KA administration, compared to a sham-injured group(17). Administration of KA in juvenile animals after hyperthermia-induced experimental febrile seizures resulted in a significantly reduced latency to first induced seizure, a significantly higher duration of the longest electrographic seizure and a significantly higher total time spent seizing in the first 60 minutes after KA administration, compared to animals without febrile seizures(16). In contrast, a single published study using pentylenetetrazole (PTZ) to assess seizure susceptibility after FPI in adult animals did not find significant differences in ictal parameters (such as latency to first seizure or electrographic or behavioral seizure duration or severity) between injured and sham-injured animals, but did find differences in the amount of interictal abnormal EEG activity at 12 months after injury(12). Potential explanations for our finding of differences in induced seizure patterns, as opposed to interictal EEG changes, include differences in the timing of chemoconvulsant administration (3 months vs. 12 months) or differences in the chemoconvulsant itself (PTZ vs. KA). We chose to use KA, rather than PTZ, because KA, a specific agonist for the kainate-type ionotrophic glutamate receptor, is used experimentally to induce status epilepticus which later results in a chronic temporal lobe epilepsy syndrome. Because of its sensitivity to injury, the hippocampus is also thought to contribute to the epileptogenic processes after TBI, as documented in human epidemiological and surgical studies (32–33) and in studies of the localization of seizure onset after FPI injury in rats(34–35).
4.3. ADC values, T1-signal changes and a measure of injury-related brain edema predict seizure susceptibility to kainate challenge at 3 months after injury
In this study, three of our MRI endpoints (ADC, BBBD and NIVD), done 72 hours to one week after injury, predicted differences in seizure susceptibility at three months after FPI or sham-injury, suggesting that they can be useful prognostic tools in the recovery period after TBI (Figure 6).
The predictive value of quantitative MRI parameters in assessing risk of the development of posttraumatic seizures has also been assessed by other investigators using a longer testing period (12 months after injury)(12). Kharatishvili and colleagues found that hippocampal Dav at 3hours post-injury significantly correlated with the total number of spikes on interictal EEG recordings after PTZ challenge at 12 months after injury. Hippocampal Dav at 7 and 11 months after injury also correlated with other measures of interictal EEG abnormality after PTZ challenge, including the total number of epileptiform discharges and the latency to first spike, findings that indicated increased overall seizure susceptibility after experimental TBI(12). It was unexpected to find that our hippocampal MRI endpoints were less powerful in predicting the degree of post-TBI seizure susceptibility than those measuring cortical injury, especially given these previously published findings and the importance of limbic structures in posttraumatic epilepsy syndromes in human and experimental TBI(32–35). However, the hippocampal measures used by Kharatishvili, et al., even though measured at multiple time points, were significantly predictive of response to chemoconvulsant challenge at late time points after injury (7 months and 11 months post-FPI). At those time points that match the ones used in our study, their hippocampal measures also contributed negligibly to the prediction of post-injury seizure susceptibility. Together, these lines of evidence suggest a relatively early contribution to post-injury seizure susceptibility from damage to cortical structures, with later contributions from the hippocampus, a process that is certainly possible given the often extended clinical latency between injury and seizure occurrence. In addition, our data also suggests that the epileptogenic processes are measurable at time points closer to the injury than have been previously investigated.
We used electrographic response to a chemoconvulsant challenge with KA as a measure of ongoing epileptogenesis in an experimental model of TBI. Electroencephalographic response to a chemoconvulsant (either PTZ or KA) has been successfully used as a marker of ongoing epileptogenic processes after cerebral insult in at least two different experimental models of epilepsy, including PTE(12,16–17). Although there are no published studies that clearly establish if increased seizure response to a chemoconvulsant in injured animals is predictive of increased individual risk of the later epilepsy, enhanced susceptibility to both PTZ and KA after injury is a consistent finding in this work and in others’(12, 16–17). In fact, our findings expand the spectrum of electroencephalographic response to chemoconvulsant challenge in adult animals to include changes in ictal, in addition to the previously described interictal, responses, a finding which may further validate the response of chemoconvulsant challenge after cerebral injury as a measure for the presence of ongoing epileptogenic processes. Such a marker of increased epilepsy risk would be especially useful in models of PTE, given the wide variability in latency, long time frame and relatively low risk of the development of recurrent spontaneous seizures after FPI (unpublished data)(35–36).
The ultimate goal of this study was to identify MRI endpoints that could act as biomarkers for posttraumatic epileptogenesis. An association between our MRI endpoints and multiple measures of seizure susceptibility is supported by the significant correlations between them. Their candidacy for use as PTE biomarkers is further strengthened by a strong degree of biological plausibility, although future, prospective studies are needed to confirm their predictive power. In humans, the amount of post-injury brain edema (as is measured here by NIVD and changes in ADC values) is an important predictor of acute mortality after TBI. In those patients who survive, TBI-related brain edema is also a poor prognostic indicator for later recovery(27, 37–38). In addition, blood-brain barrier disruption (measured here as BBBD) has been increasingly indentified as a prominent contributor to epileptogenesis in both in vitro and in vivo models of experimental epilepsy(39).
As both neurological outcome and PTE risk are clearly correlated with injury severity in humans(2), an argument could be made that these MRI endpoints are simply markers of injury severity, rather than independent prognostic markers of TBI outcome or sequelae. Although attempts to quantify risk of the development of PTE in humans using common clinical measures of injury severity have been unsuccessful to date(40–41), diagnostic information from new neuroimaging techniques may improve this predictive ability(42). If further studies validate the use of these MRI markers to predict epilepsy risk in experimental TBI, they can also be used to influence future study designs, thus increasing the similarity of preclinical to clinical study design, which may, in turn, increase the success of translation of potential therapies to human use(25).
Acknowledgments
The authors wish to thank the Colorado Injury Control and Research Center for funding support for this project. The authors also wish to thank Archana Shrestha, MD, and Amy Brooks-Kayal,MD, for their invaluable editing assistance. Funding for this project was provided by the Centers for Disease Control and Prevention and the Colorado Injury Control and Research Center. The Animal Imaging Core is supported through the Animal Imaging Shared Resources Core by the NCI P30 Cancer Center Grant (CA046934) and CTSA award (UL 1RR025780).
DISCLOSURES:
Funding for this project was provided by the Centers for Disease Control and Prevention and the Colorado Injury Control and Research Center. The Animal Imaging Core is supported through the Animal Imaging Shared Resources Core by the NCI P30 Cancer Center Grant (CA046934) and CTSA award (UL 1RR025780).
References
- 1.Faul M, Xy L, Wald M, et al. Traumatic Brain Injury in the United States: Emergency Department Visits, Hospitalizations and Deaths 2002–2006. Atlanta, GA: Centers for Disease Control and Prevention, National Center for Injury Prevention and Control; 2010. [Google Scholar]
- 2.Frey LC. Epidemiology of posttraumatic epilepsy: a critical review. Epilepsia. 2003;44(Suppl 10):11–7. doi: 10.1046/j.1528-1157.44.s10.4.x. [DOI] [PubMed] [Google Scholar]
- 3.Young B, Rapp RP, Norton JA, et al. Failure of prophylactically administered phenytoin to prevent late posttraumatic seizures. J Neurosurg. 1983 Feb;58(2):236–41. doi: 10.3171/jns.1983.58.2.0236. [DOI] [PubMed] [Google Scholar]
- 4.Young B, Rapp RP, Norton JA, et al. Failure of prophylactically administered phenytoin to prevent early posttraumatic seizures. J Neurosurg. 1983 Feb;58(2):231–5. doi: 10.3171/jns.1983.58.2.0231. [DOI] [PubMed] [Google Scholar]
- 5.Temkin NR. Antiepileptogenesis and seizure prevention trials with antiepileptic drugs: meta-analysis of controlled trials. Epilepsia. 2001 Apr;42(4):515–24. doi: 10.1046/j.1528-1157.2001.28900.x. [DOI] [PubMed] [Google Scholar]
- 6.Watson NF, Barber JK, Doherty MJ, et al. Does glucocorticoid administration prevent late seizures after head injury? Epilepsia. 2004 Jun;45(6):690–4. doi: 10.1111/j.0013-9580.2004.59403.x. [DOI] [PubMed] [Google Scholar]
- 7.Temkin N. Preventing and treating posttraumatic seizures: The human experience. Epilepsia. 2009;50(Suppl. 2):10–3. doi: 10.1111/j.1528-1167.2008.02005.x. [DOI] [PubMed] [Google Scholar]
- 8.Dikmen SS, Machamer JE, Winn HR, et al. Neuropsychological effects of valproate in traumatic brain injury: a randomized trial. Neurology. 2000 Feb 22;54(4):895–902. doi: 10.1212/wnl.54.4.895. [DOI] [PubMed] [Google Scholar]
- 9.Dikmen SS, Temkin NR, Miller B, et al. Neurobehavioral effects of phenytoin prophylaxis of posttraumatic seizures. JAMA. 1991 Mar 13;265(10):1271–7. [PubMed] [Google Scholar]
- 10.Massagli TL. Neurobehavioral effects of phenytoin, carbamazepine, and valproic acid: implications for use in traumatic brain injury. Archives of Physical Medicine and Rehabilitation. 1991 Mar;72(3):219–26. [PubMed] [Google Scholar]
- 11.Temkin NR, Dikmen SS, Anderson GD, et al. Valproate therapy for prevention of posttraumatic seizures: a randomized trial. J Neurosurg. 1999 Oct;91(4):593–600. doi: 10.3171/jns.1999.91.4.0593. [DOI] [PubMed] [Google Scholar]
- 12.Kharatishvili I, Immonen R, Grohn O, et al. Quantitative diffusion MRI of hippocampus as a surrogate marker for post-traumatic epileptogenesis. Brain. 2007 Dec;130(Pt 12):3155–68. doi: 10.1093/brain/awm268. [DOI] [PubMed] [Google Scholar]
- 13.Frey LC, Hellier J, Unkart C, et al. A novel apparatus for lateral fluid percussion injury in the rat. Journal of Neuroscience Methods. 2009 Mar 15;177(2):267–72. doi: 10.1016/j.jneumeth.2008.10.022. [DOI] [PMC free article] [PubMed] [Google Scholar]
- 14.Farias SE, Frey LC, Murphy RC, et al. Injury-related production of cysteinyl-leukotrienes contributes to brain damage following experimental traumatic brain injury. J Neurotrauma. 2009;26:1977–86. doi: 10.1089/neu.2009.0877. [DOI] [PMC free article] [PubMed] [Google Scholar]
- 15.Hamm RJ. Neurobehavioral assessment of outcome following traumatic brain injury in rats: An evaluation of selected measures. J Neurotrauma [Review] 2001;18(11):1207–16. doi: 10.1089/089771501317095241. [DOI] [PubMed] [Google Scholar]
- 16.Chen K, Neu A, Howard AL, et al. Prevention of plasticity of endocannabinoid signaling inhibits persistent limbic hyperexcitability caused by developmental seizures. J Neurosci. 2007 Jan 3;27(1):46–58. doi: 10.1523/JNEUROSCI.3966-06.2007. [DOI] [PMC free article] [PubMed] [Google Scholar]
- 17.Echegoyen J, Armstrong C, Morgan RJ, et al. Single application of a CB1 receptor antagonist rapidly following head injury prevents long-term hyperexcitability in a rat model. Epilepsy Research. 2009 Jul;85(1):123–7. doi: 10.1016/j.eplepsyres.2009.02.019. [DOI] [PMC free article] [PubMed] [Google Scholar]
- 18.Altman DG. Practical Statistics for Medical Research. New York: Chapman and Hall; 1991. [Google Scholar]
- 19.Annegers JF, Hauser WA, Coan SP, et al. A population-based study of seizures after traumatic brain injuries. The New England Journal of Medicine. 1998 Jan 1;338(1):20–4. doi: 10.1056/NEJM199801013380104. [DOI] [PubMed] [Google Scholar]
- 20.Immonen RJ, Kharatishvili I, Grohn H, et al. Quantitative MRI predicts long-term structural and functional outcome after experimental traumatic brain injury. NeuroImage. 2009 Mar 1;45(1):1–9. doi: 10.1016/j.neuroimage.2008.11.022. [DOI] [PubMed] [Google Scholar]
- 21.Fujimoto ST, Longhi L, Saatman KE, et al. Motor and cognitive function evaluation following experimental traumatic brain injury. Neuroscience and Biobehavioral Reviews. 2004;28:365–78. doi: 10.1016/j.neubiorev.2004.06.002. [DOI] [PubMed] [Google Scholar]
- 22.Liang LP, Ho YS, Patel M. Mitochondrial superoxide production in kainate-induced hippocampal damage. Neuroscience. 2000;101(3):563–70. doi: 10.1016/s0306-4522(00)00397-3. [DOI] [PubMed] [Google Scholar]
- 23.Floyd CL, Golden KM, Black RT, et al. Craniectomy position affects morris water maze performance and hippocampal cell loss after parasagittal fluid percussion. J Neurotrauma. 2002 Mar;19(3):303–16. doi: 10.1089/089771502753594873. [DOI] [PubMed] [Google Scholar]
- 24.Winn HR, Temkin NR, Anderson GD, et al. Magnesium for neuroprotection after traumatic brain injury. Lancet Neurology. 2007 Jun;6(6):478–9. doi: 10.1016/S1474-4422(07)70116-3. [DOI] [PubMed] [Google Scholar]
- 25.Dichter M. Posttraumatic epilepsy: The challenge of translating discoveries in the laboratory to pathways to a cure. Epilepsia. 2009;50(Suppl. 2):41–5. doi: 10.1111/j.1528-1167.2008.02009.x. [DOI] [PubMed] [Google Scholar]
- 26.Marmarou A, Signoretti S, Fatouros PP, et al. Predominance of cellular edema in traumatic brain swelling in patients with severe head injuries. J Neurosurg. 2006 May;104(5):720–30. doi: 10.3171/jns.2006.104.5.720. [DOI] [PubMed] [Google Scholar]
- 27.Marmarou A. A review of progress in understanding the pathophysiology and treatment of brain edema. Neurosurg Focus. 2007;22:E1–11. doi: 10.3171/foc.2007.22.5.2. [DOI] [PubMed] [Google Scholar]
- 28.Kharatishvili I, Sierra A, Immonen RJ, et al. Quantitative T2 mapping as a potential marker for the initial assessment of the severity of damage after traumatic brain injury in rat. Experimental Neurology. 2009 May;217(1):154–64. doi: 10.1016/j.expneurol.2009.01.026. [DOI] [PubMed] [Google Scholar]
- 29.Nakasu Y, Nakasu S, Morikawa S, et al. Diffusion-weighted MR in experimental sustained seizures elicited with kainic acid. AJNR Am J Neuroradiol. 1995 Jun-Jul;16(6):1185–92. [PMC free article] [PubMed] [Google Scholar]
- 30.Tokumitsu T, Mancuso A, Weinstein PR, et al. Metabolic and pathological effects of temporal lobe epilepsy in rat brain detected by proton spectroscopy and imaging. Brain Research. 1997;744(1):57–67. doi: 10.1016/S0006-8993(96)01071-2. [DOI] [PMC free article] [PubMed] [Google Scholar]
- 31.Van Putten HP, Bouwhuis MG, Muizelaar JP, et al. Diffusion-weighted imaging of edema following traumatic brain injury in rats: effects of secondary hypoxia. J Neurotrauma. 2005;22:857–72. doi: 10.1089/neu.2005.22.857. [DOI] [PubMed] [Google Scholar]
- 32.Marks DA, Kim J, Spencer DD, et al. Seizure localization and pathology following head injury in patients with uncontrolled epilepsy. Neurology. 1995 Nov;45(11):2051–7. doi: 10.1212/wnl.45.11.2051. [DOI] [PubMed] [Google Scholar]
- 33.Diaz-Arrastia R, Agostini MA, Frol AB, et al. Neurophysiologic and neuroradiologic features of intractable epilepsy after traumatic brain injury in adults. Archives of Neurology. 2000 Nov;57(11):1611–6. doi: 10.1001/archneur.57.11.1611. [DOI] [PubMed] [Google Scholar]
- 34.D’Ambrosio R, Fender JS, Fairbanks JP, et al. Progression from frontal-parietal to mesial-temporal epilepsy after fluid percussion injury in the rat. Brain. 2005 Jan;128(Pt 1):174–88. doi: 10.1093/brain/awh337. [DOI] [PMC free article] [PubMed] [Google Scholar]
- 35.Kharatishvili I, Nissinen JP, McIntosh TK, et al. A model of posttraumatic epilepsy induced by lateral fluid-percussion brain injury in rats. Neuroscience. 2006 Jun 30;140(2):685–97. doi: 10.1016/j.neuroscience.2006.03.012. [DOI] [PubMed] [Google Scholar]
- 36.Pitkanen A, Immonen RJ, Grohn OH, et al. From traumatic brain injury to posttraumatic epilepsy: what animal models tell us about the process and treatment options. Epilepsia. 2009 Feb;50(Suppl 2):21–9. doi: 10.1111/j.1528-1167.2008.02007.x. [DOI] [PubMed] [Google Scholar]
- 37.Levin HS, Eisenberg HM, Gary HE, et al. Intracranial hypertension in relation to memory functioning during the first year after severe head injury. Neurosurgery. 1991;28:196–200. doi: 10.1097/00006123-199102000-00004. [DOI] [PubMed] [Google Scholar]
- 38.Feldmann H, Klages G, Gartner F, et al. The prognostic value of intracranial pressure monitoring after severe head injuries. Acta Neurochir Suppl (Wien) 1979;28:74–7. doi: 10.1007/978-3-7091-4088-8_15. [DOI] [PubMed] [Google Scholar]
- 39.Janigro D. Not again! The role of blood-brain barrier failure in epileptogenesis: A molecular update. Epilepsy Currents / American Epilepsy Society. 2010;10:67–9. doi: 10.1111/j.1535-7511.2010.01359.x. [DOI] [PMC free article] [PubMed] [Google Scholar]
- 40.Weiss GH, Feeney DM, Caveness WF, et al. Prognostic factors for the occurrence of posttraumatic epilepsy. Archives of Neurology. 1983 Jan;40(1):7–10. doi: 10.1001/archneur.1983.04050010027006. [DOI] [PubMed] [Google Scholar]
- 41.Weiss GH, Salazar AM, Vance SC, et al. Predicting posttraumatic epilepsy in penetrating head injury. Archives of Neurology. 1986 Aug;43(8):771–3. doi: 10.1001/archneur.1986.00520080019013. [DOI] [PubMed] [Google Scholar]
- 42.Obenaus A, Robbins M, Blanco G, et al. Multi-modal magnetic resonance imaging alterations in two rat models of mild neurotrauma. J Neurotrauma. 2007;24:1147–60. doi: 10.1089/neu.2006.0211. [DOI] [PubMed] [Google Scholar]