Significance
Corvid songbirds show remarkable cognitive abilities. The executive brain area nidopallium caudolaterale (NCL) is thought to mediate flexible behavior and cognition in birds, similar to the independently evolved prefrontal cortex in mammals. Here, we show that NCL neurons in crows change their responses during associative learning tasks to signal which stimuli belong together. NCL activity mapped distinct visual stimuli to a common associated response by grouping them according to their meaning. During association learning, such goal-oriented prospective representations are rapidly established within minutes of encountering previously unknown stimuli. By enabling a common, behaviorally meaningful code for both novel and highly familiar stimuli based on their required responses, NCL neuronal activity is ideally suited for executive control of flexible, goal-driven behavior.
Keywords: association learning, crow, single-cell recordings, nidopallium caudolaterale, memory
Abstract
The ability to form associations between behaviorally relevant sensory stimuli is fundamental for goal-directed behaviors. We investigated neuronal activity in the telencephalic area nidopallium caudolaterale (NCL) while two crows (Corvus corone) performed a delayed association task. Whereas some paired associates were familiar to the crows, novel associations had to be learned and mapped to the same target stimuli within a single session. We found neurons that prospectively encoded the chosen test item during the delay for both familiar and newly learned associations. These neurons increased their selectivity during learning in parallel with the crows' increased behavioral performance. Thus, sustained activity in the NCL actively processes information for the upcoming behavioral choice. These data provide new insights into memory representations of behaviorally meaningful stimuli in birds, and how such representations are formed during learning. The findings suggest that the NCL plays a role in learning arbitrary associations, a cornerstone of corvids’ remarkable behavioral flexibility and adaptability.
The ability to form arbitrary associations between sensory stimuli is fundamental for many flexible goal-directed behaviors. Corvids exploit learned associations intensively when adapting their behavior to a changing environment (1, 2). For example, scrub jays learn to associate different foods with different degradation speeds as a component of their episodic-like memory during food-caching behavior (3). The neuronal basis of corvids’ ability to learn arbitrary associations has never been investigated.
The avian cognitive integration area nidopallium caudolaterale (NCL) is a good candidate to investigate learning-related changes in the representation of initially unknown stimuli, as they acquire behavioral meaning during association learning. We have recently demonstrated that single NCL neurons encode abstract behavioral rules, irrespective of the arbitrary, learned cues used to instruct the rule (4). Furthermore, pigeons with lesions of the NCL show deficits in a reversal learning task, indicating that the NCL is a crucial structure to flexibly adapt behavior based on feedback during learning (5). The NCL is the main pallial target of dopaminergic projections from the midbrain (6), and dopamine signaling in striatal and cortical structures is involved in learning and memory processes in birds, as in mammals (7).
Here we investigate changes in the neuronal representation while associative learning links arbitrary visual items in memory. We trained two carrion crows on a delayed paired-association learning (DPA) task and recorded NCL neurons during the course of learning. The task design allowed us to compare neuronal responses during the mapping of highly familiar images onto test items, as well as to follow the emergence of associative signals in the same neurons while the crows learned to map novel sample images onto the same test items.
Results
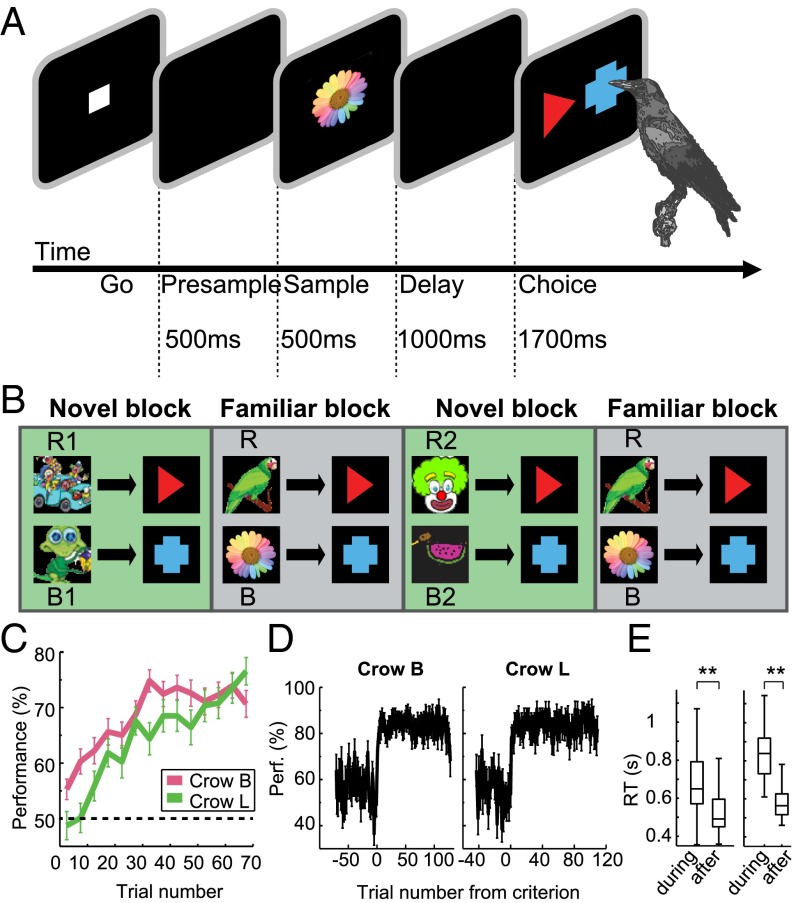
Two crows performed a visual delayed-association task in which one of two sample images was uniquely associated with one of two choice images (red triangle or blue cross, respectively, presented at randomized positions) (Fig. 1A). Two types of association tasks were shown in daily sessions in separate trial blocks: The first trial block per session was a “novel” block, in which crows had to learn by trial and error which of the two novel sample images (R1-B1) was associated with the red or blue choice, respectively (Fig. 1B, Left). The two test images were kept constant, while the sample images were exchanged for each new association block. After the crows acquired this novel association, a second, “familiar” trial block followed, during which the crows had to associate well-known paired associates (R-B) to the same two test items based on long-term memory, without a learning requirement (Fig. 1B, Center). After 60 correct trials in the familiar trial block, a further novel trial block was shown with new sample images. The crow again had to learn to associate samples with the proper choice items, followed by another familiar trial block.
Fig. 1.
Association learning task and behavioral performance. (A) Behavioral protocol: The crows initiated a trial by moving their heads in front of the screen during presentation of the go-stimulus. A sample stimulus, uniquely associated with one of the test items, was presented for 500 ms, followed by a 1,000-ms delay. In the choice period, the same two test stimuli were presented on all trials with randomized positions (left/right). (B) Blocks requiring the learning of new associations (novel blocks) were alternated with blocks presenting well-known sample pictures with known associations to the same two test items (familiar blocks). A typical session consisted of two novel and two familiar blocks. Sample pictures R1 and R2 were novel sample pictures associated with the red test item, sample pictures B1 and B2 were novel sample pictures associated with the blue test item. Familiar blocks always presented the same two familiar sample pictures (R and B) with known associations to the red and blue test item, respectively. (C) Average behavioral performance during all successful novel blocks, averaged in bins of five trials. Error bars indicate SEM. (crow B n = 135 successful novel blocks, crow L n = 87 successful novel blocks). (D) Behavioral performance for crow B and crow L, aligned by the learning criterion. A criterion trial was determined for each session separately from the succession of correct and error responses. (E) Reaction times for crow B and crow L before and after the criterion trial. Boxes show median and second and third quartile, whiskers show range of data or 1.5-times interquartile range. Significant difference: **P < 0.01.
Behavioral Performance.
During novel blocks, both crows started at chance performance (45% and 52% on the first trial, both P > 0.05, binomial test against 50% chance) and reached ∼75% correct after 70 trials (Fig. 1C; example session in Fig. S1A). We used a state-space model of dynamic learning (8) to estimate a learning criterion; that is, the first trial of each block after which the behavior of the crow was reliably above chance. This learning criterion was later used to compare neuronal activity during and after learning the novel associations. A learning criterion could be determined for 135 (91%) associations for crow B, and 87 (85%) associations for crow L (learned associations; see SI Materials and Methods). The criterion was reached after a median of 43 trials for crow B (23 correct trials), and 56 trials for crow L (32 correct trials).
Fig. S1.
Learning behavior. (A) An example session showing behavioral performance, reaction times, as well as individual correct and error trials (black and gray dots above the Top panel) over two novel and two familiar blocks. (B) All individual successful sessions for crow B, aligned and sorted by criterion trial. Error trials are light blue squares, correct trials black squares. The white line shows the criterion trial. In most sessions, there was a relatively steep improvement in performance after the criterion trial. (C) All individual successful sessions for crow L, as in B.
The birds reached a mean performance of 85% and 86% after the criterion trial, with performance for all trials before the criterion at 53% and 54%, respectively. For the 10 trials immediately before and after the criterion, performance was 53% and 82% for crow B, and 55% and 82% for crow L. This finding indicates a relatively sudden increase in performance around the criterion (Fig. 1D; see Fig. S1 B and C for individual sessions). Learning was also reflected by a change in reaction times, which decreased by 24% from 650 ms to 491 ms for crow B, and by 33% from 838 ms to 564 ms for crow L after the criterion trial (Fig. 1E). Performance in familiar blocks was 98% and 96% and reaction times 348 ms and 351 ms.
NCL Neurons Show Associative Selectivity.
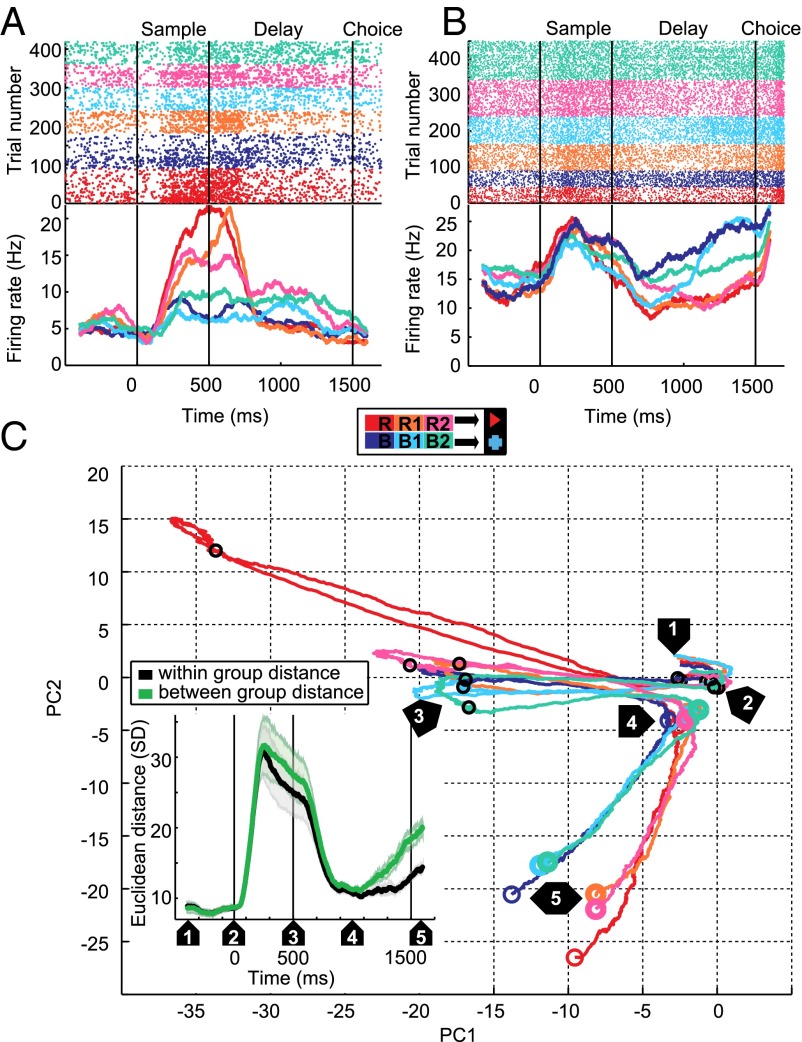
We recorded the activity of 342 neurons in the NCL of two behaving carrion crows. The block structure of the task allowed us to compare neuronal responses for well-known and for new samples associated with the same test items. Many neurons seemed to respond to sample items as a function of the associated test item. We call this prospective encoding of the upcoming paired associate “associative selectivity.” For example, the neuron in Fig. 2A selectively increased its firing rate for the sample items associated with the red test item during the sample period of the familiar block and each of the novel blocks. Fig. 2B shows a neuron which selectively increased its firing rate in the delay period following all three samples associated with the blue test item.
Fig. 2.
Associative activity was a prominent feature in the recorded population of single neurons. (A) Example neuron that discriminates between samples based on the associated test item (red or blue). (Upper) Dot raster showing the neuron’s response in individual trials, ordered by blocks and sample item (R, B familiar block; R1, B1 first novel block; R2, B2 second novel block). (Lower) Peri-stimulus time histogram (PSTH) obtained by averaging the dot raster and smoothing with a 200-ms boxcar window. Time 0 is sample onset. Responses from both familiar blocks are pooled. (B) Example neuron preferring all sample stimuli associated with the blue test item in the delay period. (C) Pseudo-simultaneous population response, visualized using PCA. Only the first two principal components are shown. Activity is shown from the start of the presample period (“1”) until the beginning of the choice period, as in the PSTHs in A and B. Small black circles mark the onset (“2”) and offset (“3”) of the sample period, large colored circles mark the onset (“4”) and offset (“5”) of the analysis window in the second half of the delay period, designed to capture associative activity. The Inset shows average Euclidean distance between different activity patterns in the high-dimensional space, grouped by sample pairs associated with the same test item (within group distance) and samples associated with different test items (between group distance).
To evaluate the prevalence of associative selectivity in the entire population, without relying on preselection of neurons or analysis windows, we visualized all recorded neurons’ responses to the six samples using principal component analysis (PCA) (Fig. 2C and Fig. S2). The trajectory of population activity showed different activity patterns for all six sample stimuli during the sample period (Fig. 2C, timepoint 2–3), but clear differences between samples associated with the blue and red test item, respectively, throughout the last part of the delay period (Fig. 2C, timepoint 4–5) (associative selectivity). To quantify this effect using the complete space, without dimensionality reduction, we evaluate Euclidean distance between different activity patterns. The distance in the high-dimensional space spanned by the firing rates of all neurons was high during sample and delay periods (Fig. 2C, Inset). Only in the second half of the delay period, however, we observed a higher distance between samples associated with different test items (between group distance), indicating similar population activity for samples associated with the same test, but disparate responses for samples associated with different test items.
Fig. S2.
PCA details. (A) Percent variance accounted for by the first 20 principal components. Only the first three principal components contributed substantial amount of variance. (B) Distribution of weights for 290 individual neurons contributing to the first principal component. Neurons are ordered by their weights. (C) Distribution of weights for 290 individual neurons contributing to the second principal component. (D) Pseudo-simultaneous population response, visualized using PCA, corresponding to Fig. 2C. The first three principal components are shown. Activity is shown from the start of the presample period (“1”) until the beginning of the choice period, as in the PSTHs in A and B. Small black circles mark the onset (“2”) and offset (“3”) of the sample period, large colored circles mark the onset (“4”) and offset (“5”) of the analysis window in the second half of the delay period, designed to capture prospective activity.
Thus, in the late delay period but not the sample period, neurons seemed to prospectively associate the correct upcoming choice in their selective ramping activity by categorically grouping samples depending on the learned associated test item. This effect is clearly visible using simple dimensionality reduction of the entire recorded neuronal population. In novel blocks, the associated test item is initially unknown, and needs to be learned by trial and error. We therefore asked when this task-relevant representation of the test item developed during the learning process.
Associative Selectivity Increased with Learning.
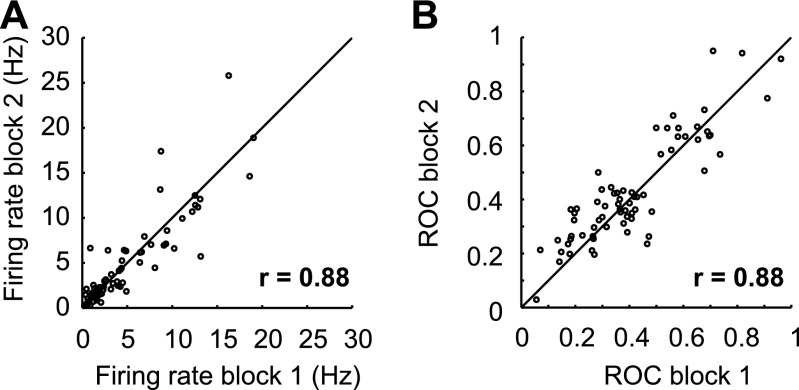
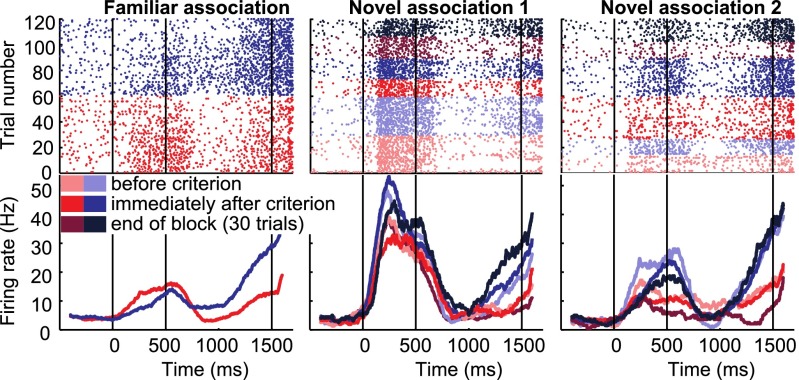
To examine changes in associative activity during learning, we concentrated on neurons that showed selective activity during familiar sample images during the delay period (93 of 342 neurons, 27%; P < 0.05, rank sum test). If two familiar blocks were recorded, trials from the first and second familiar block were pooled to determine familiar selectivity. Recordings were stable across blocks; no significant difference in firing rates (P = 0.12, Wilcoxon signed rank test) or selectivity (P = 0.35, Wilcoxon signed rank test) (Fig. S3) were detected in selective neurons contributing two familiar blocks (n = 69). In these familiar-selective neurons associative selectivity often developed during novel blocks. For example, the neuron in Fig. 3 showed selective delay activity for the sample mapped onto the blue test item in familiar trials. In both novel blocks, this neuron also showed higher delay firing rates for the sample associated with the same test item. Furthermore, the difference between the samples increased over time in both blocks (Fig. 3).
Fig. S3.
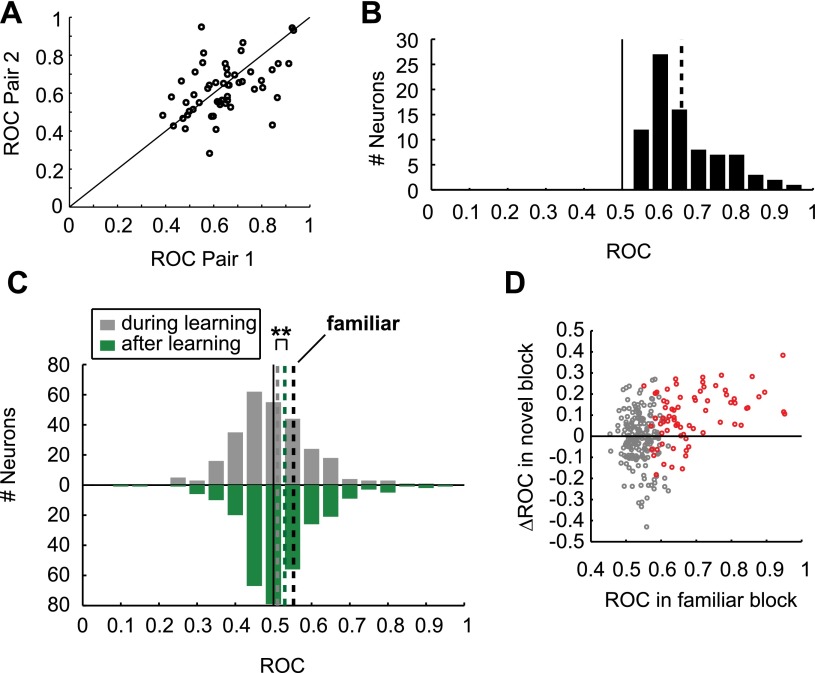
Responses are stable across familiar blocks. (A) Firing rate in the delay window in the first and second familiar block, for neurons that were recorded for two familiar blocks (n = 69). (B) ROC values, discriminating responses to the familiar red and blue samples in both familiar blocks for neurons that were recorded in two familiar bocks (n = 69).
Fig. 3.
Association-selective example neuron. Example neuron preferring the sample associated with the blue test item in the delay period of each block. Red and blue colors indicate different associated test items, shading represents different periods within the novel blocks. Vertical lines mark the onset of the sample (0 ms), delay (500 ms), and test periods (1,500 ms).
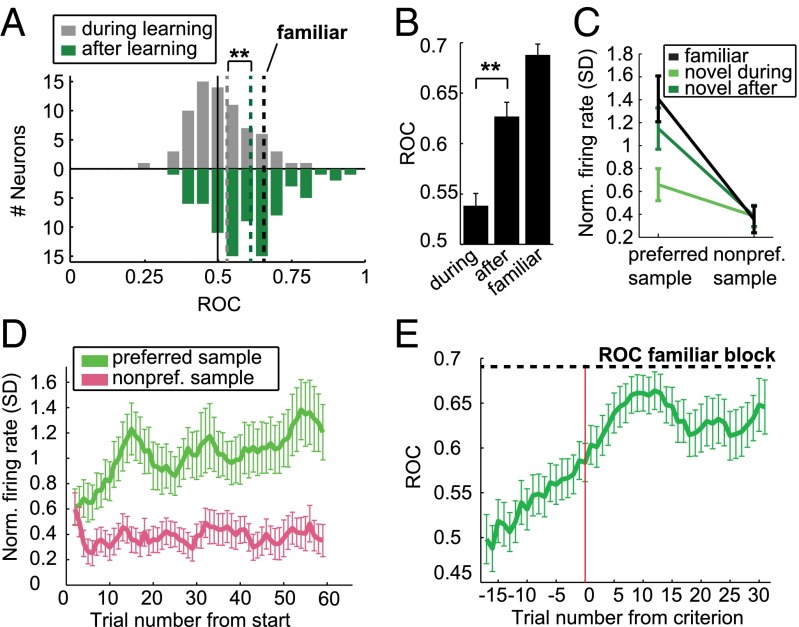
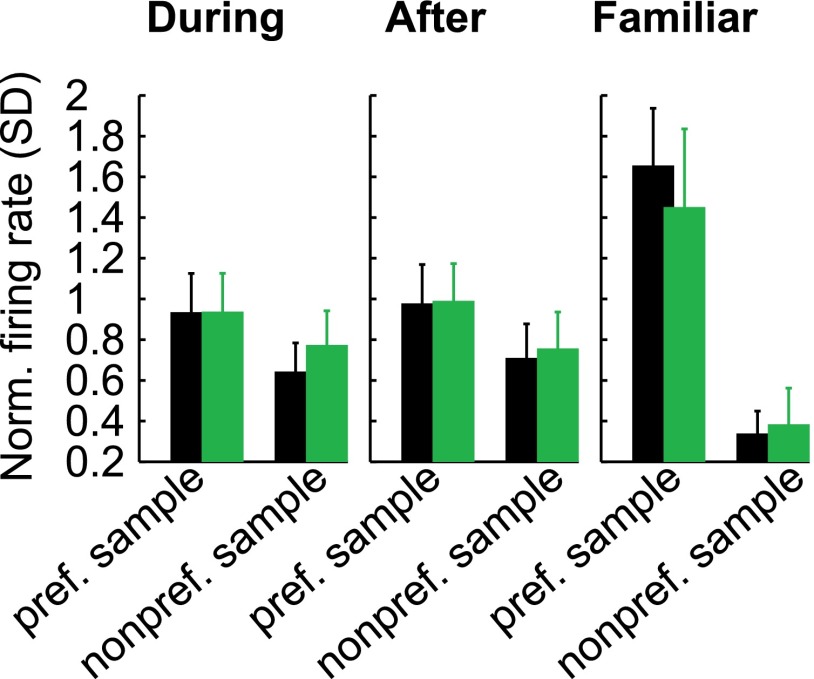
We calculated the area-under-the-receiver operating-characteristic curve (AUROC) to quantify this increase in associative selectivity by comparing firing rates in a late delay period window for the two different samples in each block. AUROC is a measure for the discriminability of two distributions, with both 0 and 1 indicating perfect separation, and values of 0.5 indicating no selectivity. We defined the reference distribution based on the preferred sample in the familiar block, so that ROC values in the familiar block were always higher than 0.5, associative neurons would have ROC values higher than 0.5 in novel blocks, and novel blocks with opposite selectivity as the familiar block would have ROC values lower than 0.5. During learning, the mean novel block AUROC value of all familiar-selective cells was 0.54 (Fig. 4A; averaged across novel blocks for neurons which were recorded for two novel blocks; individual blocks are shown in Fig. S4A). After the criterion trial, the distribution of ROC values had shifted toward the ROC values during familiar blocks [mean 0.63 (Fig. 4A), familiar mean: 0.69 (Fig. S4B)], a significant increase (P < 0.01, Wilcoxon signed rank test) (Fig. 4B). A similar, but weaker, learning-related increase in prospective selectivity is present in the entire recorded population (n = 309, P < 0.01, Wilcoxon signed rank test) (Fig. S4C). The absence of neurons tuned in the opposite direction as the familiar block after learning in Fig. 4A indicates that all neurons that showed strong selectivity in novel blocks were associative, and these neurons were the ones driving the learning effects (Fig. S4D). The increase in associative selectivity came almost exclusively from an increase in discharge rate to the preferred sample after learning, with no change in firing rate to the nonpreferred sample (Fig. 4C).
Fig. 4.
Association selectivity increased with learning. (A) Histogram of individual neurons’ ROC values in novel blocks before the criterion trial and after the criterion trial, for all neurons exhibiting selectivity in familiar blocks. The reference distribution is chosen based on the preferred sample in the familiar block, so that familiar ROC values are always between 0.5 and 1; neurons preferring the same item in novel blocks also have ROC values between 0.5 and 1. Dotted colored lines show median of distributions, dotted black line shows median ROC in familiar blocks. (B) Average ROC values for all selective neurons in novel blocks before and after learning, as well as in familiar blocks. Error bars show SEM; significant difference: **P < 0.01. (C) Normalized tuning curves (SD above baseline firing rate) for novel and familiar blocks. Error bars show SEM, preferred item is defined in familiar blocks. (D) Normalized firing rate to the preferred and nonpreferred sample item for all selective neurons (defined in the familiar block) during novel blocks. Error bars indicate SEM. (E) ROC values discriminating between the two sample items in novel blocks, calculated in a seven-trial moving window, aligned by the learning criterion (red line). Dotted line indicates average ROC value in familiar blocks.
Fig. S4.
Associative selectivity in novel and familiar blocks. (A) ROC values in both individual novel blocks for neurons that were recorded for two novel blocks (n = 53), confirming that selectivity was largely similar across blocks. (B) Histogram of ROC values in familiar blocks, as in Fig. 4A. (C) Comparison of ROC values in novel blocks during learning and after learning, as in Fig. 4A, but for all recorded neurons, regardless of selectivity in familiar blocks. Significant difference: **P < 0.01. (D) Individual neurons’ ROC values in familiar blocks, and change in ROC values during novel blocks, confirming that prospective responses are driven by familiar-selective neurons. Red dots indicate neurons with significant selectivity in familiar blocks, analyzed in Figs. 4 and 5.
Associative Activity Develops Rapidly at the Start of New Blocks.
The trial-by-trial course of firing rates to the preferred and nonpreferred sample revealed an absence of selectivity in the first three trials (P > 0.05, Wilcoxon signed rank test, n = 83). However, firing to the nonpreferred sample sharply decreased during the first few trials of a new block, and increased for the preferred sample (Fig. 4D). Similarly, aligning ROC values by learning criterion showed that, on average, ROC values start out at 0.5 (not selective) but begin increasing steadily well before the criterion is reached (Fig. 4E). In comparison with behavior aligned by the same criterion trial (Fig. 1D), associative selectivity changed less abruptly over the learning process.
Association Strength Was Weaker or Reversed in Error Trials.
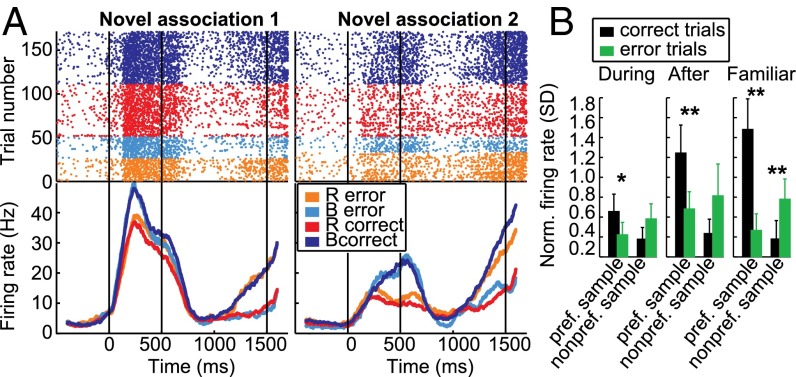
During the learning of novel associations, NCL neurons developed delay selectivity with the same group preference and similar selectivity strength as in familiar blocks. These results suggest that a task-relevant representation was formed in the NCL, which could be a neural signature of the crow preparing its response to the associated red or blue test item. To evaluate the behavioral relevance of this representation, we examined associative selectivity in error trials, when the crow was preparing the wrong response. Fig. 5A shows the same example neuron as in Fig. 3 during novel blocks (there were not enough error trials in familiar blocks). In both blocks, delay period activity in error trials was opposite to that in correct trials, so that the neural activity was reflecting the bird’s behavior (red or blue choice) and not the presented sample item. In all neurons, the average firing rate to the preferred sample during error trials was reduced in novel and familiar blocks, and firing rate to the nonpreferred sample was increased in familiar blocks (all P < 0.05, Wilcoxon signed rank test) (Fig. 5B).
Fig. 5.
Association selectivity was weaker in error trials. (A) The same example neuron as in Fig. 3 for correct and error trials. Delay activity in error trials corresponded to the bird’s behavioral decision, not to the presented sample stimulus. (B) Average tuning curves in correct and error trials during all trials before the learning criterion, after the criterion, and in familiar blocks. Error bars show SEM; significant difference: **P < 0.01, *P < 0.05.
Sample Period Activity Did Not Show Prospective Selectivity, and Did Not Change with Learning.
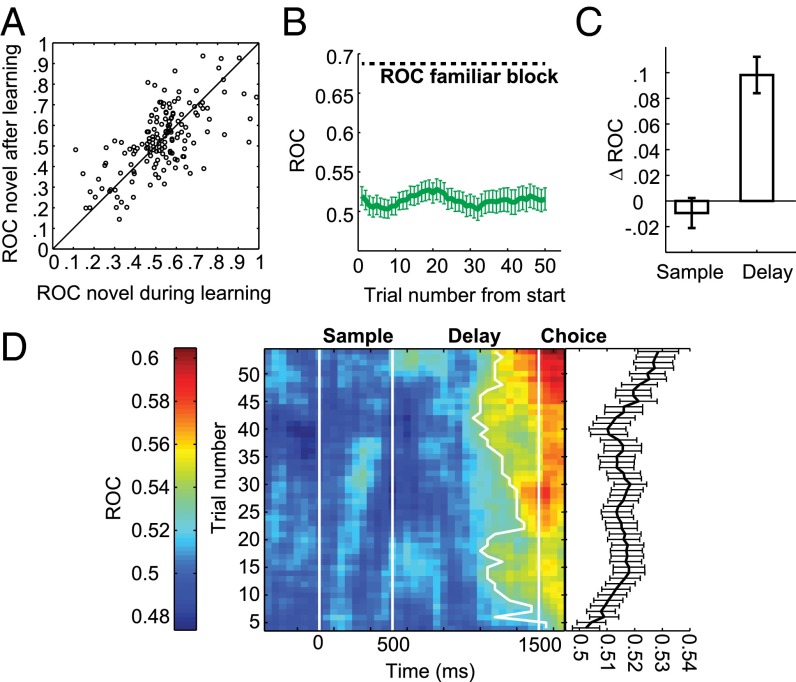
In summary, these results show that NCL neurons developed associative selectivity in the delay period during the learning of new associations, forming a task-relevant representation of the upcoming behavioral choice. When does this prospective representation emerge during the trial? Sample-selective neurons did not show similar tuning in novel and familiar blocks (Fig. 6A) (mean ROC in novel blocks: 0.52) and there was no change in associative selectivity with learning (Fig. 6 B and C) (P = 0.48 Wilcoxon signed rank test). Similarly, there was no significant difference between firing rates in correct and error trials in any block (Fig. S5) (all P > 0.05, Wilcoxon signed rank test). Therefore, a neural signature of response preparation appeared only in the delay period window. Examining the temporal incidence of selectivity without relying on specific analysis windows also reveals no consistent difference in the point of time when selectivity appears within the delay period as learning progressed (Fig. 6D). Therefore, only the strength but not latency of the prospective choice representation in the NCL changes with learning.
Fig. 6.
Sample period activity did not show associative selectivity, and did not change with learning. (A) All individual ROC values in novel blocks, before and after learning, for neurons selective in the sample period. Note the large number of neurons with ROC values between 0 and 0.5, indicating opposite selectivity as in familiar blocks. (B) Trial-by-trial ROC values, calculated in a seven-trial moving window in the sample period during novel blocks. (C) Average change in ROC values comparing all trials before the learning criterion and all trials after the learning criterion for neurons selective in the sample or delay phase. Error bars indicate SEM. (D, Right) average selectivity in the entire trial. (Left) Within-trial development of associative selectivity during novel blocks, calculated in a 200-ms and 10-trial window, advanced in steps of 50 ms and 1 trial. White lines mark beginning and end of sample period and delay period. Thick white line shows earliest appearance of selectivity strength of half the maximum selectivity in any given trial.
Fig. S5.
No error trial effects in the sample period. Average tuning curves in correct and error trials during the sample period. There was no significant difference between correct and error trials in any block.
SI Materials and Methods
Subjects.
One female (crow L) was obtained from the institute’s breeding facilities, hand-raised, and was 10-mo-old at the start of recording; one male bird (crow B) was obtained from a bird rescue station as a juvenile accustomed to humans and was estimated to be 1-y-old at the start of recording. The crows were housed in social groups in spacious indoor aviaries (39).
The CORTEX program (National Institute of Mental Health) was used for experimental control and behavioral data acquisition. Visual stimuli were displayed on a touchscreen monitor (ART development MT1500-BS, 15'', 60-Hz refresh rate). The size of sample and test images was ∼20 × 20 mm.
Surgery.
All surgeries were performed while the animals were under general anesthesia and the crows received postoperative analgesics. The head was placed in the stereotaxic holder that was customized for crows with the anterior fixation point (i.e., beak bar position) 45° below the horizontal axis of the instrument. Two custom-built microdrives with four glass-coated tungsten microelectrodes (2 MΩ impedance; Alpha Omega) each were implanted using stereotaxic coordinates (center of craniotomy: AP 5 mm; ML 13 mm). Coordinates were obtained by identifying the NCL through immunohistochemical staining of tyrosine-hydroxylase–positive fibers in brain sections of different crows (4). Electrodes were implanted targeting the NCL in the left hemisphere in crows B and L, and targeting the right NCL in crow B. At the start of each session the electrodes were advanced manually until good single-unit signals were obtained. Each microdrive was advanced ∼4 mm to record across the NCL at different depths over a period of several weeks (77 recording sessions for crow B, 51 recording sessions for crow L).
Signal amplification, filtering, and digitizing of spike waveforms was accomplished using the Plexon system. Single-cell waveform separation was performed off-line (Plexon Systems).
Data Analysis.
Learning criterion.
We used a state-space model of dynamic learning (8) to estimate the learning curve (i.e., the probability of a correct response as a function of trial number) from the behavioral data. The software (www.neurostat.mit.edu/software) uses Bayesian analysis of the state-space model to determine the earliest trial in each block when the bird was performing reliably above chance. The learning curve is computed along with its upper and lower 95% confidence bounds, and we defined the learning trial as the first trial after which there is 95% certainty that the bird is performing better than chance for the next 40 trials. During recordings, we presented a total of 149 new associations to crow B and 103 new associations to crow L. A learning criterion could be determined in 135 (91%) associations for crow B and 87 (85%) associations for crow L (successful associations). An association was considered not learned if the algorithm failed to converge, if it did not find a criterion (i.e., the performance of the crow was never reliably above chance), or if the criterion was found only after more than 300 completed trials.
PCA analysis.
For the analysis of the entire population (Fig. 2C), each neuron’s activity was normalized to units of SD from baseline, averaged over trials in one condition, and smoothed with a 150-ms boxcar window. Fifty-two neurons were excluded from this analysis because they did not have data for each of the six sample pictures. The responses of all neurons to the six different sample pictures can be seen as forming a trajectory in the 290-dimensional space spanned by the firing rates of the 290 remaining neurons. We then performed PCA for dimensionality reduction and display only the first two principal components in Fig. 2C. Fig. S2 shows the response variance accounted for by the first 20 principal components, as well as the weights of all 290 neurons contributing to the first and second principal components.
ROC analysis.
ROC is a measure for the separability of two distributions derived from signal detection theory (40). AUROC values were calculated based on the response rates in the analysis window. The AUROC curve measures neuronal selectivity, with values of 0.5 indicating no selectivity (complete overlap of two distributions), and both 0 and 1 indicating perfect separation of two distributions. Discharge rates for the nonpreferred sample in the familiar block were taken as reference distribution (“noise” distribution), whereas response rates to the preferred sample in familiar blocks were used as test distribution (“noise + signal” distribution). Therefore, all selective neurons had ROC values higher than 0.5 in the familiar blocks. In novel blocks, neurons with selectivity for the same test item (associative selectivity) had ROC values higher than 0.5, whereas nonselective neurons had ROC values around 0.5 and neurons with opposite selectivity than in familiar blocks had ROC values lower than 0.5.
ROC values in Fig. 4A were obtained by taking the distribution of firing rates in all trials before or after the learning criterion, respectively, for those associations that had at least three trials for each condition before the criterion (n = 103). In addition, a sliding ROC analysis was performed in a seven-trial window that was advanced in steps of one trial and aligned by the criterion for each association (Fig. 4E). For Fig. 6D, a sliding ROC analysis was performed in a 200 ms and 10-trial window that was advanced in steps of 50 ms and one trial.
Discussion
We report a neuronal correlate of association learning in corvid NCL, a cognitive integration area in the avian brain. Crows performed a DPA learning task that required mapping both familiar and novel samples to the same test items. The crows quickly acquired new associations, allowing the investigation of changes to the neuronal representation in behaving animals, as novel stimuli acquired behavioral meaning over the learning process. Single neurons prospectively encoded the upcoming behavioral choice during the delay but not during presentation of the sample. The selectivity strength of this task-relevant associative representation increased during learning, in parallel with the crows’ improved behavioral performance and faster reaction times. Prospective selectivity was weaker in error trials, indicating that the birds rely on this representation in the NCL when preparing and choosing a response.
The prospective representation of the behavioral choice and learning-related changes appeared in the end of the delay period, just before choice onset. No such representation was found in the sample period. Individual neurons exhibited strong selectivity for different sample pictures in the sample period (Figs. 2 A and C and 6A), in agreement with our recent reports of sample-selective activity in working-memory tasks (9, 10). However, neurons did not group samples according to functional categories, and no consistent change of this selectivity was observed with learning (Fig. 6 A and B). This finding suggests that selectivity in the sample period might be purely visual selectivity without connection to the associated test item or the crows’ behavior, an interpretation that is reinforced by the lack of error trial effects in this period.
This switch from a sample-based representation in the sample and early delay periods, and a test stimulus-based representation in the late-delay period corresponds well with behavioral data. Although we did not test the behavioral strategy used by the crows, behavioral evidence in pigeons suggests that they might switch from a retrospective to a prospective coding strategy depending on delay duration (11).
Monkeys seem to follow a similar behavioral strategy depending on delay duration (12). In primate prefrontal cortex (PFC), a functional analog of NCL, one study reports that prospective selectivity for long-term paired associates does not appear until the end of the delay period, whereas visual similarity is the only factor influencing selectivity in the sample period (13). All studies of association learning in primate PFC, however, consistently report that such selectivity shifts earlier in the trial as the monkeys learn the correct response (14–17), eventually reaching the cue period, when the animal can first start to prepare its response. This is also a typical finding in other studies of the PFC, where choice-related activity and error trial effects get stronger throughout the delay, but are also present in the sample period (18–20). Our findings strongly indicate that an associative representation in the NCL does not emerge until the second half of the delay period, and the latency of this selectivity does not seem to change with learning, in contrast to equivalent analyses of monkey PFC (Fig. 6D). Therefore, the time point when prospective activity appears is likely to reflect either different task-specific behavioral strategies or differences in general information processing patterns between primate and corvid brains.
How is association learning accomplished in mammalian and avian brains? Learned visual associations in monkeys are reflected by association-selective representations in higher visual areas of the temporal cortex (21, 22), with top-down activation by the PFC contributing to prospective representations of the choice picture to be recalled (19). Changes to stimulus-selective representations in higher sensory areas have also been reported in anesthetized starlings trained on auditory discriminations (23–25). Single neurons as well as population activity in auditory association areas contained information about the behavioral relevance of different sounds. Because we find a similar representation of novel and familiar stimuli with the same behavioral meaning, the NCL might be a source of an abstract task-relevant signal that biases representations in higher sensory areas to encode behaviorally meaningful stimuli, similar to the top-down signal from the PFC to the temporal cortex (19). Like the PFC, the NCL has reciprocal connectivity to all sensory association areas, putting it in a prime position for such executive control over sensory processing and behavior (6, 26).
However, the independent evolutionary origin of the NCL and PFC leads to certain anatomical differences, in particular their connectivity to the hippocampus. Primate hippocampus is a key brain area for association learning, with frequent demonstrations of learning-related activity (27–30). The PFC is intimately connected to the hippocampus, and prefrontal–hippocampal interactions seem to play a major role during association learning (17, 31). In contrast, the NCL has no direct connections to the hippocampus or surrounding structures (26, 32, 33). It is likely that this major anatomical difference could lead to differences in how the cognitive integration areas of birds and mammals process information during associative learning, such as the time point when prospective representations emerge in the trial.
Further differences to the PFC exist in the responses to familiar stimuli. After learning, novel stimuli were represented in the NCL in a categorical way according to their behavioral meaning, and resembling familiar reference samples with the same common associate. The formation of new associations between novel samples and familiar test items in our task likely involves different processes than the initial learning of the structure of the DPA learning task. Our results specifically show how novel stimuli can be rapidly linked to existing representations of upcoming choices, by activating neurons, which were already selective for the same associates. Therefore, the NCL forms an orderly prospective representation of different samples in a decision frame of reference, which applies to both familiar and newly learned associations. Such a task-relevant representation shows general parallels between the NCL and association cortices in the primate brain (14, 16, 34, 35), but also sets it apart from neuronal encoding in the PFC, where familiar, “overlearned” stimuli typically evoke only weak activity (14, 36; but see ref. 37). In contrast, we found the strongest discharge rates and strongest selectivity for highly familiar stimuli, with newly learned stimuli building up to this reference level over the learning process. Such a prospective representation reflecting the strength of the connection between stimuli seems ideally suited for a brain area thought to be involved in organizing goal-directed behavior (38).
In summary, we have shown that single neurons in the NCL, an avian cognitive association area, form a prospective working-memory representation of upcoming behavioral choices. These neurons discriminate both novel and familiar sample images based on their behavioral meaning. During novel blocks, delay selectivity rapidly increases over the course of ∼30 trials to resemble neuronal activity following highly familiar samples. These data suggest that NCL neurons play a role in learning arbitrary associations, a cornerstone of corvids’ remarkable behavioral flexibility and adaptability. The data highlight important parallels, but also differences, in the processing of learning-related activity in avian and mammalian executive brain areas.
Materials and Methods
Subjects and Apparatus.
Two juvenile carrion crows (Corvus corone corone) were used in these experiments. The crows were maintained on a controlled feeding protocol during the sessions and earned food during and after the daily tests. All animal preparations and procedures were approved by the local ethical committee (Regierungspräsidium Tübingen) and authorized by the national authorities (Regierungspräsidium Tübingen). The crows were trained in a controlled operant conditioning chamber, stimuli were presented on a touchscreen monitor, and the crows responded by selecting the appropriate item on the screen. Reward for correct trials was delivered by a custom-built automated feeder below the screen. An infrared light barrier in combination with a reflector attached to the crow’s head registered when the bird was positioned in front of the screen and facing it. For details see SI Materials and Methods.
Behavioral Protocol.
The crows initiated a trial (Fig. 1) by moving their head into the light barrier when a go-stimulus (white square, 11 × 11 mm) was shown on the screen. The crows had to keep their head still throughout the trial; if their head exited the light barrier, the trial was aborted. After 200 ms, the go-stimulus turned off, followed by a presample period without visual stimulation. Next, a sample stimulus was presented in the center of the screen, followed by a delay. The duration of the presample period was 500 ms, sample period 500 ms, and delay period 1,000 ms. Sample pictures were two arbitrary images (20 × 20 mm) that were exchanged for each novel block, and two arbitrary images (20 × 20 mm, bird and flower) (Fig. 1B) that were kept constant in the familiar block for several months.
In the choice period, two test items (red triangle and blue cross) were presented on the left and right side of the screen, ∼66 mm apart. The side of the screen on which each test item appeared on each trial was randomized and balanced. The crows indicated their choices by selecting one of the test images with their beak. If no response occurred within 1,700 ms, the trial was discarded. Correct choices were indicated by a 300-ms sound, as well as light on the automated feeder. Food reward was given in ∼60% of correct trials. Incorrect choices were indicated by a different 300-ms sound and 300-ms flash of the screen, and were followed by a short time-out (3 s) before the start of the next trial.
Different associations were presented in alternating trial blocks. Each session started with a novel trial block, in which two novel sample pictures (R1/B1) (Fig. 1B) were presented on separate trials pseudorandomly interleaved. Each sample picture was uniquely associated with one of the test items (red or blue), and the association had to be learned by trial and error. Each pair of sample pictures mapping onto the two test items is referred to as one association and analyzed together (i.e., one novel block represents one association). For online analysis during recording, an association was considered to be learned when the crow reached a performance above 80% during the last 40 trials. If the association was learned within 120 correct trials, the block was completed. If it was not learned within 120 trials, the block was continued until 180, 240, or 300 correct trials. Each novel block was followed by a familiar block, lasting 60 correct trials. In familiar blocks, two well-known sample pictures (R/B) (Fig. 1B) with known associations to the same two test items were presented pseudorandomly interleaved. The familiar block was followed by another novel block with two new unknown sample pictures (R2/B2) (Fig. 1B), and another familiar block. A typical session consisted of two novel blocks, lasting 120 correct trials each, and two familiar blocks, lasting 60 correct trials each (Fig. 1B and Fig. S1).
Surgery and Recordings.
All surgeries were performed while the animals were under general anesthesia and the crows received postoperative analgesics (SI Materials and Methods).
We recorded from eight chronically implanted electrodes on two custom-built microdrives targeting the NCL. The analysis includes all neurons (n = 342, 177 from crow B in 77 recording sessions, 165 from crow L in 51 sessions) with a firing rate of at least 0.5 Hz during the trial (beginning of presample until end of delay period) and at least 10 trials recorded for each of the two familiar sample pictures.
Data Analysis.
Learning criterion.
We used a state-space model of dynamic learning (8) to estimate a learning criterion from the behavioral data in each individual block: that is, the earliest trial when the bird was performing reliably above chance (SI Materials and Methods). For the purpose of neuronal analyses on well-controlled behavioral data, only novel blocks in which a learning criterion could be determined (91% and 85% of all associations in crow B and L, respectively) were considered. The actual learning behavior in individual sessions could be more variable (Fig. S1).
Analysis of delay-selective neurons.
Neuronal activity was analyzed using unsmoothed firing rates in a 600-ms window starting 500 ms after delay onset and ending 100 ms after choice onset. Neurons were selected for further analyses based on their selectivity in the familiar block by combining responses from both familiar blocks and calculating a rank sum test (P < 0.05, Mann–Whitney U test). 93 neurons (27%, 53 from crow B, 40 from crow L) significantly discriminated the two sample pictures in our analysis window.
An association was included in the analysis if the neuron was held from trial 1 of the association until at least 10 trials after criterion was reached. During recording of the 93 selective neurons, 136 successful associations were presented. Fifty-three neurons contributed two associations to further analyses, and 30 neurons contributed one association. All analyses were performed for individual associations and then averaged for statistics and display for those neurons which contributed two associations.
Sample-period analysis.
Sample-period activity was analyzed using unsmoothed firing rate in a 500-ms window, starting 100 ms after sample stimulus onset, ending 100 ms after sample stimulus offset. We selected 138 neurons (40%) based on their selectivity in the familiar block in the sample period (P < 0.05 rank sum test); 202 successful associations were presented during the recording of these 138 neurons (74 neurons contributed two associations and 51 contributed one). All analyses were performed as described for the delay window.
Population analysis.
PCA.
We performed PCA of trial-averaged, smoothed, and normalized population activity to reduce dimensionality of the high-dimensional space spanned by all neurons’ firing rates in Fig. 2C (SI Materials and Methods).
Distance.
We calculated Euclidean distance in the high-dimensional space (without dimensionality reduction) between all pairs of samples from different blocks to measure difference in population activity to different samples. We then averaged the distances for all samples associated with the same test item (within group distance) and all samples associated with different test items (between group distance).
ROC analysis.
The quality of selectivity for each unit was quantified using ROC analysis (SI Materials and Methods). The sample stimulus (R or B) that elicited the lowest firing rate in the familiar block was used as reference (noise distribution). Therefore, all familiar-selective neurons had ROC values higher than 0.5 in familiar blocks. Selectivity in novel blocks could range from 0 to 1, with 0.5 indicating no selectivity and values higher than 0.5 indicating associative selectivity (i.e., the same preference as in the familiar blocks).
Acknowledgments
This work was supported by a doctoral fellowship from the German National Academic Foundation (to L.V.); and by Deutsche Forschungsgemeinschaft Grant NI 618/3-1 (to A.N.).
Footnotes
The authors declare no conflict of interest.
This article is a PNAS Direct Submission.
This article contains supporting information online at www.pnas.org/lookup/suppl/doi:10.1073/pnas.1509760112/-/DCSupplemental.
References
- 1.Emery NJ, Clayton NS. The mentality of crows: Convergent evolution of intelligence in corvids and apes. Science. 2004;306(5703):1903–1907. doi: 10.1126/science.1098410. [DOI] [PubMed] [Google Scholar]
- 2.Nishizawa K, Izawa EI, Watanabe S. Neural-activity mapping of memory-based dominance in the crow: neural networks integrating individual discrimination and social behaviour control. Neuroscience. 2011;197:307–319. doi: 10.1016/j.neuroscience.2011.09.001. [DOI] [PubMed] [Google Scholar]
- 3.Clayton NS, Yu KS, Dickinson A. Scrub jays (Aphelocoma coerulescens) form integrated memories of the multiple features of caching episodes. J Exp Psychol Anim Behav Process. 2001;27(1):17–29. [PubMed] [Google Scholar]
- 4.Veit L, Nieder A. Abstract rule neurons in the endbrain support intelligent behaviour in corvid songbirds. Nat Commun. 2013;4:2878. doi: 10.1038/ncomms3878. [DOI] [PubMed] [Google Scholar]
- 5.Hartmann B, Güntürkün O. Selective deficits in reversal learning after neostriatum caudolaterale lesions in pigeons: Possible behavioral equivalencies to the mammalian prefrontal system. Behav Brain Res. 1998;96(1-2):125–133. doi: 10.1016/s0166-4328(98)00006-0. [DOI] [PubMed] [Google Scholar]
- 6.Güntürkün O. The avian ‘prefrontal cortex’ and cognition. Curr Opin Neurobiol. 2005;15(6):686–693. doi: 10.1016/j.conb.2005.10.003. [DOI] [PubMed] [Google Scholar]
- 7.Puig MV, Rose J, Schmidt R, Freund N. Dopamine modulation of learning and memory in the prefrontal cortex: Insights from studies in primates, rodents, and birds. Front Neural Circuits. 2014;8:93. doi: 10.3389/fncir.2014.00093. [DOI] [PMC free article] [PubMed] [Google Scholar]
- 8.Smith AC, Wirth S, Suzuki WA, Brown EN. Bayesian analysis of interleaved learning and response bias in behavioral experiments. J Neurophysiol. 2007;97(3):2516–2524. doi: 10.1152/jn.00946.2006. [DOI] [PubMed] [Google Scholar]
- 9.Veit L, Hartmann K, Nieder A. Neuronal correlates of visual working memory in the corvid endbrain. J Neurosci. 2014;34(23):7778–7786. doi: 10.1523/JNEUROSCI.0612-14.2014. [DOI] [PMC free article] [PubMed] [Google Scholar]
- 10.Ditz HM, Nieder A. Neurons selective to the number of visual items in the corvid songbird endbrain. Proc Natl Acad Sci USA. 2015;112(25):7827–7832. doi: 10.1073/pnas.1504245112. [DOI] [PMC free article] [PubMed] [Google Scholar]
- 11.Roitblat HL. Codes and coding processes in pigeon short-term memory. Anim Learn Behav. 1980;8(3):341–351. [Google Scholar]
- 12.Gaffan D. Response coding in recall of colours by monkeys. Q J Exp Psychol. 1977;29(4):597–605. doi: 10.1080/14640747708400635. [DOI] [PubMed] [Google Scholar]
- 13.Rainer G, Rao SC, Miller EK. Prospective coding for objects in primate prefrontal cortex. J Neurosci. 1999;19(13):5493–5505. doi: 10.1523/JNEUROSCI.19-13-05493.1999. [DOI] [PMC free article] [PubMed] [Google Scholar]
- 14.Asaad WF, Rainer G, Miller EK. Neural activity in the primate prefrontal cortex during associative learning. Neuron. 1998;21(6):1399–1407. doi: 10.1016/s0896-6273(00)80658-3. [DOI] [PubMed] [Google Scholar]
- 15.Cromer JA, Machon M, Miller EK. Rapid association learning in the primate prefrontal cortex in the absence of behavioral reversals. J Cogn Neurosci. 2011;23(7):1823–1828. doi: 10.1162/jocn.2010.21555. [DOI] [PMC free article] [PubMed] [Google Scholar]
- 16.Pasupathy A, Miller EK. Different time courses of learning-related activity in the prefrontal cortex and striatum. Nature. 2005;433(7028):873–876. doi: 10.1038/nature03287. [DOI] [PubMed] [Google Scholar]
- 17.Brincat SL, Miller EK. Frequency-specific hippocampal-prefrontal interactions during associative learning. Nat Neurosci. 2015;18(4):576–581. doi: 10.1038/nn.3954. [DOI] [PMC free article] [PubMed] [Google Scholar]
- 18.Freedman DJ, Riesenhuber M, Poggio T, Miller EK. Visual categorization and the primate prefrontal cortex: Neurophysiology and behavior. J Neurophysiol. 2002;88(2):929–941. doi: 10.1152/jn.2002.88.2.929. [DOI] [PubMed] [Google Scholar]
- 19.Tomita H, Ohbayashi M, Nakahara K, Hasegawa I, Miyashita Y. Top-down signal from prefrontal cortex in executive control of memory retrieval. Nature. 1999;401(6754):699–703. doi: 10.1038/44372. [DOI] [PubMed] [Google Scholar]
- 20.Nieder A. Supramodal numerosity selectivity of neurons in primate prefrontal and posterior parietal cortices. Proc Natl Acad Sci USA. 2012;109(29):11860–11865. doi: 10.1073/pnas.1204580109. [DOI] [PMC free article] [PubMed] [Google Scholar]
- 21.Hirabayashi T, Takeuchi D, Tamura K, Miyashita Y. Functional microcircuit recruited during retrieval of object association memory in monkey perirhinal cortex. Neuron. 2013;77(1):192–203. doi: 10.1016/j.neuron.2012.10.031. [DOI] [PubMed] [Google Scholar]
- 22.Hirabayashi T, Miyashita Y. Computational principles of microcircuits for visual object processing in the macaque temporal cortex. Trends Neurosci. 2014;37(3):178–187. doi: 10.1016/j.tins.2014.01.002. [DOI] [PubMed] [Google Scholar]
- 23.Gentner TQ, Margoliash D. Neuronal populations and single cells representing learned auditory objects. Nature. 2003;424(6949):669–674. doi: 10.1038/nature01731. [DOI] [PMC free article] [PubMed] [Google Scholar]
- 24.Jeanne JM, Thompson JV, Sharpee TO, Gentner TQ. Emergence of learned categorical representations within an auditory forebrain circuit. J Neurosci. 2011;31(7):2595–2606. doi: 10.1523/JNEUROSCI.3930-10.2011. [DOI] [PMC free article] [PubMed] [Google Scholar]
- 25.Jeanne JM, Sharpee TO, Gentner TQ. Associative learning enhances population coding by inverting interneuronal correlation patterns. Neuron. 2013;78(2):352–363. doi: 10.1016/j.neuron.2013.02.023. [DOI] [PMC free article] [PubMed] [Google Scholar]
- 26.Kröner S, Güntürkün O. Afferent and efferent connections of the caudolateral neostriatum in the pigeon (Columba livia): A retro- and anterograde pathway tracing study. J Comp Neurol. 1999;407(2):228–260. doi: 10.1002/(sici)1096-9861(19990503)407:2<228::aid-cne6>3.0.co;2-2. [DOI] [PubMed] [Google Scholar]
- 27.Wirth S, et al. Single neurons in the monkey hippocampus and learning of new associations. Science. 2003;300(5625):1578–1581. doi: 10.1126/science.1084324. [DOI] [PubMed] [Google Scholar]
- 28.Wirth S, et al. Trial outcome and associative learning signals in the monkey hippocampus. Neuron. 2009;61(6):930–940. doi: 10.1016/j.neuron.2009.01.012. [DOI] [PMC free article] [PubMed] [Google Scholar]
- 29.Yanike M, Wirth S, Smith AC, Brown EN, Suzuki WA. Comparison of associative learning-related signals in the macaque perirhinal cortex and hippocampus. Cereb Cortex. 2009;19(5):1064–1078. doi: 10.1093/cercor/bhn156. [DOI] [PMC free article] [PubMed] [Google Scholar]
- 30.Suzuki WA, Brown EN. Behavioral and neurophysiological analyses of dynamic learning processes. Behav Cogn Neurosci Rev. 2005;4(2):67–95. doi: 10.1177/1534582305280030. [DOI] [PubMed] [Google Scholar]
- 31.Benchenane K, et al. Coherent theta oscillations and reorganization of spike timing in the hippocampal- prefrontal network upon learning. Neuron. 2010;66(6):921–936. doi: 10.1016/j.neuron.2010.05.013. [DOI] [PubMed] [Google Scholar]
- 32.Rattenborg NC, Martinez-Gonzalez D. A bird-brain view of episodic memory. Behav Brain Res. 2011;222(1):236–245. doi: 10.1016/j.bbr.2011.03.030. [DOI] [PubMed] [Google Scholar]
- 33.Atoji Y, Wild JM, Yamamoto Y, Suzuki Y. Intratelencephalic connections of the hippocampus in pigeons (Columba livia) J Comp Neurol. 2002;447(2):177–199. doi: 10.1002/cne.10239. [DOI] [PubMed] [Google Scholar]
- 34.Chen LL, Wise SP. Neuronal activity in the supplementary eye field during acquisition of conditional oculomotor associations. J Neurophysiol. 1995;73(3):1101–1121. doi: 10.1152/jn.1995.73.3.1101. [DOI] [PubMed] [Google Scholar]
- 35.Chen LL, Wise SP. Supplementary eye field contrasted with the frontal eye field during acquisition of conditional oculomotor associations. J Neurophysiol. 1995;73(3):1122–1134. doi: 10.1152/jn.1995.73.3.1122. [DOI] [PubMed] [Google Scholar]
- 36.Rainer G, Miller EK. Effects of visual experience on the representation of objects in the prefrontal cortex. Neuron. 2000;27(1):179–189. doi: 10.1016/s0896-6273(00)00019-2. [DOI] [PubMed] [Google Scholar]
- 37.Puig MV, Miller EK. The role of prefrontal dopamine D1 receptors in the neural mechanisms of associative learning. Neuron. 2012;74(5):874–886. doi: 10.1016/j.neuron.2012.04.018. [DOI] [PMC free article] [PubMed] [Google Scholar]
- 38.Moll FW, Nieder A. Cross-modal associative mnemonic signals in crow endbrain neurons. Curr Biol. 2015;25(16):2196–2201. doi: 10.1016/j.cub.2015.07.013. [DOI] [PubMed] [Google Scholar]
- 39.Hoffmann A, Rüttler V, Nieder A. Ontogeny of object permanence and object tracking in the carrion crow, Corvus corone. Anim Behav. 2011;82:359–367. [Google Scholar]
- 40.Green DM, Swets JA. Signal Detection Theory and Psychophysics. Wiley; New York: 1966. [Google Scholar]


