Significance
In coastal Alaska and the St. Elias orogen, over the past 1.2 million years, mass flux leaving the mountains due to glacial erosion exceeds the plate tectonic input. This finding underscores the power of climate in driving erosion rates, potential feedback mechanisms linking climate, erosion, and tectonics, and the complex nature of climate−tectonic coupling in transient responses toward longer-term dynamic equilibration of landscapes with ever-changing environments.
Keywords: tectonic−climate interactions, orogenesis, Mid-Pleistocene transition, mass flux, ocean drilling
Abstract
Erosion, sediment production, and routing on a tectonically active continental margin reflect both tectonic and climatic processes; partitioning the relative importance of these processes remains controversial. Gulf of Alaska contains a preserved sedimentary record of the Yakutat Terrane collision with North America. Because tectonic convergence in the coastal St. Elias orogen has been roughly constant for 6 My, variations in its eroded sediments preserved in the offshore Surveyor Fan constrain a budget of tectonic material influx, erosion, and sediment output. Seismically imaged sediment volumes calibrated with chronologies derived from Integrated Ocean Drilling Program boreholes show that erosion accelerated in response to Northern Hemisphere glacial intensification (∼2.7 Ma) and that the 900-km-long Surveyor Channel inception appears to correlate with this event. However, tectonic influx exceeded integrated sediment efflux over the interval 2.8–1.2 Ma. Volumetric erosion accelerated following the onset of quasi-periodic (∼100-ky) glacial cycles in the mid-Pleistocene climate transition (1.2–0.7 Ma). Since then, erosion and transport of material out of the orogen has outpaced tectonic influx by 50–80%. Such a rapid net mass loss explains apparent increases in exhumation rates inferred onshore from exposure dates and mapped out-of-sequence fault patterns. The 1.2-My mass budget imbalance must relax back toward equilibrium in balance with tectonic influx over the timescale of orogenic wedge response (millions of years). The St. Elias Range provides a key example of how active orogenic systems respond to transient mass fluxes, and of the possible influence of climate-driven erosive processes that diverge from equilibrium on the million-year scale.
Orogenesis reflects the balance of crustal material entering a mountain belt to undergo shortening and uplift versus material leaving the orogen through exhumation, erosion, and sediment transport (1–5). Perturbations in the influx/efflux from the orogen are expected to result in predictable changes in deformation within the orogen as it attempts to reestablish equilibrium (3). The long-term sink for sediment transported out of mountain belts is often in the deep sea, particularly in large submarine fans where sediments accumulate at anomalously high rates (>10 cm/ky) compared with deep-sea pelagic sedimentation (6–8). Even higher sedimentation rates (>100 cm/ky) proximal to glacially eroded regions (9–14) imply that wet-based glaciers are extremely efficient agents of erosion. Observations and modeling have argued that erosion rates can influence tectonic processes (15–19), but the timescales of adjustment, and the role of landscape disequilibrium, remain unclear. For example, exceptionally high local sedimentation rates (100–1000 cm/ky) recorded on the century timescale (13) have been suggested to reflect an unsustainable, short-term erosion perturbation due to the Little Ice Age (20).
Time-varying sediment accumulation rates at individual sites have been interpreted to reflect an allogenic control on sediment production, especially related to a fundamental climate-induced change in terrestrial sediment production in the Pleistocene (21, 22). An alternate explanation is that autogenic sediment dispersal processes and/or subsequent erosion of accumulated strata can result in an apparent decrease in sediment accumulation rates with increasing age [the so-called “Sadler Effect,” first described by Moore and Heath (23)], especially as the averaging time increases and in environments where accommodation limits accumulation (e.g., floodplains and continental shelves) (24, 25). Testing between the allogenic and autogenic viewpoints requires spatially continuous sedimentation data to address potential sampling bias.
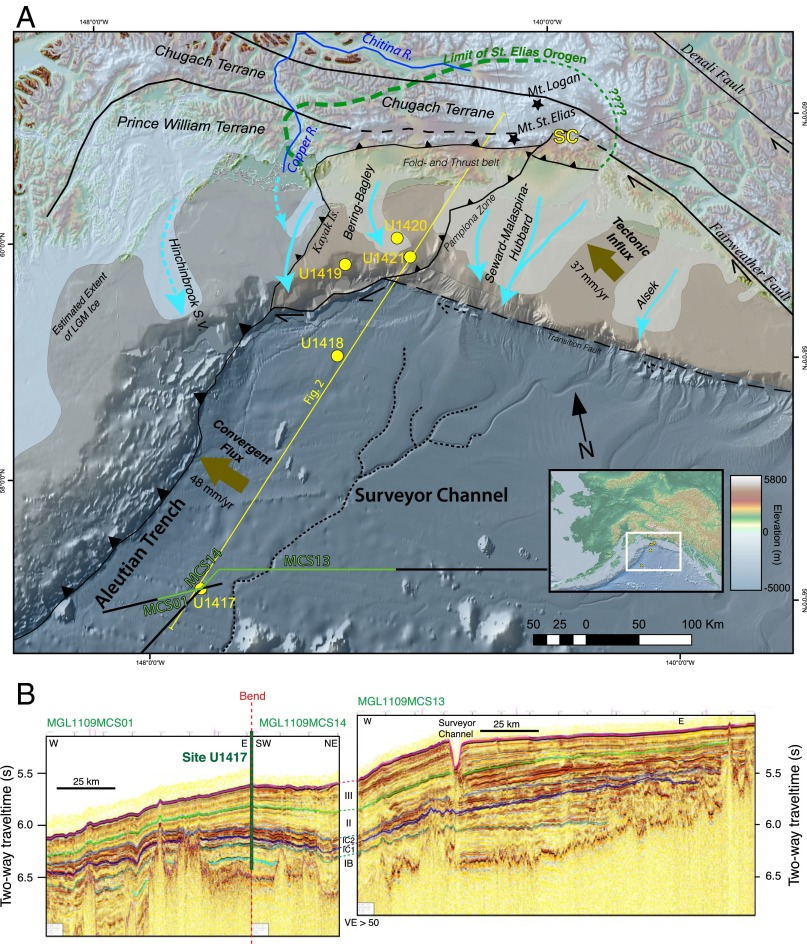
Southeastern Alaska represents a key location to constrain such sampling biases and to examine the interactions among climate, erosion, and orogenesis. Tectonic forcing creating the St. Elias Mountains is a product of low-angle subduction of the Yakutat Terrane (Fig. 1A); convergence has been essentially constant since a reorganization of neighboring Pacific Plate motion ∼6 Ma (17, 26, 27). Glacial influence is thought to have increased with intensification of Northern Hemisphere glaciations (iNHGs) at the Plio-Pleistocene transition (PPT) (28) and perhaps further increased with the transition to 100 kyr cycles at the middle Pleistocene transition (MPT) (29, 30). Sediments eroded from the orogen that are deposited on the continental shelf either lie within the orogen if within the Pamplona Zone fold and thrust belt (16) or may reenter the orogen with the subducting Yakutat Terrane (Fig. 1A). Sediments that bypass the shelf to be deposited on the deep-sea Surveyor Fan or within the adjacent Aleutian Trench are permanently removed from the orogeny, as these sediments will travel with the Pacific Plate westward to be eventually accreted or subducted along the Aleutian system (Fig. 1A) (31). In 2013, Integrated Ocean Drilling Program (IODP) Expedition 341 drilled a transect of sites (U1417-U1421; Figs. 1 and 2) across the Surveyor Fan in the Gulf of Alaska and Bering–Malaspina slope and shelf offshore of the St. Elias Mountains to examine the sedimentary record of unroofing during a cooling global climate with increasing intensity of glaciations.
Fig. 1.
(A) Gulf of Alaska study area with Last Glacial Maximum glacial extent [light blue (46)], limit of exhuming St. Elias orogen (dashed green), glacial flow paths (blue arrows; dashed where presumed secondary contribution), and glacially fed deep-sea Surveyor Channel system (black dashed). Yakutat Terrane shaded in tan with deformation front of the Yakutat–North American plate boundary as eastern thrust fault and boundary with Pacific Plate as southern strike-slip faults. Brown vectors mark mass influx to orogen from Yakutat Terrane and portion of eroded sediments on Pacific Plate that are subducted/accreted at the Aleutian Trench. Seismic traverse in B is shown in green, and IODP Expedition 341 drill sites are shown in yellow. (B) Multichannel seismic transect through Site U1417 where base of seismic Sequence III (correlated to the MPT) is in green and base of seismic Sequence II (correlated to the PPT) is in light blue. Note the Surveyor Channel, a conduit for sediment transport from the shelf to the deep sea, which appears to become active near the PPT, thus dominating sediment depositional processes for all of Sequences II and III (since ∼2.6 Ma). Seismic subsequence subdivision also shown for Sequence I (pre-PPT). Depth of recovery at Site U1417 (thick green line) is near 6.4 s two-way travel time.
Fig. 2.
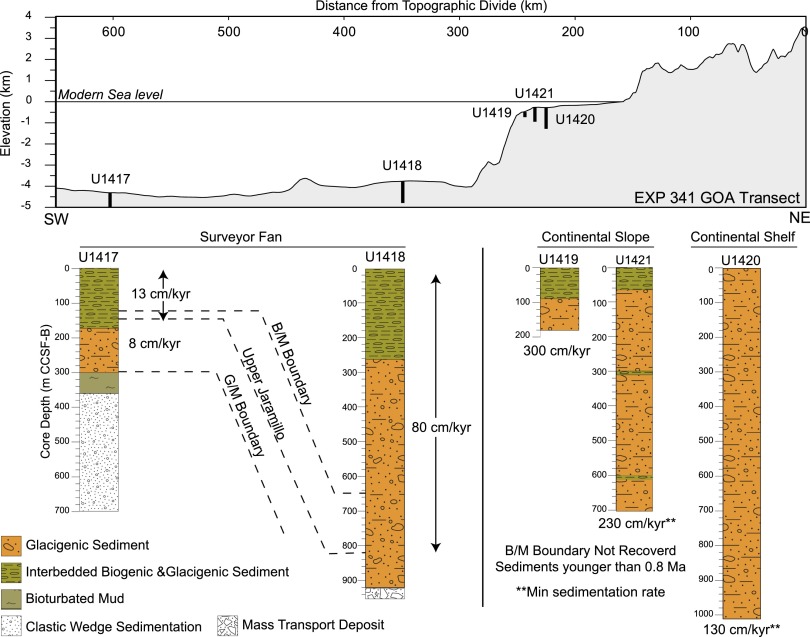
Representative topography through the IODP Expedition 341 drill sites (see Fig. 1 for location), and the principle lithologies at each site along with chronologies and accumulation rates in centimeters per kiloyear. Depths are in meters of CCSF-B that approximates the drilled interval. Dashed lines show paleomagnetic reversals used to correlate between drill sites including the 0.781-Ma Brunhes/Matuyama (B/M), 0.988-Ma Upper Jaramillo, and 2.588-Ma Gauss/Matuyama (G/M). Vertical exaggeration is ∼18×.
Results and Discussion
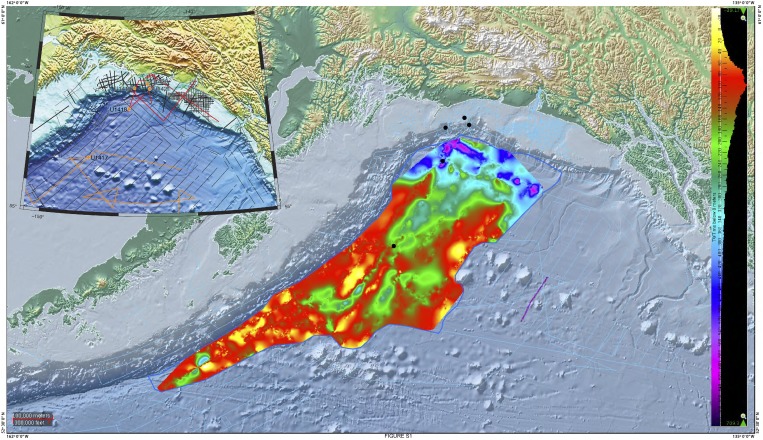
The Surveyor Fan covers >300,000 km2 (31), the western 2/3 of which is sourced from the St. Elias Mountains. Distal fan Site U1417 reveals that the fan has been active since at least Miocene time; preglacial fan sediments, referred to as Sequence I, were recovered by drilling and are imaged and mapped by seismic reflection data (Figs. 1B and 2 and Figs. S1 and S2). The first occurrence of gravel-sized debris (>2 mm grain size) is now well dated and documents the onset of ice-rafted deposition just before the Gauss–Matuyama paleomagnetic reversal ∼300 m below the seafloor (2.581 Ma) (Figs. S3 and S4). This onset of ice rafting is consistent with recent terrestrial cosmogenic nuclide dating of the earliest apparent Cordilleran Ice Sheet [2.64 Ma +0.4/-0.36 Ma (32)] and is inferred to reflect the regional response to iNHG (28). This depth/age within the cored interval lies a few meters above the base of geophysically mapped Sequence II, which is assigned an age of 2.8 Ma (Figs. 1B and 3A and Fig. S1; see Methods) and comprises primarily overbank deposits from the Surveyor Channel. The Surveyor Channel system has not avulsed since its initiation (31) and appears to have formed at about the same time as the first occurrence of tidewater glaciation and the associated change in sedimentary system, based on the mapping of the Sequence I/II boundary from Channel to Site U1417 (Fig. 1B).
Fig. S1.
Sediment thickness shown in two-way travel time for Sequence II within the Surveyor Fan. Mapping only included portion of Surveyor Fan that correlates with the St. Elias orogen based on the mapped Surveyor Channel system. An average sequence thickness over the mapped region was used for sediment volume calculations, because of observed contouring artifacts. Subducted sediment volume was determined by a trapezoidal approximation of the thickness of Sequence II sediments being subducted at the Aleutian Trench based on this sediment thickness map.
Fig. S2.
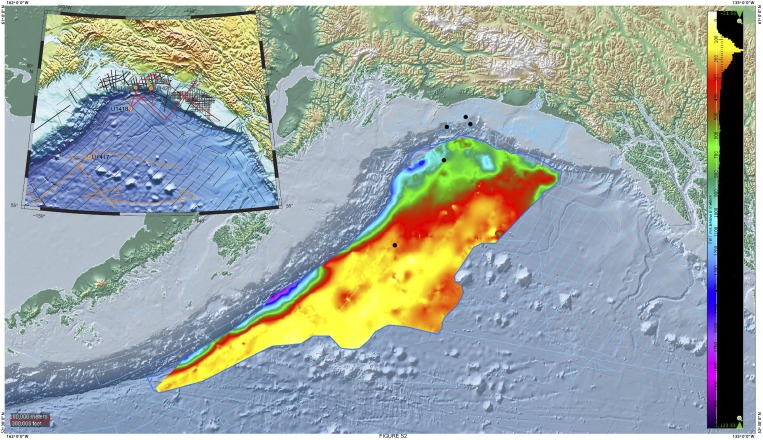
Sediment thickness shown in two-way travel time for Sequence III within the Surveyor Fan. Mapping only included portion of Surveyor Fan that correlates with the St. Elias orogen based on the mapped Surveyor Channel system. An average sequence thickness over the mapped region was used for sediment volume calculations, because of observed contouring artifacts. Subducted sediment volume was determined by a trapezoidal approximation of the thickness of Sequence III sediments being subducted at the Aleutian Trench based on this sediment thickness map.
Fig. S3.
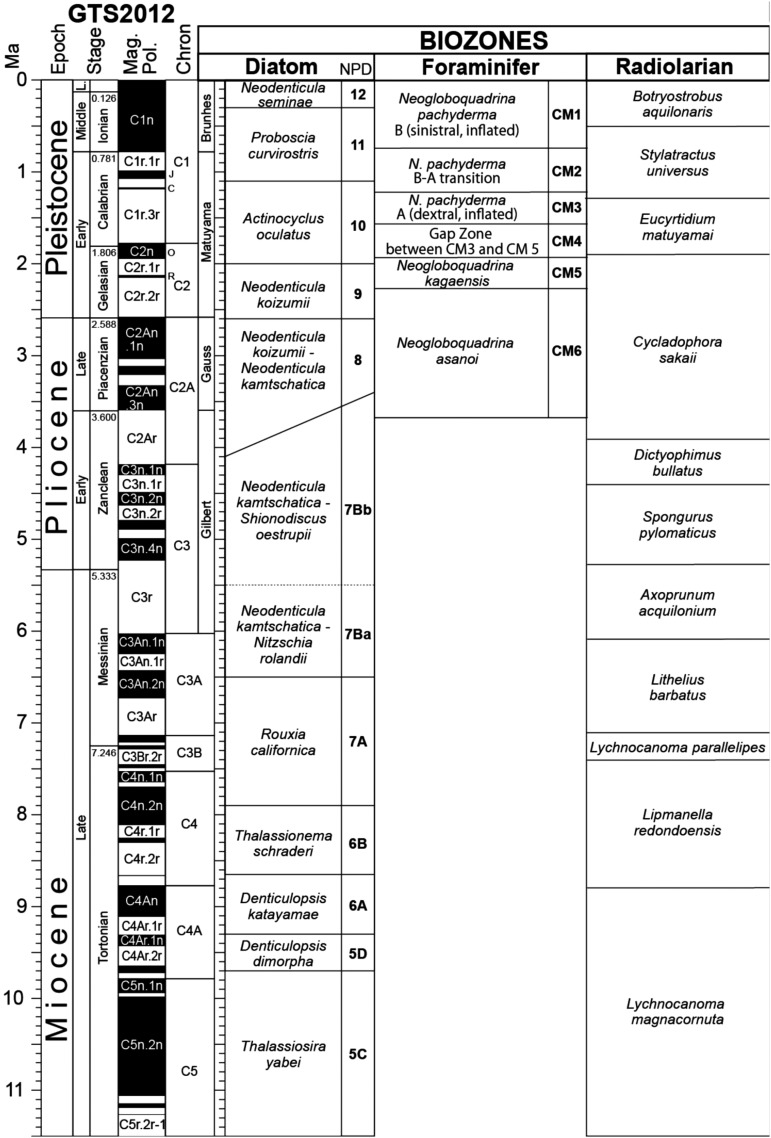
Chronostratigraphy for IODP Expedition 341 was based on the 2012 geologic timescale (GTS2012). The GTS2012 is shown with assigned magnetostratigraphic and correlated biostratigraphic time intervals. For the biozones, the intervals for diatoms, foraminifers, and radiolarians are shown and are North Pacific-specific where appropriate.
Fig. S4.
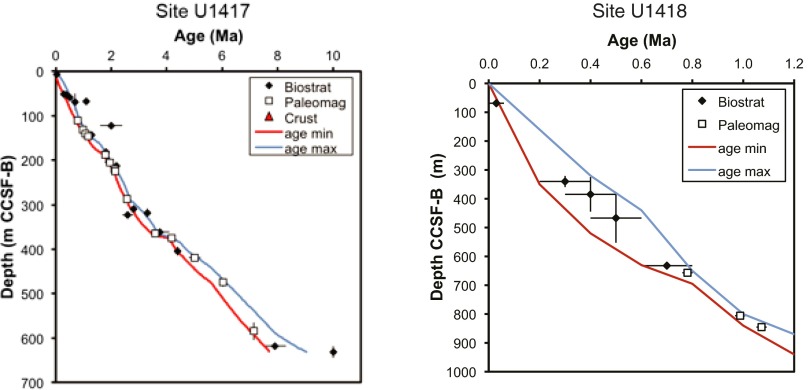
Shipboard age models for Sites U1417 and U1418. The two dashed curves represent the minimum and maximum age models based on shipboard data. See legends for types of chronostratigraphy used for each data point, see the vertical error bars for estimated depth error, and see the horizontal error bars for estimate age error. GTS2012 (see Fig. S3) is tied directly to magnetostratigraphic ages and is thus shown with no age error bar.
Fig. 3.
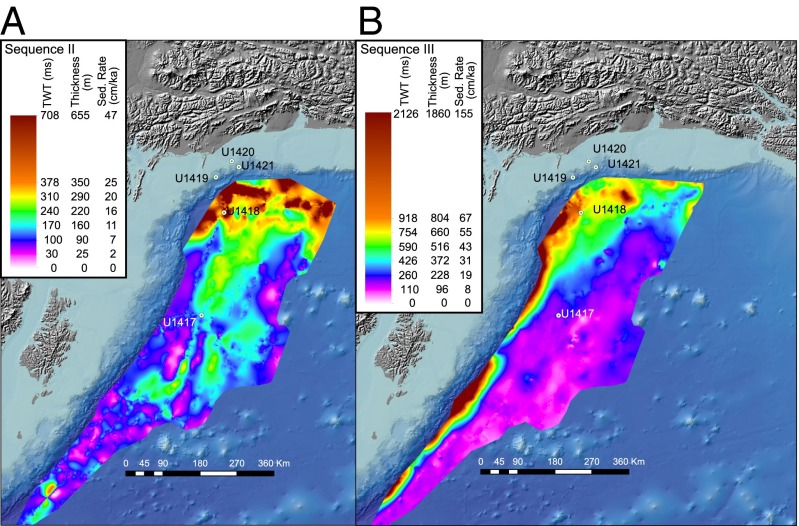
Sediment thickness converted to sediment accumulation rates (centimeters per thousand years) for Sequence II (A) and Sequence III (B) within the Surveyor Fan. Mapping only included portion of Surveyor Fan that correlates with the St. Elias orogen based on the mapped Surveyor Channel system. Average sequence thicknesses converted from two-way travel time isopach maps (Figs. S1 and S2) over the mapped region were used for sediment volume calculations and then converted to sediment accumulation rates as shown here using U1417 and U1418 chronologies (Figs. S3 and S4).
Overlying Sequence II, Sequence III (also comprising overbank strata from the Surveyor and related channels, but with different seismic reflection character) (Figs. 1B and 3B and Fig. S2) thickens significantly toward the orogen (31). At distal Site U1417, the Sequence III/II boundary lies just below the 1.2-Ma onset of the MPT (29, 30) whereas, at the proximal fan Site U1418, the reflector ties to the upper Jaramillo paleomagnetic reversal (0.99 Ma) within the MPT (Fig. 2 and Figs. S3 and S4). Sequence II/III boundary is conservatively assigned an age of ∼1.2 Ma. At Site U1417, the postupper Jaramillo average sedimentation rate is 129 m/My; at Site U1418, it is 813 m/My, a sixfold increase toward the orogen (Fig. 2). Sediment thicknesses and approximated sedimentation rates from seismic reflection isopachs support these rates as representative of large-scale spatial patterns and not local anomalies (Fig. 3B, Fig. S2, and Dataset S1).
These results demonstrate elevated glacigenic sediment accumulation in the Gulf of Alaska in the Middle to Late Pleistocene that may be even more pronounced on the continental shelf/slope. On the slope, Sites U1419 (drilled to 177 m) and U1421 (drilled to 702 m), and at shelf Site U1420 (drilled to 1020 m), sediments were all of normal paleomagnetic polarity and the Brunhes–Matuyama paleomagnetic reversal was not encountered, indicating depositional ages of <0.78 Ma (Fig. 2). Biostratigraphic data from U1421 show these sediments to be < 0.3 Ma. Benthic foraminiferal δ18O analyses at U1419 indicate the sediments recovered at that site to be < 0.06 Ma (Fig. S5). Thus, sustained Late Pleistocene sedimentation rates on the slope average 200–300 cm/ky, and the rate on the shelf averages >100 cm/ky (Fig. 2), consistent with shoreward thickening of seismic units mapped throughout the region. These remarkably high long-term accumulation rates, determined, for the first time to our knowledge, with an independent age-calibrated offshore depositional record, are similar to rates within the last century in Alaskan waters (13, 20), suggesting that the recent rates are not local aberrations but are sustained features of the St Elias–Gulf of Alaska erosion–deposition system.
Fig. S5.
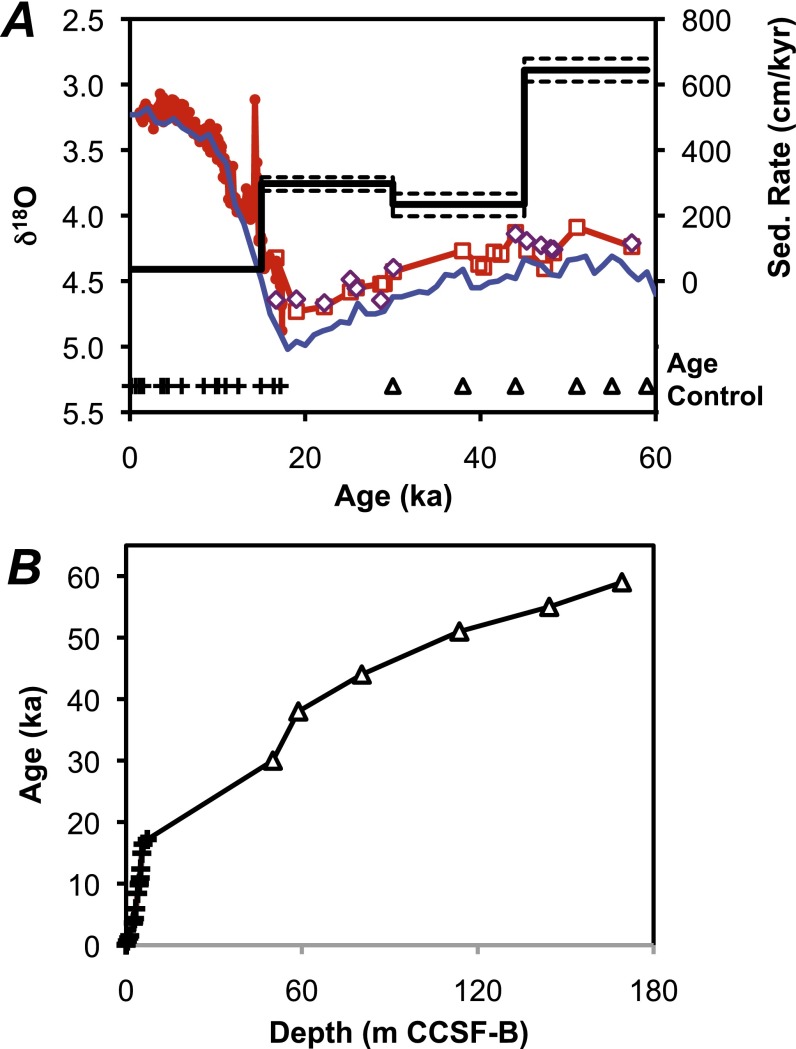
Age model and sedimentation rates for Site U1419 (older than 18 ka) and core EW0408-85JC (younger than 18 ka). (A) The δ18O based on Uvigerina sp. (red solid circles are EW0408-85JC, and purple open diamonds are U1419) and Epistominella pacifica + 0.1 (red open squares are U1419, and 0.1 is the species offset relative to Uvigerina sp.); comparison is with the LR04 global δ18O stack (blue line). Age control points are plus signs (planktonic foraminiferal radiocarbon in EW0408-85JC corrected to calendar ages) and open triangles (δ18O correlation points to LR04). Sedimentation rates, calculated in 15-ky block averages (solid black lines with dashed ±1σ uncertainties), range from 36 ± 2 cm/ky (0–15 ka) to 644 ± 35 cm/ka (45–60 ka). (B) Age depth model for Site U1419, symbols as above. All data in EW0408-85JC δ18O data are from Davies et al. (42); radiocarbon data are from Davies-Walczak and others (48); and LR04 δ18O stack is from Lisiecki and Raymo (28). The δ18O in Site U1419 were measured at Oregon State University.
Mapping the seismic reflector at the base of Sequence II (∼2.8 Ma, early in the PPT) and the reflector between Sequences II and III (∼1.2 Ma, early in the MPT) throughout the Surveyor Fan provides a minimum estimate for the total sediment yield over these time intervals. This use of a sediment volume to examine the integrated sediment efflux from the St. Elias Mountains allows us to avoid complications associated with potential local bias (33), because we have integrated all of the unsubducted sediments in the system and are not dependent on sedimentation rates at discrete locations to examine flux through time. The sediment volumes here are minimum estimates, due to the possibility that some sediment is lost to the system, but we have estimated the volume of subducted sediments at the Aleutian Trench based on MOREVEL2010 trench-normal Pacific Plate velocity of 48 mm/y (Fig. 1A) and the cross-sectional area of sediments of Sequences III and II currently subducting/accreting. The sediment volumes in the portion of the Surveyor Fan sourced from the Bering–Bagley and the Seward–Malaspina–Hubbard–Alsek drainages via the Surveyor Channel are ∼29,800 ± 6,700 km3 for Sequence II and ∼66,700 ± 13,900 km3 for Sequence III, with additional Aleutian Trench subducting/accretion volumes estimated at ∼9,800 ± 400 for Sequence II and ∼41,900 ± 13,000 km3 for Sequence III (Fig. 3, Figs. S1 and S2, and Dataset S1; see Methods).
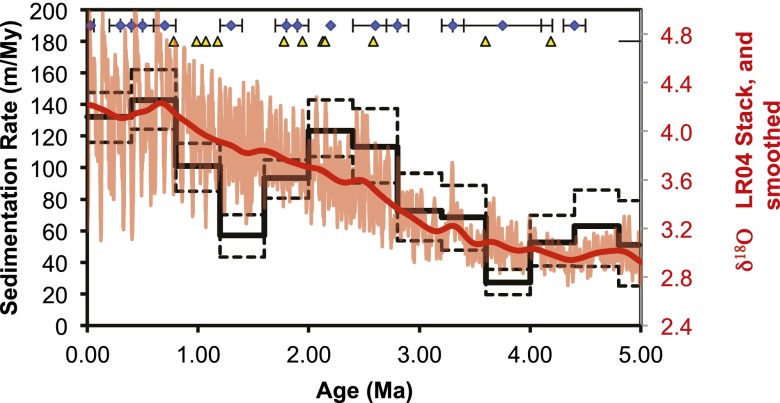
In support of a glacigenic influence on fan volume, preglacial sedimentation rates at Site U1417 [averaged over 0.4-My intervals to avoid shorter-term transient effects (25); Fig. 4] of ∼30–70 m/My from 5.2 Ma to 2.8 Ma rose to peak values of 120 ± 20 m/My between 2.4 Ma and 2.0 Ma following the expansion of Northern Hemisphere glaciation near the Plio-Pleistocene boundary. Although glaciation continued, at Site U1417, sedimentation rates relaxed back to ∼60 m/My from 1.6 Ma to 1.2 Ma, implying an apparent reduction of regional glacial erosion. This inference assumes that Site U1417 is representative of sediment dispersal to the fan by the Surveyor Channel, which is supported by comparison with Early to Middle Pleistocene sedimentation rates modeled from regional seismic isopachs (Fig. 3A and Figs. S1 and S2). Sedimentation rates at Sites U1417 increase starting at 1.2 Ma to peak at ∼140 m/My by 0.8 Ma, coincident with the onset of 100-ky glacial cycles (Fig. 4). Such a resurgence of rapid sedimentation with the MPT ice expansion is expected; however, sustained high sediment yields through the Late Pleistocene are not predicted, based on an isostacy-only uplift response (3, 34).
Fig. 4.
Sedimentation rates at Sites U1417 binned at 0.4 My. Dashed error bars are 1-sigma based on Monte Carlo simulations (see Methods). Note drop in rates after initial increase following the culmination of the iNHG (∼2.6 Ma) but sustained high rates since the MPT (∼1.2 Ma). Global δ18O curve (LR04) is shown in pink with a smoothed version (500-kyr Gaussian filter) shown in red to highlight long-term trends through this interval. Yellow triangles show paleomagnetic constraints, and blue diamonds show biostratigraphic constraints with age ranges.
Observed sedimentation rates from the Expedition 341 sites (Fig. 2) and from sedimentation rates modeled from seismic isopachs (Fig. 3B) in the distal Surveyor Fan over ∼1.2 My are comparable to those of the Bengal Fan, where a similar increase in sedimentation is observed in the Middle to Late Pleistocene (6–8). Sites proximal to the Yakutat margin record some of the highest sedimentation rates ever recorded in the deep sea; for example, on the Bering–Malaspina slope, rates recorded for the last few glacial cycles are a factor of 2 larger than the glacially fed sedimentary deposit filling the south-central Chile Trench, previously the highest reported sedimentation rates observed over these timescales (14).
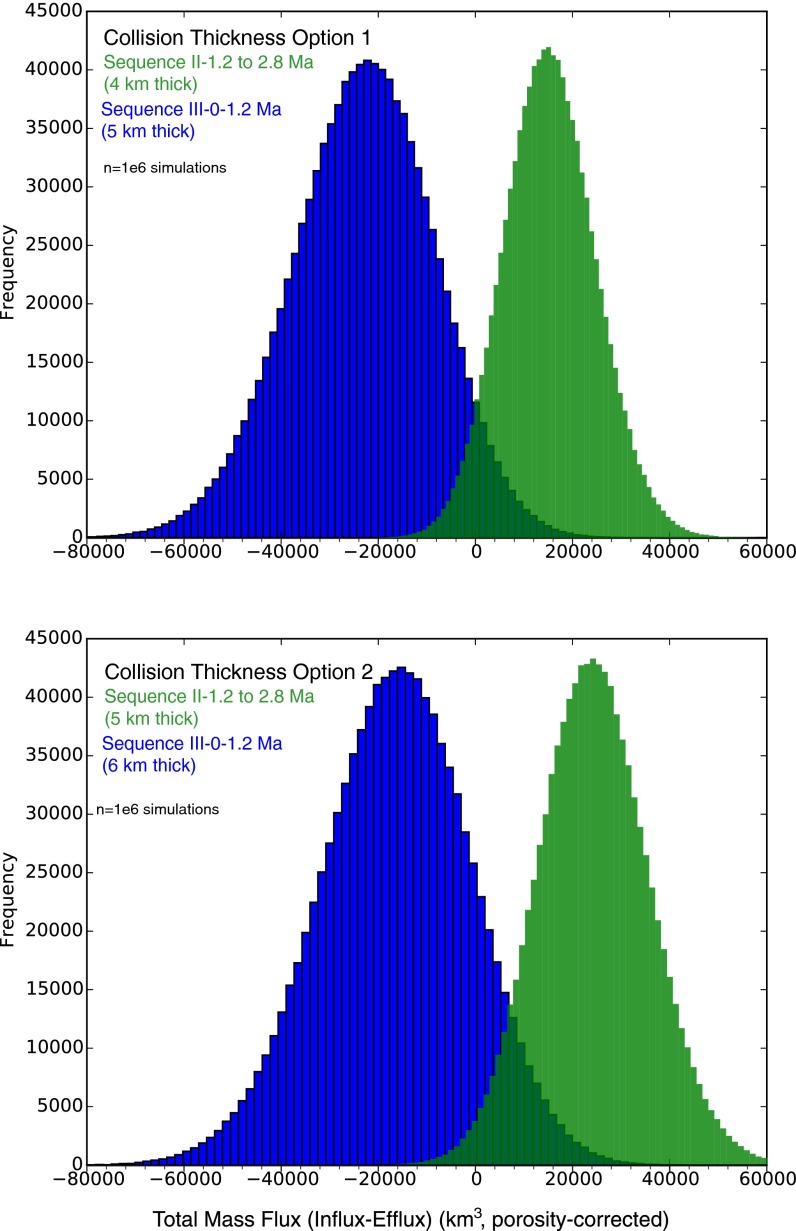
To place the MPT increase in Gulf of Alaska sediment yield into an orogenic framework, we calculate the tectonic influx of material into the St. Elias Range (Dataset S2; see Methods) using the length of the deformation front of the Pamplona Zone (16), the GPS-determined Yakutat–southeast Alaska block convergence rate (37 mm/y) (35) (Fig. 1A), and the thickness of sediments above the Yakutat décollement based on seismic data (36). We estimate that ∼36,800 ± 8,800 km3 and ∼31,800 ± 7,500 km3 of glacimarine sediments entered the orogen from 2.8 Ma to 1.2 Ma and 1.2 Ma to 0 Ma, respectively (Dataset S2). Using our mapped Sequence II and III sediment volumes including the estimating subducted/accreted volumes and correcting for porosity (see Methods), we determine a total erosional efflux of ∼20,500 ± 4,900 km3 for 2.8 Ma to 1.2 Ma and ∼56,400 ± 13,600 km3 for 1.2 Ma to 0 Ma (Dataset S2). The early Pleistocene influx exceeded efflux by ∼16,300 ± 10,100 km3; i.e., at a greater than 95% confidence level, there was a net positive mass flux in the orogen. In contrast, since the onset of the MPT, efflux has exceeded influx by ∼24,600 ± 15,600 km3 (a ∼50% net negative mass balance at a greater than 90% confidence level) (Dataset S2; see Methods), producing the marked change in sediment volumes in the Surveyor Fan (Fig. 3 and Figs. S1 and S2).
Implications
If the St. Elias orogen behaves as a critical taper wedge, then, given enough time, the sustained net efflux after the MPT should result in structural responses. However, predicted dynamic equilibrium timescales in models that seek a steady-state solution (3, 19) are >3 My. The glaciated critical wedge model (15, 19) predicts that if sufficient glacial erosion occurs to result in net efflux, then the active orogen would narrow and seek to maintain critical taper through internal deformation (e.g., out-of-sequence thrusting). Sandbox modeling further suggests that focused erosion within one portion of a critical wedge can result in a sequence of fault duplexes that focus rock uplift (37), where these structures may be an expression of internal deformation due to erosion-reduced taper. Onshore data including low-temperature thermochronology and structural mapping within the fold and thrust belt have been interpreted to display accelerated exhumation since the mid-Pleistocene (15) and structural response to focused erosion (17). Merging these onshore observations and our offshore determined switch to net efflux for the last 1.2 Ma, we suggest that the MPT has caused a perturbation in the tectonic erosion balance of the St. Elias orogen and that transient structural readjustment is observable on timescales much shorter than those required to reach steady state.
These results suggest that the longer and more intense 100-ky glacial cycles since the MPT (relative to the shorter ∼40-ky period pre-MPT glacial cycles) increased the integrated ice cover and erosion within the region of high relief originally created by tectonics. Our drilling-derived, calibrated history of sediment accumulation preserved within the proximal and distal Surveyor Fan documents a pattern of exceptionally high accumulation rates since the MPT, ranging from 130 cm/ky (shelf) to 81 cm/ky (proximal fan) to 13 cm/ky (distal fan) (Fig. 2); even higher rates are observed on the proximal slope (Fig. 2 and Fig. S5). We find that high modern rates of glacimarine sedimentation, which have been previously attributed to a short-term transient response to Little Ice Age glacial dynamics (38), were sustained on average (although likely in even more rapid pulses associated with glacial cycles) since the onset of the MPT. At these timescales, isostatic responses can be considered instantaneous, due to the low-viscosity mantle within this active orogen setting. We assume that the topographically controlled drainage basin area did not greatly increase across the MPT, suggesting several testable controls that could be the key to this post-MPT effect: (i) increased volume of ice driving an increase in instantaneous erosion rate; (ii) increased duration of glaciations driving an increased integrated eroded volume; (iii) larger area of glaciated topography, driving an increase in net erosional efflux; and/or (iv) an accelerated mechanism to remove sediment previously stored within the orogen. The St. Elias orogen since the MPT likely represents an end-member example of rapid climate-driven erosion combined with efficient removal of sediment entirely out of the orogen by glacial advances reaching the shelf edge; this resulted in an orogen-scale mass imbalance that persists for at least 1 My. Thus, an active, glaciated, coastal mountain belt may contrast with settings, such as the Himalaya, where climate has been reported to have lesser influences on orogenic development (39, 40). The continued existence of relief despite the 1.2 Ma of net efflux likely reflects internal deformation maintaining critical taper. Our results underscore the importance of a high-fidelity time series approach and regionally mapped sediment volumes with dense seismic coverage to understand the dynamic interplay of tectonics and erosion.
Methods
Calculations of mass accumulation rates based on the composite depth scales (known as Core Composite depth below Sea Floor, CCSF-A) correct for expansion of the sediment column artifact during the coring process (41). This corrected composite depth scale (CCSF-B) compresses the composite depth scales to the same total thickness of the drilled interval (41). Minimum and maximum shipboard age models are based on all available paleomagnetic and biostratigraphic age datums (Figs. S3 and S4). The age models at Sites U1417, U1418, and U1419 were constructed in the composite depth scales and are also provided in the CCSF-B depth scale. Uncertainties in the identification of the paleomagnetic age datums were arbitrarily set to ±10 m CCSF-A due to incomplete recovery and core quality. Uncertainty in the biostratigraphic datums reflects the limited shipboard sampling intervals (mostly confined to core catcher samples separated by ∼9.5 m) and the presence of barren zones. Outlier biostratigraphic datums were excluded. At Site U1418, all identified paleomagnetic datums (Brunhes–Matuyama boundary, top and base of the Jaramillo) were observed in Hole U1418F and included in the shipboard minimum and maximum age models. Of the biostratigraphic constraints, the youngest observed datum (last occurrence of the radiolarian Lychnocanoma sakaii, 0.03 ± 0.03 Ma; Fig. S3) was inconsistent between holes (91.7–101.5 m in Site U1418A, 125.6–131.0 m in U1418C, and 75.0–85.5 m in Holes U1418D and U1418E); we used the shallowest occurrence of this datum in U1418D. An additional age constraint is provided by an interval of low magnetic susceptibility observed in Holes U1418A, U1418C, U1418D, and U1418E between 180.5 m and 185.5 m CCSF-A, which is assumed to record the last interglacial event (Marine Isotope Stage 5e, between 0.11 Ma and 0.13 Ma). This datum aligns well with other age constraints at Site U1418. The age model for Site U1419 was based on correlation of gamma density and magnetic susceptibility to adjacent site survey core EW0408-85JC dated by radiocarbon (42), and based on correlation of benthic foraminiferal data from shipboard core catcher samples to the LR04 reference record (28). Oxygen isotopic data from Site U1419 and core EW0408-85JC are illustrated in Fig. S5.
Minimum and maximum age models (Fig. S4) were calculated based on Bayesian interpolation and full uncertainty propagation using the Bacon method (43) for Site U1417. Sedimentation rates (Fig. 4) were calculated in fixed time increments of 0.4 My to include multiple 100-ky cycles, and uncertainties were calculated assuming the Bayesian age models spanned ±1 sigma uncertainties. At the interpolated age points, minimum and maximum depths were calculated in 500 Monte Carlo simulations of Gaussian white noise, which created 500 realizations of sedimentation rate between each set of age brackets. These simulations were used to calculate 1-sigma uncertainties on each increment’s sedimentation rate. The use of fixed age increments for calculation of sedimentation rates and uncertainties mitigates one possible bias of the so-called Sadler Effect, in which longer time increments may have lower apparent sedimentation rates.
We mapped seismic reflectors to determine sediment volumes, and ages for the reflectors were established by correlation with lithostratigraphy, physical properties, and down-hole well log data at the drill sites (Dataset S3). Mapping thus defined a 1.2- to 0-Ma sequence (III) and a 2.8- to 1.2-Ma sequence (II) (Fig. 3, Figs. S1 and S2, and Dataset S3), spanning depositional regions sourced from the Surveyor Channel (31) and deposits downslope of the Bering glacial trough and within the Aleutian Trench (Fig. 1A). Travel-time calculations made with Landmark Decision Space were converted to sediment volumes using a core and down-hole established p-wave velocity of 1,720 m/s, which is an average of velocities from Sequences II and III at sites U1417 and U1418 (Datasets S1 and S3). We included an estimate for the sediment subducted along the Aleutian Trench using a trapezoidal approximation for thickness of Sequences III and II currently being subducted past the Aleutian Trench deformation front (average of three along-trench transects of sediment thickness) multiplied by the average trench-normal MOREVEL2010 rate of regional Pacific Plate subduction (Datasets S1 and S3). The summation of fan volume and subducted sediment is a minimum estimate of total eroded sediment volume from the St. Elias orogen; volume uncertainties include those of velocity, vertical seismic resolution, subduction amount, and subduction rate (Datasets S1 and S3). Shelf sediments are excluded from efflux calculations, as they may be recycled into the orogen. The budget does not account for sediment lost from the deposystem, for example by long-distance ice rafted transport, or eolian transport.
Erosional efflux is determined using the subducted and fan sediment volumes corrected for porosity using an Expedition 341 derived average porosity of 0.48 (41). For tectonic influx, two cases for décollement depth were used based on the maximum imaged depth of faulting in seismic reflection data (16, 27) and correlated to a low-velocity zone in a jointly inverted tomographic velocity model (36). Values in Dataset S2 are based on the shallower décollement depth, but both options are included in Dataset S3. The GPS-derived shortening estimate is modeled with a southeast Alaska block that has relative motion with North America, and thus only shortening within the orogen is included (35). Sediment stored on the shelf seaward of the deformation front is not included in the efflux, but is included in the influx where above the shelf décollement. Porosity for the influx is set at 0.27, based on sidewall cores from industry well OCS Y-0211 within the undeformed part of the shelf (44). The efflux–influx difference is then reported to discuss orogen mass balance (Dataset S2, Fig. S7, and Dataset S3).
Fig. S7.
Monte Carlo uncertainty modeling results (1e6 simulations) of tectonic influx compared with erosional efflux. Options 1 and 2 differ only in depth to décollement.
All uncertainties reported are done using a square root of the sum of the squares method (Datasets S1−S4). Uncertainty estimates for volume, erosion rates, efflux, and influx were calculated based on published uncertainty or values established from data (Dataset S3). Uncertainty in Surveyor Fan area is calculated as the perimeter of the fan multiplied by the average distance (15 km) between seismic reflection profiles. Uncertainty in seismic resolution represents 1/4 wavelength of the dominant frequency. Subducted cross-sectional area uncertainty is 26% of the thickness range in three trench-parallel transects plus 5% due to non-St. Elias inputs (Fig. 1A). The uncertainty in amount of plate subducted is from MOREVEL2010. Uncertainty in p-wave sound velocity and fan porosity is from Expedition 341 data. For influx parameters, collision length uncertainty is due to uncertainty in the exact terminations of the Pamplona Zone associated with the Fairweather Fault to the northeast and the Transition Fault to the southwest (Fig. 1A). Uncertainty in the collision rate is from published GPS measurements (35). Shelf porosity uncertainty is from published values from industry well OCS Y-0211 (44). Uncertainty in the influx thickness was set at 0.25 km (Dataset S2) with an additional case for a décollement of 1 km deeper also examined (Dataset S3). Despite these uncertainties, there is a 90% probability in the difference in the efflux–influx between Sequence III and Sequence II (Datasets S2, S3, and S5).
Additional uncertainty analyses were performed using 104 (fan volume) and 106 (efflux–influx) Monte Carlo simulations of Gaussian white noise supplied with the SD of all influx–efflux values. Mean values of parameters and associated uncertainty used in the simulations with corresponding data sources are noted the supplementary Python code text files (ufdc.ufl.edu/IR00007101/00001). Matlab-formatted MAT files of Sequence II and II TWT isopachs are provided as supplementary files for use with Python code (ufdc.ufl.edu/IR00007100/00001). The Monte Carlo modeling was also adapted for sensitivity testing, where the value of each parameter was varied to span from 50% to 150% of the mean value, leaving all of the other values set to their mean value, and then the net change in flux value was calculated. Based on the sensitivity tests, for influx–efflux, Sequence III results are most affected by fan porosity, whereas, for Sequence II, results are most affected by the depth to the décollement. The effect of depth to the décollement on mass balance using the Monte Carlo tests is shown in Dataset S5, Fig. S7, and Dataset S3. The sign of the flux is also affected by length of deformation front and porosity on the shelf and by volume and cross-sectional area of subducting/accreting sediments in the fan.
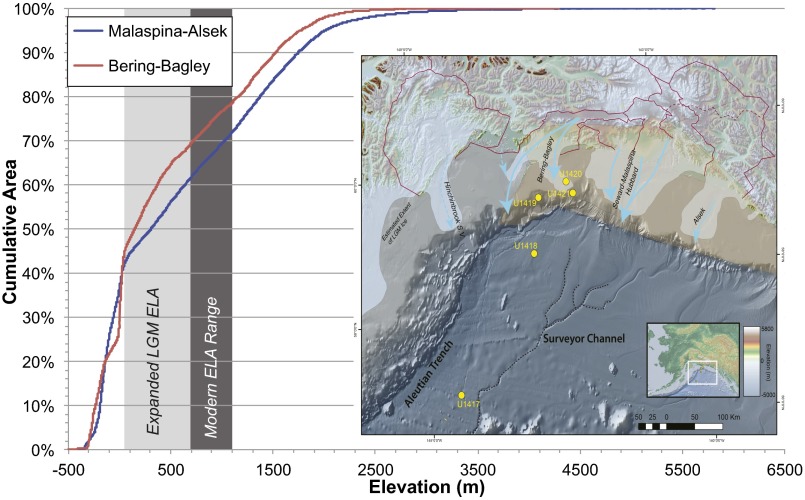
For completeness, determination of sediment yield based erosion rates is included (Dataset S4) (45). Equivalent erosion rates are shown; however, the validity of these values depends on establishing the glacial erosion area through time, which has yet to be established for this margin. An estimate of this area for the Last Glacial Maximum (LGM) is based on assuming maximum glacial erosion only for the areas of high relief between 100 m and 1,300 m elevation or 25–70% of total LGM drainage [the range limit of the equilibrium line altitude at modern and glacial maxima (46, 47)] (Fig. S6).
Fig. S6.
Estimated areas of the two LGM drainage basins, Malaspina−Alsek and Bering−Bagley, within the St. Elias orogen are shown [dashed where glacial divide differs from modern divide (47)]. Also shown is the range limit of the equilibrium line altitude at modern and glacial maxima using a range of 100–1,300 m of elevation. For an effective denudation rate, ∼45% of LGM Max area of high relief was used based on this graph to provide an estimate of the region where sustained glacial erosion rates are expected to be highest (Dataset S4).
SI Files
ufdc.ufl.edu/IR00007101/00001. Two programs written in Python to conduct Monte Carlo uncertainty modeling using parameters described in Dataset S3 and the seismic reflection isopachs in ufdc.ufl.edu/IR00007100/00001.
ufdc.ufl.edu/IR00007100/00001. Two Matlab-formatted MAT files of Seismic Sequences II (Seq_II.mat) and III (Seq_ III.mat). MAT files can be imported into Matlab, Python, and/or R programming languages and converted to other text formats if necessary. Spatial information (100-m cell size, US Geological Survey Alaska Albers NAD83 coordinate of upper left cell) is contained in array “spatial”; isopach in TWT is in array “Z.”
Supplementary Material
Acknowledgments
B. Horton, E. Screaton, P. Koons, and anonymous reviewers are thanked for their reviews. Expedition 341 was carried out by the Integrated Ocean Drilling Program (IODP). We thank the IODP-USIO and the captain and crew of the D/V JOIDES Resolution. This is University of Texas Institute for Geophysics Contribution 2812.
Footnotes
The authors declare no conflict of interest.
This article is a PNAS Direct Submission.
This article contains supporting information online at www.pnas.org/lookup/suppl/doi:10.1073/pnas.1512549112/-/DCSupplemental.
References
- 1.Roe GH, Stolar DB, Willett SD. Response of a steady-state critical wedge orogen to changes in climate and tectonic forcing. Spec Pap Geol Soc Am. 2006;398:227–239. [Google Scholar]
- 2.Koons PO. Two-sided orogen: Collision and erosion from the sandbox to the Southern Alps, New Zealand. Geology. 1990;18(8):679–682. [Google Scholar]
- 3.Whipple K. The influence of climate on the tectonic evolution of mountain belts. Nat Geosci. 2009;2(2):97–104. [Google Scholar]
- 4.Willett SD. Orogeny and orography: The effects of erosion on the structure of mountain belts. J Geophys Res. 1999;104(B12):28957–28982. [Google Scholar]
- 5.Beaumont C, Jamieson RA, Nguyen MH, Lee B. Himalayan tectonics explained by extrusion of a low-viscosity crustal channel coupled to focused surface denudation. Nature. 2001;414(6865):738–742. doi: 10.1038/414738a. [DOI] [PubMed] [Google Scholar]
- 6.Bouquillon A, France-Lanord C, Michard A, Tiercelin J-J. Sedimentology and isotopic chemistry of the Bengal Fan sediments: The denudation of the Himalaya. Proc Ocean Drill Program Sci Results. 1990;116:43–58. [Google Scholar]
- 7.France-Lanord C, Derry L, Michard A. Evolution of the Himalaya since Miocene time: Isotopic and sedimentological evidence from the Bengal Fan. Geol Soc Spec Publ. 1993;74(1):603–621. [Google Scholar]
- 8.Schwenk T, Spieß V. 2009. Architecture and stratigraphy of the Bengal Fan as response to tectonic and climate revealed from high-resolution seismic data. External Controls on Deep-Water Depositional Systems, eds Kneller B, Martinsen OJ, McCaffrey B, SEPM Special Publication (Soc Sediment Geol, Tulsa, OK), Vol 92, pp 107–131.
- 9.Vautravers MJ, et al. Paleoenvironmental records from the West Antarctic Peninsula drift sediments over the last 75 ka. Geol Soc Spec Publ. 2013;381:263–276. [Google Scholar]
- 10.Koppes M, et al. Observed latitudinal variations in erosion as a function of glacier dynamics. Nature. 2015;526(7571):100–103. doi: 10.1038/nature15385. [DOI] [PubMed] [Google Scholar]
- 11.Nygard A, et al. Extreme sediment and ice discharge from marine-based ice streams: New evidence from the North Sea. Geology. 2007;35(5):395–398. [Google Scholar]
- 12.Mix A, et al. 2003. ODP Leg 202 Initial Reports (Sites 1232–1242) (Ocean Drill Program, College Station, TX)
- 13.Jaeger JM, Nittrouer CA, Scott ND, Milliman JD. Sediment accumulation along a glacially impacted mountainous coastline: North-east Gulf of Alaska. Basin Res. 1998;10(1):155–173. [Google Scholar]
- 14.Blumberg S, et al. Turbiditic trench deposits at the South-Chilean active margin: A Pleistocene–Holocene record of climate and tectonics. Earth Planet Sci Lett. 2008;268(3):526–539. [Google Scholar]
- 15.Berger AL, et al. Quaternary tectonic response to intensified glacial erosion in an orogenic wedge. Nat Geosci. 2008;1(11):793–799. [Google Scholar]
- 16.Worthington LL, Gulick SPS, Pavlis TL. Coupled stratigraphic and structural evolution of a glaciated orogenic wedge, offshore St. Elias Orogen, Alaska. Tectonics. 2010;29(6):TC6013. [Google Scholar]
- 17.Pavlis TL, et al. Structure of the actively deforming fold-thrust belt of the St. Elias orogen with implications for glacial exhumation and 3D tectonic processes. Geosphere. 2012;8(5):991–1019. [Google Scholar]
- 18.Meigs A, Sauber J. Quat Sci Rev. 2000. Glacio-seismotectonics: Ice sheets, crustal deformation and seismicity. 19(4):1543–1562. [Google Scholar]
- 19.Tomkin JH, Roe GH. Climate and tectonic controls on glaciated critical-taper orogens. Earth Planet Sci. 2007;262(3):385–397. [Google Scholar]
- 20.Koppes MN, Montgomery DR. The relative efficacy of fluvial and glacial erosion over modern to orogenic timescales. Nat Geosci. 2009;2(9):644–647. [Google Scholar]
- 21.Peizhen Z, Molnar P, Downs WR. Increased sedimentation rates and grain sizes 2–4 Myr ago due to the influence of climate change on erosion rates. Nature. 2001;410(6831):891–897. doi: 10.1038/35073504. [DOI] [PubMed] [Google Scholar]
- 22.Molnar P. Late Cenozoic increase in accumulation rates of terrestrial sediment: How might climate change have affected erosion rates? Annu Rev Earth Planet Sci. 2004;32:67–89. [Google Scholar]
- 23.Moore TC, Jr, Heath GR. Survival of deep-sea sedimentary sections. Earth Planet Sci Lett. 1977;37(1):71–89. [Google Scholar]
- 24.Sadler PM. Sediment accumulation rates and the completeness of stratigraphic sections. J Geol. 1981;89:569–584. [Google Scholar]
- 25.Jerolmack DJ, Sadler P. Transience and persistence in the depositional record of continental margins. J Geophys Res. 2007;112(F3):F03S13. [Google Scholar]
- 26.Gulick SPS, et al. Seismic images of the Transition Fault and the unstable Yakutat-Pacific-North American triple junction. Geology. 2013;41(5):571–574. [Google Scholar]
- 27.Worthington LL, van Avendonk H, Gulick SPS, Christeson GL, Pavlis TL. Crustal structure of the Yakutat Terrane and the evolution of subduction and collision in southern Alaska. J Geophys Res. 2012;117(B1):B01102. [Google Scholar]
- 28.Lisiecki LE, Raymo ME. A Pliocene-Pleistocene stack of 57 globally distributed benthic δ18O records. Paleoceanography. 2005;20(1):PA1003. [Google Scholar]
- 29.Clark PU, et al. The middle Pleistocene transition: Characteristics, mechanisms, and implications for long-term changes in atmospheric CO2. Quat Sci Rev. 2006;25(23):3150–3184. [Google Scholar]
- 30.McClymont EL, Sodian SM, Rosell-Melé A, Rosenthal Y. Pleistocene sea-surface temperature evolution: Early cooling, delayed glacial intensification, and implications for the mid-Pleistocene climate transition. Earth Sci Rev. 2013;123:173–193. [Google Scholar]
- 31.Reece RS, Gulick SPS, Horton BK, Christeson GL, Worthington LL. Tectonic and climatic influence on the evolution of the Surveyor Fan and Channel system, Gulf of Alaska. Geosphere. 2011;7(4):830–844. [Google Scholar]
- 32.Hidy AJ, Gosse JC, Froese DG, Bond JD, Rood DH. A latest Pliocene age for the earliest and most extensive Cordilleran Ice Sheet in northwestern Canada. Quat Sci Rev. 2013;61:77–84. [Google Scholar]
- 33.Sadler PM, Jerolmack DJ. Scaling laws for aggradation, denudation and progradation rates: The case for time-scale invariance at sediment sources and sinks. Geol Soc Spec Publ. 2015;404(1):69–88. [Google Scholar]
- 34.Pedersen VK, Egholm DL. Glaciations in response to climate variations preconditioned by evolving topography. Nature. 2013;493(7431):206–210. doi: 10.1038/nature11786. [DOI] [PubMed] [Google Scholar]
- 35.Elliott J, Freymueller JT, Larsen CF. Active tectonics of the St. Elias orogen, Alaska, observed with GPS measurements. J Geophys Res. 2013;118(10):5625–5642. [Google Scholar]
- 36.Van Avendonk HJA, et al. Subduction and accretion of sedimentary rocks in the Yakutat collision zone, St. Elias orogen, Gulf of Alaska. Earth Planet Sci Lett. 2013;381:116–126. [Google Scholar]
- 37.Konstantinovskaya E, Malavieille J. Thrust wedges with décollement levels and syntectonic erosion: A view from analog models. Tectonophysics. 2011;502(3):336–350. [Google Scholar]
- 38.Rea D, Snoeckx H. Sediment fluxes in the Gulf of Alaska: Paleoceanographic record from Site 887 on the Patton-Murray Seamount platform. Proc Ocean Drill Program Sci Results. 1995;145:247–256. [Google Scholar]
- 39.Godard V, et al. Dominance of tectonics over climate in Himalayan denudation. Geology. 2014;42(3):243–246. [Google Scholar]
- 40.Scherler D, Bookhagen B, Strecker MR. Tectonic control on 10Be-derived erosion rates in the Garhwal Himalaya, India. J Geophys Res. 2014;119(2):83–105. [Google Scholar]
- 41.Jaeger JM, et al. 2014. Methods. Proceedings of the Integrated Ocean Drilling Program, eds Jaeger JM, Gulick SPS, LeVay LJ, Expedition 341 Scientists (Integr Ocean Drill Program, College Station, TX), Vol 341.
- 42.Davies MH, et al. The deglacial transition on the southeastern Alaska Margin: Meltwater input, sea level rise, marine productivity, and sedimentary anoxia. Paleoceanography. 2011;26(2):PA2223. [Google Scholar]
- 43.Blaauw M, Christen JA. Flexible paleoclimate age-depth models using an autoregressive gamma process. Bayesian Anal. 2011;6(3):457–474. [Google Scholar]
- 44.Risley DE, et al. 1992. Appendices B–F. Geologic Report for the Gulf of Alaska Planning Area, ed Turner RF (Minerals Manage Serv, Anchorage, AK), OCS Rep MMS 92-0065.
- 45.Elverhøi A, et al. The growth and decay of the Late Weichselian ice sheet in western Svalbard and adjacent areas based on provenance studies of marine sediments. Quat Res. 1995;44(3):303–316. [Google Scholar]
- 46.Manley W, Kaufman DS. Alaska Paleoglacier Atlas. Inst Arct Alp Res Univ; Boulder, CO: 2002. [Google Scholar]
- 47.Stroeven AP, et al. Investigating the glacial history of the northern sector of the Cordilleran Ice Sheet with cosmogenic 10Be concentrations in quartz. Quat Sci Rev. 2010;29(25):3630–3643. [Google Scholar]
- 48.Davies-Walczak M, et al. Late Glacial to Holocene radiocarbon constraints on North Pacific Intermediate Water ventilation and deglacial atmospheric CO2 sources. Earth Planet Sci Lett. 2014;397:57–66. [Google Scholar]
Associated Data
This section collects any data citations, data availability statements, or supplementary materials included in this article.


