Significance
Inhibition of Wee1 is considered an attractive anticancer therapy for TP53 mutant tumors. However, additional factors besides p53 inactivation may determine Wee1 inhibitor sensitivity, which we searched for using unbiased functional genetic screening. We discovered that the mutational status of several S-phase genes, including CDK2, determines the cytotoxicity induced by Wee1 inhibition. Notably, we found that Wee1 inhibition induces two distinct phenotypes: accumulation of DNA damage in S phase and karyokinesis/cytokinesis failure during mitosis. Stable depletion of S-phase genes only reversed the formation of DNA damage, but did not rescue karyokinesis/cytokinesis failure upon Wee1 inhibition. Thus, inactivation of nonessential S-phase genes can overcome Wee1 inhibitor resistance, while allowing the survival of genomically instable cancer cells.
Keywords: cell cycle, checkpoint, AZD-1775, MK-1775, polyploidy
Abstract
The Wee1 cell cycle checkpoint kinase prevents premature mitotic entry by inhibiting cyclin-dependent kinases. Chemical inhibitors of Wee1 are currently being tested clinically as targeted anticancer drugs. Wee1 inhibition is thought to be preferentially cytotoxic in p53-defective cancer cells. However, TP53 mutant cancers do not respond consistently to Wee1 inhibitor treatment, indicating the existence of genetic determinants of Wee1 inhibitor sensitivity other than TP53 status. To optimally facilitate patient selection for Wee1 inhibition and uncover potential resistance mechanisms, identification of these currently unknown genes is necessary. The aim of this study was therefore to identify gene mutations that determine Wee1 inhibitor sensitivity. We performed a genome-wide unbiased functional genetic screen in TP53 mutant near-haploid KBM-7 cells using gene-trap insertional mutagenesis. Insertion site mapping of cells that survived long-term Wee1 inhibition revealed enrichment of G1/S regulatory genes, including SKP2, CUL1, and CDK2. Stable depletion of SKP2, CUL1, or CDK2 or chemical Cdk2 inhibition rescued the γ-H2AX induction and abrogation of G2 phase as induced by Wee1 inhibition in breast and ovarian cancer cell lines. Remarkably, live cell imaging showed that depletion of SKP2, CUL1, or CDK2 did not rescue the Wee1 inhibition-induced karyokinesis and cytokinesis defects. These data indicate that the activity of the DNA replication machinery, beyond TP53 mutation status, determines Wee1 inhibitor sensitivity, and could serve as a selection criterion for Wee1-inhibitor eligible patients. Conversely, loss of the identified S-phase genes could serve as a mechanism of acquired resistance, which goes along with development of severe genomic instability.
Precise cell cycle control is critical for proliferating cells, especially under conditions of genomic stress. Modulation of the cell cycle checkpoint machinery is therefore often proposed as a therapeutic strategy to potentiate anticancer therapy (1). Therapeutic inhibition of checkpoint kinases can deregulate cell cycle control and improperly force cell cycle progression, even in the presence of DNA damage. Chemical inhibitors for several cell cycle checkpoint kinases have been developed. Preclinical research, however, has shown that the efficacy of therapeutic checkpoint inhibition is context-sensitive and depends on the genetic make-up of an individual cancer (2, 3). Therefore, to optimally implement such novel inhibitors in the clinic, the molecular characteristics that determine inhibitor activity need to be identified to select eligible patients and to anticipate on mechanisms of acquired resistance.
In response to cellular insults like DNA damage, cells activate cell cycle checkpoints to arrest proliferation at the G1/S or G2/M transition. These checkpoints operate by controlling the inhibitory phosphorylation on cyclin-dependent kinases (CDKs), key drivers of the cell cycle (4). Most of the current knowledge concerns the regulation of Cdk1, which is phosphorylated by the Wee1 kinase at tyrosine (Tyr)-15 to prevent unscheduled Cdk1 activity (5, 6). Conversely, timely activation of Cdk1 depends on Tyr-15 dephosphorylation by one of the Cdc25 phosphatases (7–10). When DNA is damaged, the downstream DNA damage response (DDR) kinases Chk1 and Chk2 inhibit Cdc25 phosphatases through direct phosphorylation, which blocks Cdk1 activation (11–13). Cdk2 appears to be under similar checkpoint control and is also phosphorylated by Wee1 on Tyr-15, which prevents unscheduled S-phase entry. Conversely, Cdk2 must be dephosphorylated by Cdc25 phosphatases to become active, a process which is also controlled by the DDR (14, 15). In addition to this fast-acting kinase-driven DDR network, a transcriptional program is activated through p53 stabilization (16). Among the many p53 target genes, expression of the CDK inhibitor p21 is induced to mediate a sustained G1/S cell cycle arrest, which makes the G1/S checkpoint largely dependent on p53 (17). Many human tumors lack functional p53, and consequently cannot properly arrest at the G1/S transition. TP53-mutant cancers therefore enter S phase even in the presence of DNA damage and depend strongly on their G2/M checkpoint control for genomic stability. In line with this notion, therapeutic targeting of G2/M checkpoint kinases was proposed to improperly force p53-defective cells to progress through the cell cycle in the presence of DNA damage (1).
Wee1 is one of the G2/M cell cycle checkpoint kinases for which selective chemical inhibitors have been developed as anticancer drugs (3, 18). Inhibition of Wee1 potentiates DNA-damaging chemotherapeutics and radiotherapy and has cytotoxic effects as a single agent (19–22). The consensus view is that Wee1 inhibition facilitates tumor cell killing through G2/M checkpoint inactivation, which would catalyze mitotic catastrophe (23–25). As expected, Wee1 inhibition is synergistic with DNA-damaging agents, specifically in TP53-mutant cancer cell lines (3). However, a recent study indicated that only a subset of TP53-mutant patient-derived pancreatic cancer xenografts showed benefit from Wee1 inhibition (21). This indicates that molecular determinants other than TP53 mutation status control the cytotoxic effects of Wee1 inhibition, but these determinants are currently unknown.
To improve cancer patient selection for Wee1 inhibitor treatment, to uncover possible mechanisms of resistance, and to help understand how Wee1 inhibitors mediate cytotoxicity, we aimed to identify gene mutations that determine sensitivity to Wee1 inhibition. To this end, we performed a functional genetic screen using unbiased generation of gene knockouts to identify gene mutations that confer resistance to Wee1 inhibition in a TP53-mutant background. Our data suggest that Wee1 inhibitor sensitivity is determined by the status of multiple genes that control S-phase entry. In addition, we uncovered that aberrant cytokinesis and the ensuing genomic instability is a thus far unrecognized adverse consequence of Wee1 inhibition in cancer cells that are Wee1 inhibitor-resistant.
Results
A Functional Haploid Genetic Screen Reveals S-Phase Genes as Determinants of Wee1 Inhibitor Sensitivity.
To identify genetic factors that determine the sensitivity of TP53-mutant cancer cells to Wee1 inhibition, a loss-of-function genetic screen was performed in the near-haploid human KBM-7 cell line, which harbors a serine (Ser)-to-glutamine (Glu) missense mutation at Ser-215 in p53 (26). The near-haploid karyotype of the KBM-7 cells allows “gene-trap” retroviruses that carry a strong splice acceptor to randomly create instantaneous gene knockouts, a process referred to as insertional mutagenesis.
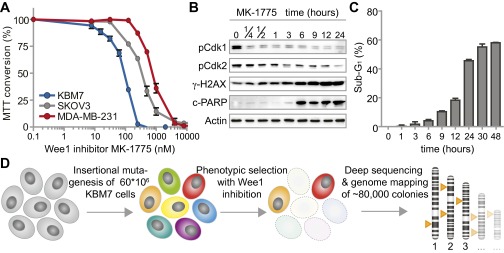
Cytotoxicity assays revealed that KBM-7 cells were even more sensitive to Wee1 inhibitor MK-1775 (also called AZD-1775) than the TP53-mutant MK-1775-sensitive cell lines MDA-MB-231 and SKOV3 (Fig. S1A). Based on these results, we selected the IC95 dose of MK-1775 (300 nM) to study the kinetics of cell death induced by Wee1 inhibition in KBM-7 cells. Time-course analysis of Cdk1 phosphorylation at Tyr-15 revealed that Wee1 inhibition was effective within 15 min after administration (Fig. S1B). Also, Wee1 inhibition resulted in reduced levels of Cdk2 phosphorylation at Tyr-15, and elevated γ-H2AX levels as described (25). MK-1775-induced cell death was visible from 6 h of treatment onwards, as evidenced by PARP cleavage (Fig. S1B) and the appearance of cells with sub-G1 DNA content (Fig. S1C).
Fig. S1.
Mutations in G1/S regulatory genes are enriched in KBM-7 cells that survive MK-1775 treatment. (A) KBM-7, MDA-MB-231, and SKOV3 cells were treated with increasing MK-1775 concentrations and viability was assessed 72 h after treatment using methyl thiazol tetrazolium (MTT). Averages and error bars of at least three replicates are shown. (B) KBM-7 cells were treated with MK-1775 (300 nM) for indicated time points and analyzed by Western blotting for indicated proteins. (C) KBM-7 cells were treated with MK-1775 (300 nM) and cell cycle profiles were determined at indicated time points by flow cytometric analysis after staining with propidium iodide. Plotted are the average percentages and SDs of sub-G1 cells from three experiments. (D) Schematic representation of the genetic screen with the Wee1 inhibitor MK-1775 in KBM-7 cells.
Due to the effective induction of apoptosis within 48 h of incubation (Fig. S1C), and near-complete cell death within 72 h (Fig. S1A), we were able to use this setup for screening gene mutations that confer resistance to Wee1 inhibitor treatment. Approximately 60 million KBM-7 cells were randomly mutagenized using retroviral delivery of gene-trap virus. After mutagenesis, KBM-7 cells were treated with Wee1 inhibitor, and the surviving cells were allowed to grow colonies for 14 d. Integration sites of ∼80,000 colonies were subsequently identified using massive parallel sequencing and were mapped to the human genome (Fig. S1D and Dataset S1) (27).
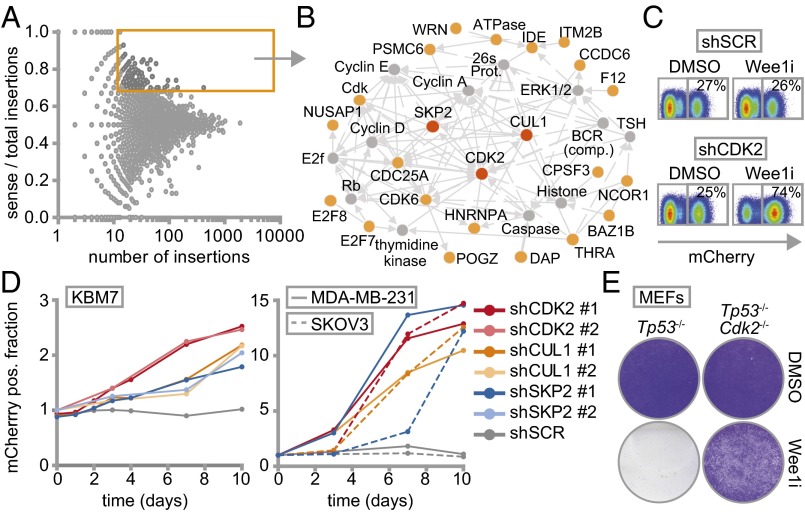
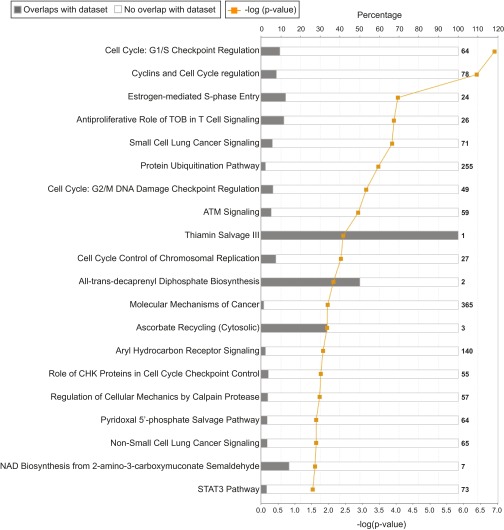
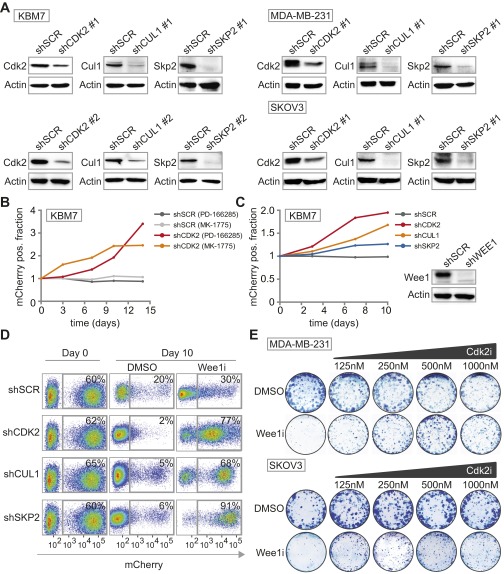
Insertion site mapping identified 142 genes that fulfilled the criteria of having ≥15 gene-trap insertions and a ≥0.7 fraction of insertions in sense orientation (Fig. 1A and Dataset S2). Network and pathway enrichment analysis of the selected genes revealed G1/S regulatory control genes to be preferentially mutated in the surviving colonies (Fig. 1B and Fig. S2). Of these, SKP2 (S-Phase kinase-associated protein 2), CUL1 (Cullin 1), and CDK2 (cyclin-dependent kinase 2) were selected for further validation. To this end, we infected nonmutagenized KBM-7 cells with plasmids harboring both an IRES-driven mCherry fluorescence reporter and shRNA cassette (28), targeting either SKP2, CUL1, or CDK2. In line with our screening data, KBM-7 cells stably depleted of SKP2, CUL1, or CDK2, but not control-depleted cells (shSCR), outcompeted noninfected cells when Wee1 was inhibited, as evidenced by a gradual increase of mCherry-positive cells in Wee1 inhibitor-treated cultures compared with DMSO-treated cells (Fig. 1 C and D and Fig. S3A). Importantly, results were observed with two shRNAs per gene, and were confirmed with the structurally nonrelated Wee1 inhibitor PD-166285 (Fig. S3B), as well as with shRNA-mediated Wee1 inactivation (Fig. S3C).
Fig. 1.
Haploid genetic screen identifies S phase genes as determinants of Wee1 inhibitor sensitivity. (A) Identification of gene-trap insertions enriched in sense orientation in MK-1775-selected KBM-7 cells. Y axis indicates fraction of gene-traps in sense orientation compared with total insertions. X axis indicates number of gene-trap insertions. (B) Network modeling with 142 genes enriched in sense orientation. Most significant module is shown. Red and yellow proteins were identified in the screen. Indirect (dashed lines) and direct interactions (solid lines) are indicated. Arrowheads indicate interaction direction. (C) Flow cytometric analysis of pLKO.mCherry transduced KBM-7 cells 10 d after MK-1775 (150 nM) or DMSO treatment. (D) Ratio of mCherry-positive cells of Wee1-inhibited vs. DMSO-treated KBM-7 cells (150 nM MK-1775) and MDA-MB-231/SKOV3 cells (1 µM MK-1775). (E) Nontransformed Tp53−/−,Cdk2−/−, or Tp53−/− MEFs were treated for 4 d with 500 nM MK1775 or DMSO, and stained with crystal violet.
Fig. S2.
Canonical pathways of mutated genes, enriched in MK-1775–resistant KBM-7 cells. Canonical pathway analysis was performed with the 142 selected genes using Ingenuity Pathway Analysis (IPA) software (Qiagen). Presented are the canonical pathways that have a −log(P value) score greater than 1.5.
Fig. S3.
Knockdown efficiencies of S-phase genes and long-term survival assay with chemical Cdk2 inhibition. (A) KBM-7, MDA-MB-231 and SKOV3 cells were transduced with indicated shRNA vectors. Knockdown efficiencies of the various shRNAs were assessed by Western blotting. (B) Flow cytometric analysis of pLKO.mCherry transduced KBM-7 cells treated with Wee1 inhibitor PD-166285 (2.5 nM). The ratio of mCherry-positive KBM-7 cells in Wee1-inhibited versus DMSO-treated cells is presented. (C) Flow cytometric analysis of KBM-7 cells transduced with pLKO.mCherry-SCR or pLKO.mCherry-CDK2 in combination with pLKO.puro-WEE1 or pLKO.puro-SCR. The ratio of mCherry-positive KBM-7 cells in Wee1-depleted versus control-depleted cells at indicated time points is shown in the graph. WEE1 shRNA knockdown efficiency was assessed by Western blotting and is shown on the left. (D) Flow cytometric analysis of pLKO.mCherry transduced MDA-MB-231 cells at day 0 and 10 d after MK-1775 (1 µM) or DMSO treatment is indicated. (E) Long-term clonogenic survival assay of MDA-MB-231 and SKOV3 cells treated with increasing concentrations of Cdk2 inhibitor SU-9516 with or without MK-1775 (500 nM).
Because KBM-7 cells are grown in suspension, are of leukemic origin and near-haploid genotype, they represent a very specific cancer entity and are more difficult to use for various follow-up experiments than adherent cells. Therefore, we validated whether CDK2, SKP2, or CUL1 inactivation also causes resistance to Wee1 inhibition in MDA-MB-231 breast cancer and SKOV3 ovarian cancer cell lines. MDA-MB-231 and SKOV3 cells were infected with shRNAs targeting CDK2, SKP2, or CUL1 while expressing IRES-driven mCherry (Fig. 1D and Fig. S3A). Under nonchallenged conditions, MDA-MB-231 and SKOV3 cells in which CDK2, SKP2, or CUL1 were silenced were gradually lost from cultures, indicating that these genes contribute to cell proliferation or survival (Fig. S3D). However, when the same cells were treated with Wee1 inhibitor, we found that cells depleted of CDK2, SKP2, or CUL1 drastically outcompeted noninfected cells (Fig. 1D and Fig. S3D), confirming the results in KBM-7 cells. In addition, chemical Cdk2 inhibition also rescued cytotoxicity induced by Wee1 inhibition in long-term proliferation assays, both in MDA-MB-231 and SKOV3 cells (Fig. S3E). Finally, nontransformed as well as Ras-V12-transformed Tp53−/−,Cdk2−/− mouse embryonic fibroblasts (MEFs) (29) were highly resistant to Wee1 inhibition in contrast to Tp53−/− MEFs, indicating that Cdk2 is a cross-species determinant of Wee1 inhibitor sensitivity, regardless of oncogene status (Fig. 1E and Fig. S4 A and B). Thus, by combining an unbiased genetic screen with shRNA and knockout-based follow-up experiments, we identified G1/S-phase regulators as generic factors in determining Wee1 inhibitor sensitivity.
Fig. S4.
Nontransformed and Ras-V12-transformed Tp53−/−, Cdk2−/− MEFs are resistant to Wee1 inhibition. (A) Four-day survival assay of Ras-V12-transformed Tp53−/−, Cdk2−/−, or Tp53−/− MEFs treated with MK-1775 (500 nM) or DMSO. After 4 d of treatment, cells were fixed, stained with crystal violet solution, and photographed. (B) Nontransformed Tp53−/−, Cdk2−/−, or Tp53−/− MEFs were grown in the presence of MK-1775 (500 nM) or DMSO. Relative cell viability was measured after 4 d by crystal violet quantification. Averages and SDs of two independent experiments are indicated.
Wee1 Inhibition Is Preferentially Cytotoxic in S-Phase Cells.
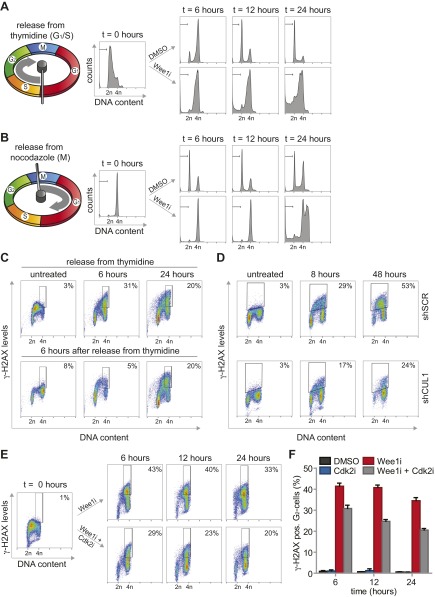
Despite the well described function of Wee1 in the G2/M transition, no clear regulators of the G2/M cell cycle transition were identified in our screen. Rather, the enrichment for G1/S regulatory genes suggested that Wee1 inhibition predominantly exerts its cytotoxic effects during S phase. To test this hypothesis, we inhibited Wee1 in MDA-MB-231 cells that were synchronized at the G1/S transition using thymidine (Fig. S5A). Treatment with Wee1 inhibitor immediately following thymidine wash-out resulted in robust induction of cells with sub-G1 DNA content, already emerging at ∼12 h after treatment (14.1% ± 2%, Fig. 2A and Fig. S5A). To test whether cell death induced by Wee1 inhibition requires S-phase progression, we applied Wee1 inhibitor after cells had completed S phase. To this end, we synchronized cells in prometaphase using the reversible microtubule polymerase inhibitor nocodazole (Fig. S5B). Upon nocodazole wash-out, cells synchronously exited mitosis to form G1 cells (Fig. S5B, Upper). When Wee1 was inhibited at the time of nocodazole wash-out, no significant increase in sub-G1 cells was observed at 12 h after treatment, suggesting that cells indeed require ongoing S-phase progression for Wee1 inhibition-induced cytotoxicity (4% ± 0.7%, Fig. 2A). In line with this notion, cell death was induced in cells treated with Wee1 inhibitor during mitotic exit, but only at late time points, when these cells presumably entered a next round of S phase (Fig. S5B). Thus, S-phase progression appears to be responsible for the cytotoxic effect of Wee1 inhibition.
Fig. S5.
Reduced γ-H2AX formation after combined inhibition of Wee1 and Cdk2. (A) MDA-MB-231 cells were synchronized at the G1/S transition using thymidine, and were treated with MK-1775 (4 µM) or DMSO upon release. At indicated time points, cells were fixed and stained with propidium iodide. Cell cycle profiles were determined by flow cytometry. (B) MDA-MB-231 cells were synchronized in mitosis using nocodazole. Upon nocodazole wash-out, cells were treated with MK-1775 (4 μM) or DMSO and analyzed as in A. (C) MDA-MB-231 cells were synchronized at the G1/S transition using thymidine and treated with or without MK-1775 directly or at 6 h after thymidine wash-out. Cells were fixed at indicated time points and stained for γ-H2AX/Alexa-488 and propidium iodide and analyzed by flow cytometry. (D) Flow cytometric analysis of pLKO.mCherry transduced MDA-MB-231 cells treated with MK-1775 (4 μM). Cells were fixed at indicated time points and stained for γ-H2AX and propidium iodide. (E and F) MDA-MB-231 cells were synchronized at the G1/S transition with thymidine. Upon thymidine wash-out, cells were treated with MK-1775 (4 μM) and/or with SU-9516 (1 μM). Cells were fixed at indicated time points and subjected to γ-H2AX/Alexa-488 staining and propidium iodide staining and analyzed by flow cytometry. Positive staining for γ-H2AX in G2-cells was quantified with FlowJo, using gates as indicated in the figure panels. Representative images of MK-1775–treated and MK-1775/SU-9516–treated cells are indicated in E. The averages and SDs of γ-H2AX–positive cells of two experiments are presented in F.
Fig. 2.
Wee1 inhibition exerts its cytotoxic effects during S phase. (A) MDA-MB-231 cells were synchronized in G1/S by thymidine or in G2/M by nocodazole. Cells were treated with MK-1775 (4 μM) or DMSO upon wash-out, fixed at indicated time points and stained for propidium iodide. Shown is the percentage of sub-G1 cells, calculated as the mean of three experiments (*P < 0.05, **P < 0.01, Student’s t test). (B) Thymidine synchronized MDA-MB-231 cells were treated with or without MK-1775 (4 μM) directly or 6 h after wash out. Cells were fixed at indicated time points and stained for γ-H2AX (DNA damage) and propidium iodide. The mean of the percentage of γ-H2AX–positive cells of two experiments is shown (**P < 0.01, ***P < 0.001, Student’s t test). (C) pLKO.mCherry transduced MDA-MB-231 cells were treated with MK-1775 (4 μM). Cells were fixed at indicated time points and stained as in B. The mean of the percentage of γ-H2AX–positive cells of two experiments is shown (*P < 0.05, **P < 0.01, Student’s t test). In all figures error bars indicate SD.
A remarkable observation during these experiments was that Wee1 inhibition during release from a nocodazole-induced mitotic arrest precluded the emergence of G1 cells (Fig. S5B). Specifically, when Wee1 was inhibited during mitotic exit, cells remained with 4N DNA and at later points entered endoreplication indicated by >4N DNA content (Fig. S5B). This phenomenon could indicate a role for Wee1 in promoting mitotic exit, or a Wee1 inhibitor-induced defect in cytokinesis, resulting in tetraploid G1 cells.
To assess whether the cytotoxic potential of Wee1 inhibition during S phase was related to DNA break accumulation, we analyzed γ-H2AX levels over time after Wee1 inhibition (Fig. 2B and Fig. S5C). When MDA-MB-231 cells were treated immediately following release from a thymidine block, a substantial percentage of G2 cells stained positive for γ-H2AX (32% ± 2% at 6 h, Fig. 2B and Fig. S5C, Upper). A large fraction of DNA lesions persisted up to 48 h after release (22% ± 1.2%, Fig. 2B and Fig. S5C, Upper) and induction of these DNA breaks required cells to be in S phase, as treatment after S-phase completion (at 6 h after thymidine wash-out) prevented the accumulation of γ-H2AX–positive G2 cells (6% ± 0.6%, Fig. 2B and Fig. S5C, Lower).
To subsequently test whether inactivation of the identified G1/S regulatory genes could rescue γ-H2AX formation, we combined Wee1 inhibition with stable depletion of SKP2 or CUL1, or with chemical Cdk2 inhibition (Fig. 2B and Fig. S5 D–F). Depletion of CUL1 or SKP2 resulted in an approximately twofold reduction in γ-H2AX–positive cells after 48 h of Wee1 inhibition (23% ± 0.8% and 35% ± 0.1% respectively versus 53% ± 1% in control-depleted cells, Fig. 2C), as did Cdk2 inhibition after 24 h (21% ± 1% versus 35% ± 2% in Wee1-inhibited cells, Fig. S5 E and F). Collectively, these results indicated that Wee1 inhibition leads to γ-H2AX accumulation, which can be prevented by genetic or chemical interference with S-phase regulators.
Live Cell Imaging Uncovers Loss of G2 Phase Upon Wee1 Inhibition, Which Is Rescued by Depletion of S-Phase Regulatory Genes.
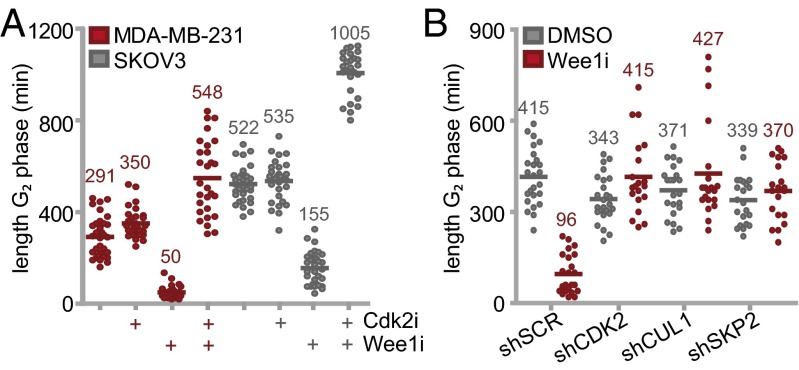
The observed cell cycle-dependent accumulation of DNA breaks and the defects in mitotic exit upon Wee1 inhibition prompted us to study the effects of Wee1 inhibition on cell cycle progression in more detail. To do so without chemical synchronization, we used the fluorescence ubiquitination cell cycle indicator (FUCCI) system (30). Monoclonal MDA-MB-231 or SKOV3 cell lines stably expressing FUCCI vectors were treated with Wee1 inhibitor and analyzed for 62 h using video microscopy. Whereas control-treated cells progressed through the cell cycle with a G2 duration between ∼5 and ∼9 h in MDA-MB-231 and SKOV3 respectively, Wee1 inhibition resulted in a decreased G2 length (5.9-fold and 3.4-fold in MDA-MB-231 or SKOV3, respectively), with consequent mitotic entry almost directly from S phase (Fig. 3A and Fig. S6A). In line with our screening data and flow cytometry results, Cdk2 inhibition restored or even prolonged G2 duration (548 ± 162 and 1,005 ± 94 min in MDA-MB-231 and SKOV3 respectively, Fig. 3A), whereas Cdk2 inhibition alone did not markedly alter G2 length (Fig. 3A). Analogously, stable depletion CDK2, SKP2, or CUL1 also rescued G2-phase shortening upon Wee1 inhibition (Fig. 3B). Thus, Wee1 inhibition leads to G2-phase abrogation, which is rescued by inactivation of identified S-phase regulatory genes.
Fig. 3.
Wee1 inhibition abrogates G2 phase. (A) FUCCI-MDA-MB-231 or FUCCI-SKOV3 cells were treated with 4 μM MK-1775 and/or 1 μM Cdk2 inhibitor SU-9516 and were subsequently imaged every 7 min for 62 h. The duration of G2 phase was analyzed for >28 cells per condition. (B) pLKO.puro transduced FUCCI-MDA-MB-231 cells were treated with or without MK-1775 (4 μM) and were imaged as described in A. The duration of G2 phase was analyzed for >20 cells per condition.
Fig. S6.
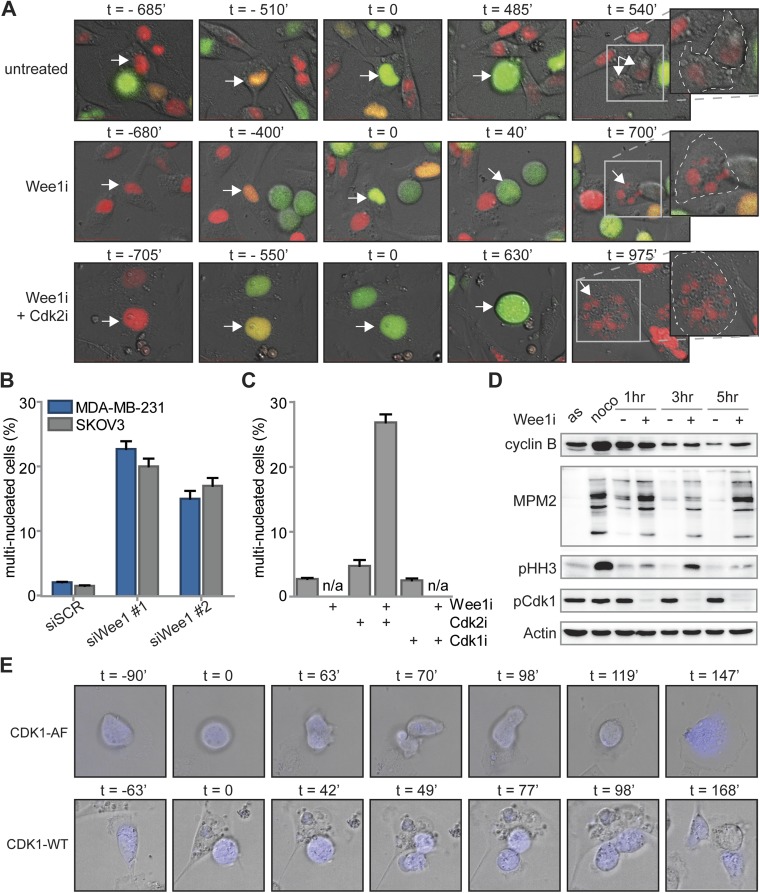
Inhibition or siRNA-mediated depletion of Wee1 induces cytokinesis failure. (A) FUCCI-MDA-MB-231 cells were left untreated or were treated with MK-1775 (4 μM) alone or in combination with SU-9516 (1 μM). Subsequently, cells were imaged every 7 min for 62 h. Progression from S via G2 into M phase was monitored using FUCCI reporters to score the duration of G2 phase. Representative experiments are shown, with t = 0 denoting the onset of G2 phase. Zoom-in images of right-most panels indicate cell boundaries (dashed lines) and nuclear content (arrows) after cell division. (B) MDA-MB-231 and SKOV3 cells were transfected with SCR or Wee1 siRNA. After 4 d, cells were fixed and stained as described in (Fig. 4B). The percentage of multinucleated cells was quantified and averages and SDs of two experiments are indicated. (C) Quantification of the percentages of multinucleated MDA-MB-231 cells, treated and imaged as in (Fig. 4B). (D) MDA-MB-231 cells were left untreated (asynchronous, AS) or were treated with nocodazole for 16 h. Mitotic cells after nocodazole treatment were obtained by mitotic shake-off and replated in the presence or absence of MK-1775 (4 μM). At indicated time points, cells were harvested and processed for immunoblotting. (E) MDA-MB-231 cells were transiently transfected with CDK1-AF-CFP or CDK1-WT-CFP. Subsequently, cells were treated with MK-1775 (4 μM) and live cell images for DIC and CFP were obtained every 7 min for 62 h. Mitotic progression was monitored and scored for normal or aberrant mitotic exit. Representative images are shown, with t = 0 denoting the onset of mitosis.
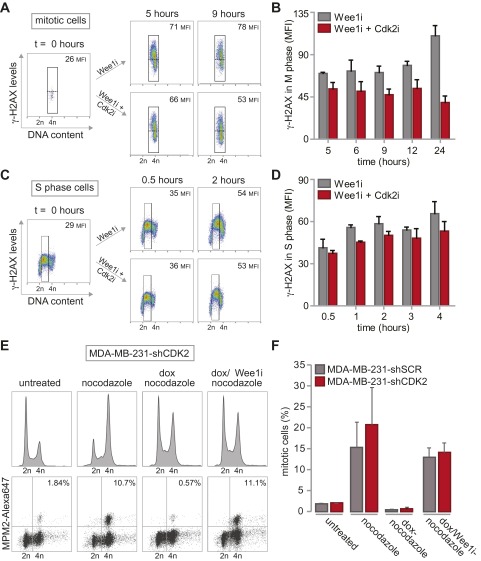
The rescue of G2 length in Cdk2-inactivated cells coincided with the ability of cells to reduce the amount of DNA breaks before mitotic entry (Fig. S7 A and B), suggesting that a sufficiently long G2 phase is required for DNA repair or that Cdk2 affects DNA repair, as suggested previously (31). In contrast, Cdk2 inactivation did not influence the initial amount of DNA damage generated during S phase upon Wee1 inactivation (Fig. S7 C and D), nor did it alter the ability of Wee1 inhibition to abrogate the G2/M checkpoint (Fig. S7 E and F). It thus appears that a regained ability to repair DNA during G2 mechanistically underpins the ability of Cdk2 axis inactivation to rescue Wee1 inhibitor-induced toxicity.
Fig. S7.
G2/M checkpoint function and DNA damage formation during replication is not altered by Cdk2 inactivation. (A and B) MDA-MB-231 cells were synchronized at the G1/S transition with thymidine. Upon thymidine wash-out, cells were treated with MK-1775 (4 μM) and/or SU-9516 (1 μM). Cells were fixed at indicated time points and stained for MPM2/Alexa-488, γ-H2AX/Alexa-647 and propidium iodide and analyzed by flow cytometry. For analysis of γ-H2AX in mitotic cells, MPM2-positive cells were gated, and MFI of γ-H2AX was quantified. Representative images of MK-1775–treated and MK-1775/SU-9516–treated cells are shown in A. The averages and SDs of γ-H2AX MFI of two experiments are presented in B. (C and D) MDA-MB-231 cells were synchronized and treated as in A. Cells were fixed at indicated time points and stained for γ-H2AX/Alexa-647 and propidium iodide and analyzed by flow cytometry. Mean fluorescence intensity (MFI) of γ-H2AX in S phase was quantified. Representative images of MK-1775–treated and MK-1775/SU-9516–treated cells are indicated in C. The averages and SDs of γ-H2AX MFI of two experiments are presented in D. (E) Control-depleted or Cdk2-depleted MDA-MB-231 cells were treated with doxorubicin (dox, 1μM) for 16 h. Thirty minutes after doxorubicin treatment, nocodazole was added to cultures (250 ng/mL). If indicated MK-1775 (4 µM; Wee1i) was added at the time of doxorubicin treatment. Mitotic cells were identified based on MPM2 reactivity. Representative DNA profiles MPM2 plots are indicated for Cdk2-depleted cells. (F). Quantification of data from E. Averages and SDs of two independent experiments are shown.
Wee1 Inhibition Results in Cytokinesis Failure.
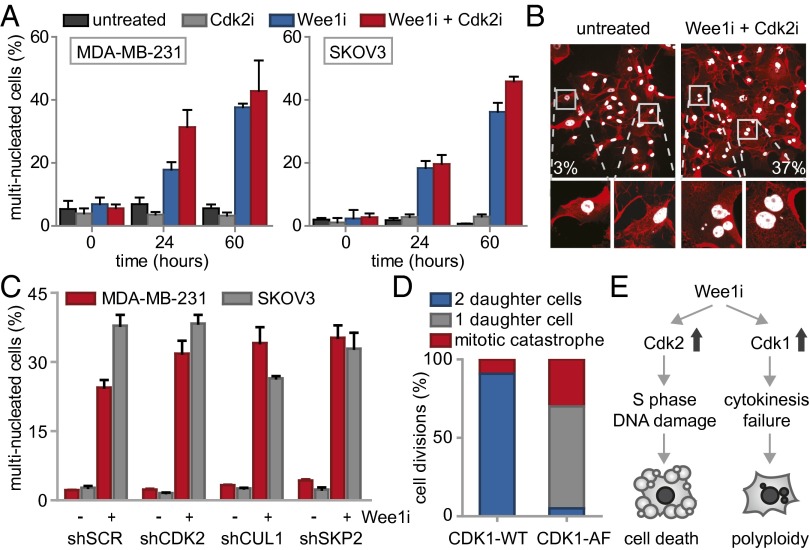
Besides the observed G2-phase abrogation, we noticed that Wee1 inhibition during mitosis resulted in abnormal mitotic exit (Fig. S6A). We therefore analyzed the number of cells displaying aberrant mitotic exit upon Wee1 inhibition using live cell microcopy, and observed widespread cytokinesis failure, leading to G1 cells with multiple nuclei (Fig. 4A). siRNA-mediated silencing of Wee1 induced similar cytokinesis defects with consequent increases in multinucleated cells, confirming the results obtained with the Wee1 inhibitor (Fig. S6B). The observed cytokinesis failure explained the flow cytometry results in which nocodazole-released cells remained with 4N DNA content after mitotic exit (Fig. S5B). Interestingly, when inhibition of Wee1 was combined with Cdk2 inhibition, aberrant mitotic exit was not reverted, and multinucleation induced by Wee1 inhibition persisted (Fig. 4A). Importantly, the observation that Cdk2 inhibition rescued Wee1 inhibitor-induced γ-H2AX induction, G2 abrogation and cytotoxicity, but not cytokinesis failure, suggests that cytokinesis failure does not compromise cell viability per se and is independent of Cdk2.
Fig. 4.
Wee1 inhibition induces Cdk1-dependent cytokinesis failure. (A) FUCCI-MDA-MB-231 cells were treated and imaged as in Fig. 3 and Fig. S6A. The percentages of multinucleated MDA-MB-231 and SKOV3 cells were quantified at indicated time points. (B) Representative immunofluorescence images of untreated MDA-MB-231 colonies or colonies that survived combined MK-1775 (500 nM) and SU-9516 (1 μM) treatment. Cells were fixed at 14 d after treatment and stained for CD44 (red) and DNA (white). (C) pLKO.puro transduced MDA-MB-231 and SKOV3 cells were treated with MK-1775 (500 nM) for 14 d and stained as in B. Percentages of multinucleated cells were quantified and presented. (D) MDA-MB-231 cells transfected with CDK1-AF or CDK1-WT were treated with MK-1775 (4 μM) and subsequently imaged every 7 min for 62 h. Mitotic exit was analyzed for >15 CFP-positive cells. (E) A model for Wee1 inhibition causing cytotoxicity and genomic instability.
To test whether cytokinesis failure and consequent multinucleation is also observed in cells that survived long-term Wee1 inhibition, MDA-MB-231 cells were cultured for 14 d in the combined presence of Wee1 and Cdk2 inhibitors (Fig. 4B). Boundaries of individual cells within colonies were visualized using CD44 staining to facilitate analysis of nuclear content. Combined inhibition of Wee1 and Cdk2 led to substantial increases in multinucleated cells compared with either untreated or Cdk2-inhibited cells (Fig. 4B and Fig. S6C). Similarly, stable depletion of CDK2, SKP2, or CUL1 did not rescue the Wee1 inhibition-induced cytokinesis defect (Fig. 4C). Thus, we conclude that Wee1 is required for normal mitotic exit, and that the Wee1-inhibitor-induced cytokinesis defect cannot be rescued by CDK2, SKP2, or CUL1 inactivation.
Wee1 Is Required for Cdk1 Inactivation During Mitotic Exit to ensure Proper Karyokinesis/Cytokinesis.
Because cyclin B/Cdk1 represents the major source of CDK activity during mitosis, and Cdk1 is a well-described substrate of Wee1, we tested whether altered levels of cyclin B/Cdk1 activity could underlie the observed cytokinesis defect upon Wee1 inhibition. To this end, cells were synchronized in prometaphase using nocodazole, and isolated by mitotic shake-off. When control-treated cells were replated after nocodazole wash-out, cells exited mitosis within 3 h as judged by the loss of the mitotic marker phospho-Histone H3, which coincided with cyclin B degradation (Fig. S6D). Simultaneously, Cdk1 activity diminished during mitotic exit, as judged by loss of MPM2 reactivity, which detects phosphorylated Cdk1 substrates (Fig. S6D). Inhibition of Wee1 during nocodazole wash-out did not interfere with mitotic exit as judged by loss of phospho-Histone H3, and only marginally delayed cyclin B degradation (Fig. S6D). Remarkably, MPM2 reactivity in Wee1 inhibitor-treated cells showed that Cdk1 remained active up until 5 h after nocodazole wash-out (Fig. S6D). Thus, Wee1 inhibition uncouples Cdk1 inactivation from cyclin B degradation during mitotic exit, and underscores a role for Wee1 in regulating Cdk1 activity beyond mitotic entry. Notably, the observed cytokinesis defect that was observed after Wee1 inhibition could be phenocopied by expression of the CDK1-AF allele, in which the Wee1 phosphorylation site is mutationally inactivated (Fig. 4D). In contrast to control transfected cells, expression of CDK1-AF-CFP resulted in mitotic exit without cytokinesis or karyokinesis, resulting in multinucleated cells (65%, Fig. 4D and Fig. S6E). These data indicate that, under conditions of Wee1 inhibition, Cdk1 activity is sustained which leads to aberrant cytokinesis and consequent polyploidy.
Discussion
Through unbiased genetic screening, we identified mutations in G1/S regulatory genes that determine Wee1 inhibitor sensitivity. Consistent with these findings, inactivation of these G1/S regulatory components rescued the accumulation of DNA damage and abrogation of G2 phase that is induced by Wee1 inhibition. In addition, we identified an additional function of Wee1: controlling chromosome segregation and cytokinesis. Notably, the aberrant cytokinesis following Wee1 inhibition did not compromise cell viability as such and may lead to severe genomic instability in cancer cells that survive therapeutic Wee1 inhibition.
For many years the mechanism underpinning Wee1 inhibitor-induced cytotoxicity was attributed to abrogating the G2/M cell cycle checkpoint. Specifically, loss of the G2/M checkpoint would force premature mitotic entry, leading to mitotic catastrophe. This model is in line with Wee1 inhibitors being preferentially effective in cancer cells lacking a G1/S checkpoint due to TP53 mutations (3, 32–34). For this reason, we expected to find gene mutations that would restore the G2/M checkpoint or delay mitotic entry. However, the identified mutations were enriched for genes that control the G1/S-phase transition, including CUL1, SKP2, and CDK2 (Fig. 1B) and did not show mutations in established G2/M regulators. The finding that inactivation of S-phase-promoting genes rescued Wee1 inhibition was supported by our ensuing findings that DNA damage caused by Wee1 inhibition occurred during S phase, and that cytotoxicity required cells to progress through S phase (Fig. 2 A and B). In line with our data, a previous study showed that down-regulation of Cdk2, but not Cdk1, rescued the accumulation of γ-H2AX in Wee1-depleted U2OS osteosarcoma cells (35). Mechanistically, elevated Cdk2 activity upon Wee1 inhibition appears to induce S-phase-related defects, including aberrant origin firing, nucleotide depletion and Mus81-dependent cleavage of stalled replication forks, with γ-H2AX formation as result (35, 36). Additionally, Wee1 inhibition was shown to down-regulate ATR and Chk1 in a CDK-dependent fashion, which may contribute to the accumulation of γ-H2AX (37). Our data additionally showed that the induction of γ-H2AX in S phase is required for Wee1 inhibitor-induced cytotoxicity, and can be reversed by Cdk2 inhibition, likely by lengthening G2 phase and thereby providing time for repair (Fig. 2 A–C and Figs. S5 C–F and S7 A–D).
Besides being required during S phase, we found that Wee1 is necessary during mitotic exit. Specifically, our data showed that Wee1 inhibition or mutation of the Wee1 phosphorylation site in Cdk1 sustained the activity of Cdk1 during mitotic exit, and resulted in karyokinesis and cytokinesis defects (Fig. 4 and Fig. S6). As siRNA-mediated Wee1 depletion induced a similarly pronounced cytokinesis defect, our observations are unlikely to be explained by off-target effects of MK-1775 (Fig. S6B). The observed requirement for Wee1 during mitotic exit is intriguing, as Wee1 was previously described to limit Cdk1 activity to prevent mitotic entry, rather than to control Cdk1 activity during mitotic progression. Specifically, upon mitotic entry, Cdk1 in conjunction with Plk1 and CK2, inactivate Wee1 through phosphorylation and promote its proteasomal degradation, which would argue against a role for Wee1 in Cdk1 regulation after mitotic entry (38). Nevertheless, Tyr-15 phosphorylation on Cdk1 was observed early after mitotic exit, indicative of Wee1 reactivation during mitotic exit (39), although this was only described to form a back-up mechanism during mitotic exit (40). Because Cdk1 phosphorylates (and thereby inhibits) multiple cytokinesis components including Separase, MKlp2, and Ect2, it is very likely that sustained Cdk1 activity may underlie the defective cytokinesis that was observed after Wee1 inhibition (41–43) (Fig. 4). Multinucleation upon Wee1 inhibition was previously noted, although it was suggested that these effects might have resulted from S-phase defects (25, 44). However, our data show that the aberrant mitotic exit was not caused indirectly by defective S-phase progression, because addition of Wee1 inhibitor during release from a nocodazole-induced mitotic arrest showed near-complete cytokinesis failure (Fig. S5B). Furthermore, our results are in line with yeast studies, in which Wee1 has a function beyond mitotic entry. Experiments with S. pombe showed that Wee1 regulation is part of the septation initiation network (SIN) during mitotic exit (45). In addition, the S. cervisiae Wee1 ortholog Swe1 constitutes an anaphase checkpoint, which controls proper activation of the APC/C to allow mitotic exit (46).
Our data support the notion that Wee1 performs multiple tasks, and that only certain subsets account for the cytotoxicity that is induced by Wee1 inhibitors. Although Wee1 is known to be required for proper G2/M checkpoint functioning, our results indicate that the cytotoxicity upon Wee1 inhibition is mediated primarily in S phase by regulating the Cdk2 signaling axis. Additionally, our data show that Wee1 is required for proper mitotic exit to prevent genomic instability, in a Cdk1-dependent fashion (Fig. 4E).
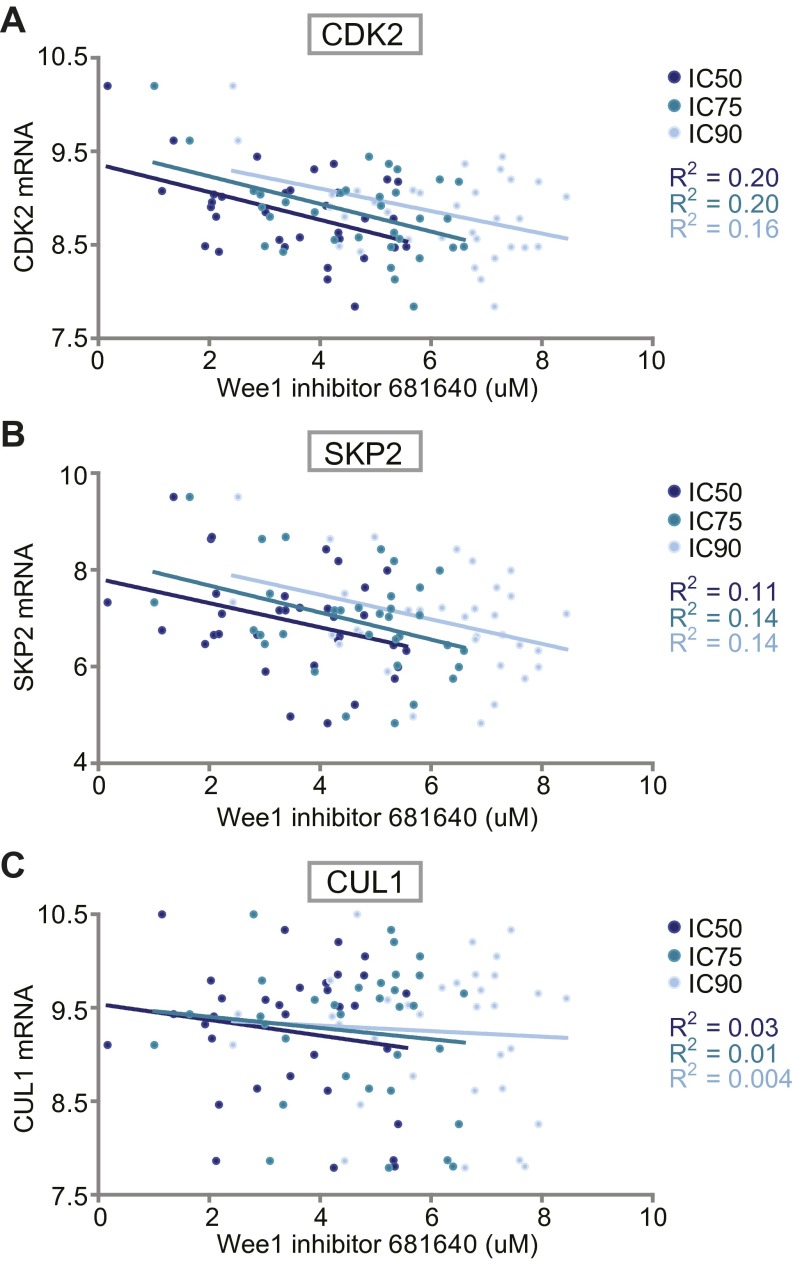
This model has two important implications for the use of Wee1 inhibitors in cancer treatment. Firstly, the involvement of Wee1 in S phase explains why gene mutations in S-phase regulatory genes provide a resistance mechanism for Wee1 inhibitors. Conversely, these data may explain why not all TP53-mutant cancers appear to be sensitive to Wee1 inhibition (21). Indeed, expression levels of the identified S-phase regulators are associated to varying degree with sensitivity to Wee1 inhibition in TP53 mutant cancer cell lines (Fig. S8 A–C) (47, 48). Hence, the activation status of S-phase regulators may be useful as selection criteria for Wee1 inhibitor eligible patients. Previously, the activation status of CDKs was implemented to predict chemotherapeutic responses in breast cancers (49). In these studies, a profiling-risk score based on Cdk1 and Cdk2 showed that high CDK activity was associated with high pathological complete response rates. In the context of Wee1 inhibition, Cdk2 activity could be measured on tumor biopsies before treatment with Wee1 inhibitors. Our findings also implicate that caution is required when Wee1 inhibitors are combined with other molecularly targeted agents, such as the recently developed Cdk4/6 inhibitors, which may nullify the cytotoxic effects of Wee1 inhibition. Secondly, if cells survive the cytotoxic effect of Wee1 inhibition due to inactivated S-phase regulators, inhibition of Wee1 entails the risk of inducing multinucleation. Previous research has shown that spontaneous or chemically-induced tetraploidization increases tumorigenic potential (50, 51). For this reason, cancer cells with unusually low expression or activity of S-phase regulators, such as Cdk2, are not suited for treatment with Wee1 inhibitors because of the risk of tumor cells becoming more aggressive.
Fig. S8.
Association between Wee1 inhibitor sensitivity and mRNA expression of CDK2, SKP2, and CUL1. mRNA expression levels and Wee1 inhibitor sensitivity data of 33 breast and ovarian cancer cell lines was retrieved from publicly available datasets (see SI Materials and Methods and Dataset S3). (A) CDK2 mRNA expression values and corresponding IC50, IC75 and IC90 values for Wee1 inhibitor 681640 values are plotted. R2 values define the goodness-of-fit of a linear regression. (B and C) Linear regression analysis as performed in A with SKP2 or CUL1 mRNA levels, respectively.
Materials and Methods
Gene-Trap Mutagenesis.
KBM-7 cells were mutagenized as described (27), and treated with 300 nM MK-1775. Insertion sites were mapped to the human genome (hg18), and total numbers as well as sense orientation insertions per individual gene were calculated (Dataset S1). Genes with 15 or more gene trap insertions of which more than 70% were inactivating were selected as hits (Dataset S2). See SI Materials and Methods for details on insertion site analysis.
mCherry Competition Assay.
Proliferative advantages of shRNA-harboring cells were measured by analyzing changes in the fraction of cells positive for IRES-driven mCherry. See SI Materials and Methods for details on treatment and flow cytometric analysis.
Additional experimental details are provided in SI Materials and Methods.
SI Materials and Methos
Cell Lines.
Human near-haploid KBM-7 cells were cultured in Iscove's Modified Dulbecco's Medium (IMDM). MDA-MB-231 breast cancer cells, SKOV3 ovarian cancer cells, and HEK293T human embryonic kidney cells were cultured in Dulbecco's Modified Eagle's Medium (DMEM). Growth media for each line were supplemented with 10% (vol/vol) FCS and penicillin/streptomycin (100 units/mL). All cell lines were cultured at 37 °C in a humidified incubator supplied with 5% CO2. When indicated, cells were treated with nocodazole (Sigma Aldrich), MK-1775 (Axon Medchem), PD-0166285 (kindly provided from Pfizer), SU-9516 (Sigma Aldrich) or thymidine (Sigma Aldrich). All chemicals were dissolved in DMSO, except for thymidine, which was dissolved in water.
Primary mouse embryonic fibroblasts (MEF) presenting the Tp53−/− genotype jointly or not with the Cdk2−/− genotype were isolated from E13.5 mouse embryos as described (29). Briefly, the head and the visceral organs were removed, the embryonic tissue was chopped into fine pieces by a razor blade, trypsinized 15 min at 37 °C, and finally tissue and cell clumps were dissociated by pipetting. Cells were plated in a 10-cm culture dish (passage 0) and grown in DMEM, supplemented with 10% (vol/vol) FCS and 1% (vol/vol) penicillin/streptomycin. Primary MEFs were cultured in a humidified incubator with 5% CO2. To transform MEFs, cells were retrovirally transduced with pBABE-puro Ras-V12G and were selected with 2 µg/mL of puromycin.
Viral Infection.
KBM-7, MDA-MB-231 and SKOV3 cells were transduced with pLKO.1 vectors, which either carried an IRES mCherry cassette (pLKO.1-mCherry) or a puromycin resistance cassette (pLKO.1-puro). Both pLKO.1 vectors were a kind gift from J. J. Schuringa, University Medical Center Groningen, Groningen, The Netherlands, and were described previously (28). Short hairpin RNAs (shRNAs) against SCR, CDK2, SKP2, or CUL1 were cloned into pLKO.1 vectors using the Age1 and EcoR1 restriction sites. The hairpin targeting sequences that were used are: CDK2 #1, 5′-GCCCTCTGAACTTGCCTTAAA-3′; CDK2 #2, 5′-AAGAGCTATCTGTTCCAG-3;’ SKP2 #1, 5′-GCCTAAGCTAAATCGAGAGAA-3′; SKP2 #2, 5′- GATAGTGTCATGCTAAAGAAT-3′; CUL1 #1, 5′-GCCAGCATGATCTCCAAGTTA-3′; CUL1 #2 5′-CCCGCAGCAAATAGTTCATGT-3′; WEE1 5′- TTCTCATGTAGTTCGATATTT-3′ and SCR 5′-CAACAAGATGAAGAGCACCAA-3′. Lentiviral particles were produced as described (28). In brief, HEK293T packaging cells were transfected with 4 µg plasmid DNA in combination with the packaging plasmids VSV-G and ΔYPR. Virus-containing supernatant was harvested at 48 and 72 h after transfection and filtered through a 0.45-μM syringe filter, and used to infect target cells in three consecutive 12-h periods.
To generate FUCCI-MDA-MB-231 and FUCCI-SKOV3 cells, MDA-MB-231 and SKOV3 cells were simultaneously infected with the FUCCI cell cycle reporter constructs pCSII-mVenus-hGeminin (1–110) and pCSII-EF-mCherry-hCdt1 (30–120). The FUCCI plasmids were a kind gift of A. Miyawaki, RIKEN, Wako, Japan, and were described previously (30). To generate lentiviral particles, HEK293T packaging cells were transfected with 2 μg DNA of each FUCCI reporter in combination with packaging plasmids ΔYPR and VSV-G. Virus-containing supernatant was harvested at 48 h after transfection. After one round of infection, MDA-MB-231 and SKOV3 cells were sorted into monoclonal FUCCI cell lines using a Moflo cell sorter.
Transient Transfection.
MDA-MB-231 cells were seeded into eight-chambered cover glass plates (Lab-Tek-II, Nunc) and were transfected 12 h later with 0.25 μg of CDK1-AF-CFP or CDK1-WT-CFP by using the Fugene 6 reagent (Promega). At 24 h after transfection, cells were treated with MK-1775 (4 μM) and imaged for 62 h.
Gene-Trap Mutagenesis and Mapping of Insertion Sites.
KBM-7 cells were mutagenized as described (27). In summary, ∼60 × 10E7 KBM-7 cells were retrovirally infected with the gene-trap vector pGT, containing a strong splice acceptor. A ∼75% infection rate was achieved based on GFP positivity. Mutagenized cells were treated with 300 nM of the Wee1 inhibitor MK-1775 and plated at ∼80,000 cells per well in 96-well plates. Surviving colonies at 14 d after MK-1775 treatment were pooled before genomic DNA isolation. Genomic DNA flanking gene-trap proviral DNA was sequenced to identify the insertion sites as described (27). In summary, genomic DNA was isolated from ∼40 million cells, digested using NlaIII and MseI, and subjected to a Linear Amplification (LAM)-PCR protocol followed by sequencing using the Genome Analyzer platform (Illumina). Reads were aligned to the human genome (hg18), and the number of insertions in sense orientation, which are inactivating mutations, per individual gene was calculated as well as the total number of insertions (Dataset S1). Genes with 15 or more gene trap insertions of which more than 70% were inactivating were selected as hits (Dataset S2).
Long-Term mCherry Competition Assay.
Proliferative advantages of shRNA-harboring cells were measured by analyzing changes in the fraction of cells positive for IRES-driven mCherry. To this end, cells were trypsinized and resuspended every 3 or 4 d. At those time points, ∼25% of the culture volume was used to measure the percentage of mCherry-positive cells by flow cytometry, and the remaining cells were replated for later time points. As indicated, cells were treated with MK-1775 (150 nM for KBM-7 cells and 1 μM for MDA-MB-231 or SKOV3 cells), PD-166285 (2.5 nM), or DMSO as a control. In case of shRNA-mediated Wee1 inactivation, cells were infected with pLKO.puro-shWEE1 or shSCR. At least 30,000 events were analyzed per sample on a LSR-II (Becton Dickinson) using FACSDiva software (Becton Dickinson).
Live Cell Microscopy.
FUCCI-MDA-MB-231, FUCCI-SKOV3, CDK1-AF-MDA-MB-231, and CDK1-WT-MDA-MB-231 cells were seeded in eight-chambered cover glass plates (Lab-Tek-II, Nunc). Directly before imaging, cells were treated with 4 μM MK-1775 and/or 1 μM Cdk2 inhibitor SU-9516. RFP, GFP, and DIC, or CFP and DIC images were obtained every 7 min for FUCCI and CDK1-AF/WT-cells, respectively, over a period of 62 h on a DeltaVision Elite microscope, equipped with a CoolSNAP HQ2 camera and a 20× immersion objective (U-APO 340, numerical aperture: 1.35). In the Z-plane, six images were acquired at 0.5-μm interval. Image analysis was done using SoftWorX software (Applied Precision/GE Healthcare).
MTT Assays.
KBM-7, MDA-MB-231, or SKOV3 cells were plated in 96-well plates at 10,000, 3,500, or 3,000 cells per well, respectively, and treated with indicated concentrations of MK-1775. After 72 h of treatment, methyl thiazol tetrazolium (MTT) was added to a final concentration of 0.5 mg/mL and cells were incubated for four additional hours. Cells were then dissolved in DMSO and the produced formazan was measured at 520 nm with a Bio-Rad iMark spectrometer.
Protein Lysate Preparation and Immunoblotting.
Knockdown efficiencies and the biochemical responses to MK-1775 treatment were analyzed by Western blotting. Cells were lysed in Mammalian Protein Extraction Reagent (MPER, Thermo Scientific), supplemented with protease inhibitor and phosphatases inhibitor mixture (Thermo Scientific). Forty micrograms of protein extract was used for separation by SDS/PAGE. Separated proteins were transferred to Polyvinylidene fluoride (PVDF) membranes and blocked in 5% (wt/vol) BSA in Tris-buffered saline (TBS), with 0.05% Tween20. Immunodetection was done with antibodies directed against rabbit anti-phospho-Y15-Cdk1 (Abcam, ab133463), rabbit anti-phospho-Y15-Cdk2 (Abcam, ab76146), rabbit anti-phospho-S780-Rb (Cell Signaling, 9307), rabbit anti-phopho-Ser139-histone-H2A.X (Cell Signaling, 9718), rabbit anti-cleaved-PARP (Cell Signaling, 9541), goat anti-Cdk2 (Santa Cruz, sc-163), mouse anti-Skp2 (Santa Cruz, sc-74477), rabbit anti-Cul1 (Santa Cruz, sc-17775), rabbit anti-cyclin B (Santa Cruz, sc-752), mouse anti-MPM2 (Millipore, 05–368), mouse anti-phospho-S10-histone H3 (Cell Signaling, 9706) and mouse anti-actin (MP Biomedicals, 69100). Appropriate horseradish peroxidase (HRP)-conjugated secondary antibodies (DAKO) were used and signals were visualized with enhanced chemiluminescence (Lumi-Light, Roche Diagnostics) on a Bio-Rad bioluminescence device, equipped with Quantity One/ChemiDoc XRS software (Bio-Rad).
Long-Term Colony Formation and Survival Assays.
For a long-term colony formation assays, MDA-MB-231 and SKOV3 cells were seeded into six-well plates (1 × 10E3 cells per well) and treated with either 500 nM MK-1775 or DMSO in combination with increasing doses (125–1,000 nM) of the Cdk2 inhibitor SU-9516. After 14 d, cells were fixed in methanol, stained with Coomassie Brilliant Blue and photographed. All assays were performed independently at least three times.
Nontransformed or Ras-V12-transformed MEFs were seeded into six-well plates (5-10 × 10E4 cells/well) and cultured in the absence or presence of MK-1775 (500 nM). After 4 d, cells were fixed, stained with crystal violet, and photographed. For quantification, the crystal violet stain was extracted in 10% (vol/vol) acetic acid and quantified at OD 595 nm. All assays were performed independently at least two times.
Cell Cycle Analysis.
Cells were synchronized at the G1/S transition using a 24-h incubation with 2.5 mM thymidine. Alternatively, cells were synchronized at prometaphase using 250 ng/mL nocodazole. After extensive washing, cells were released and harvested at indicated time points and subsequently fixed in ice-cold 70% ethanol. Cells were stained with rabbit anti-phopho-Ser139-histone-H2A.X (Cell Signaling, 9718) and subsequently stained with Alexa488-conjugated goat anti-rabbit secondary antibody, in combination with propidium iodide/RNase treatment.
To assess G2/M checkpoint function, cells were treated with doxorubicin (1 μM) for 16 h. After 30 min of doxorubicin treatment, nocodazole (250 ng/mL) was added to cultures to trap cells in mitosis. If indicated, cells were treated with MK-1775 (4 μM) at the moment of doxorubicin addition. Cells were fixed in ice-cold ethanol (70%), and stained with MPM2 antibody (Millipore, 05–368) and subsequently stained with Alexa647-conjugated goat anti-mouse secondary antibody, in combination with propidium iodide/RNase treatment. At least 20,000 events were analyzed per sample on a FACSCalibur (Becton Dickinson). FlowJo software was used to analyze data.
Immunofluorescence Microscopy.
MDA-MB-231 and SKOV3 cells were grown on glass coverslips in 6-well plates. If indicated, cells were treated with MK-1775 (500 nM) in the absence or presence of SU-9516 (1 µM). At 14 d after treatment, cells were fixed in 4% (wt/vol) paraformaldehyde in PBS. Subsequently, cells were stained with rat anti-CD44 (BioLegend 103002) combined with Alexa488-conjugated goat anti-rat secondary antibody and counterstained with DAPI. Images were obtained using a Leica DM6000B microscope equipped with a 10× objective (Leica HC PL FLUOTAR 10×/0.30) and LAS-AF software (Leica). In total 100–500 cells were scored per condition. Alternatively, cells were grown on glass coverslips and transfected with 40 nM Wee1 siRNA (#1 WEE1HSS111337 and #2 WEE1HSS111338; Invitrogen) or “medium GC duplex” control siRNA (Life Technologies 12935–300). At 96 h after siRNA transfection, cells were fixed and stained as described above.
Analysis of mRNA Expression in Relation to Wee1 Inhibitor Sensitivity.
Data from the Sanger drug compound screen on cancer cell lines (cancer.sanger.ac.uk/cosmic) was used (47). Specifically, IC50, IC75 and IC90 data for the Wee1 inhibitor with Pubchem identifier (CID: 10384072) was retrieved for breast and ovarian cancer cell lines. Available mRNA expression data for these cell lines were in retrieved from Cancer Cell Line Encyclopedia (CCLE) project (www.broadinstitute.org/ccle) (48). Of 33 breast and ovarian cancer cell lines, both Wee1 inhibitor sensitivity and mRNA expression data were retrieved (Dataset S3). Expression of CDK2, SKP2, and CUL1 and corresponding IC50, IC75, and IC90 values were plotted and linear regression (R2) values were calculated using GraphPad Prism software.
Other Supporting Information Files
Supplementary Material
Acknowledgments
We thank Drs. Schuringa, Ferrell, and Miyawaki for providing reagents and Dr. Brummelkamp for help with genetic screens. We thank colleagues from the Medical Oncology Department and the Brummelkamp laboratory for helpful discussions. M.A.T.M.v.V. was financially supported by the Dutch Cancer Society (RUG 2011-5093), The Netherlands Organization for Scientific Research (NWO-VIDI 916-76062), and an EMBO fellowship (STF 359-2010). A.M.H. was supported by the van Meer-Boerema foundation. The laboratory of P.K. was supported by the Biomedical Research Council of A*STAR, Singapore.
Footnotes
The authors declare no conflict of interest.
This article is a PNAS Direct Submission.
Data deposition: Sequence data have been deposited at the NCBI Sequence Read Archive, www.ncbi.nlm.nih.gov/sra (accession no. SRP065601).
This article contains supporting information online at www.pnas.org/lookup/suppl/doi:10.1073/pnas.1505283112/-/DCSupplemental.
References
- 1.Kawabe T. G2 checkpoint abrogators as anticancer drugs. Mol Cancer Ther. 2004;3(4):513–519. [PubMed] [Google Scholar]
- 2.Reaper PM, et al. Selective killing of ATM- or p53-deficient cancer cells through inhibition of ATR. Nat Chem Biol. 2011;7(7):428–430. doi: 10.1038/nchembio.573. [DOI] [PubMed] [Google Scholar]
- 3.Hirai H, et al. Small-molecule inhibition of Wee1 kinase by MK-1775 selectively sensitizes p53-deficient tumor cells to DNA-damaging agents. Mol Cancer Ther. 2009;8(11):2992–3000. doi: 10.1158/1535-7163.MCT-09-0463. [DOI] [PubMed] [Google Scholar]
- 4.Morgan DO. Cyclin-dependent kinases: Engines, clocks, and microprocessors. Annu Rev Cell Dev Biol. 1997;13(1):261–291. doi: 10.1146/annurev.cellbio.13.1.261. [DOI] [PubMed] [Google Scholar]
- 5.McGowan CH, Russell P. Human Wee1 kinase inhibits cell division by phosphorylating p34cdc2 exclusively on Tyr15. EMBO J. 1993;12(1):75–85. doi: 10.1002/j.1460-2075.1993.tb05633.x. [DOI] [PMC free article] [PubMed] [Google Scholar]
- 6.Parker LL, Piwnica-Worms H. Inactivation of the p34cdc2-cyclin B complex by the human WEE1 tyrosine kinase. Science. 1992;257(5078):1955–1957. doi: 10.1126/science.1384126. [DOI] [PubMed] [Google Scholar]
- 7.Gautier J, Solomon MJ, Booher RN, Bazan JF, Kirschner MW. cdc25 is a specific tyrosine phosphatase that directly activates p34cdc2. Cell. 1991;67(1):197–211. doi: 10.1016/0092-8674(91)90583-k. [DOI] [PubMed] [Google Scholar]
- 8.Strausfeld U, et al. Dephosphorylation and activation of a p34cdc2/cyclin B complex in vitro by human CDC25 protein. Nature. 1991;351(6323):242–245. doi: 10.1038/351242a0. [DOI] [PubMed] [Google Scholar]
- 9.Krek W, Nigg EA. Mutations of p34cdc2 phosphorylation sites induce premature mitotic events in HeLa cells: Evidence for a double block to p34cdc2 kinase activation in vertebrates. EMBO J. 1991;10(11):3331–3341. doi: 10.1002/j.1460-2075.1991.tb04897.x. [DOI] [PMC free article] [PubMed] [Google Scholar]
- 10.Kumagai A, Dunphy WG. The cdc25 protein controls tyrosine dephosphorylation of the cdc2 protein in a cell-free system. Cell. 1991;64(5):903–914. doi: 10.1016/0092-8674(91)90315-p. [DOI] [PubMed] [Google Scholar]
- 11.Matsuoka S, Huang M, Elledge SJ. Linkage of ATM to cell cycle regulation by the Chk2 protein kinase. Science. 1998;282(5395):1893–1897. doi: 10.1126/science.282.5395.1893. [DOI] [PubMed] [Google Scholar]
- 12.Peng CY, et al. Mitotic and G2 checkpoint control: Regulation of 14-3-3 protein binding by phosphorylation of Cdc25C on serine-216. Science. 1997;277(5331):1501–1505. doi: 10.1126/science.277.5331.1501. [DOI] [PubMed] [Google Scholar]
- 13.Sanchez Y, et al. Conservation of the Chk1 checkpoint pathway in mammals: Linkage of DNA damage to Cdk regulation through Cdc25. Science. 1997;277(5331):1497–1501. doi: 10.1126/science.277.5331.1497. [DOI] [PubMed] [Google Scholar]
- 14.Gu Y, Rosenblatt J, Morgan DO. Cell cycle regulation of CDK2 activity by phosphorylation of Thr160 and Tyr15. EMBO J. 1992;11(11):3995–4005. doi: 10.1002/j.1460-2075.1992.tb05493.x. [DOI] [PMC free article] [PubMed] [Google Scholar]
- 15.Hughes BT, Sidorova J, Swanger J, Monnat RJ, Jr, Clurman BE. Essential role for Cdk2 inhibitory phosphorylation during replication stress revealed by a human Cdk2 knockin mutation. Proc Natl Acad Sci USA. 2013;110(22):8954–8959. doi: 10.1073/pnas.1302927110. [DOI] [PMC free article] [PubMed] [Google Scholar]
- 16.Jackson SP, Bartek J. The DNA-damage response in human biology and disease. Nature. 2009;461(7267):1071–1078. doi: 10.1038/nature08467. [DOI] [PMC free article] [PubMed] [Google Scholar]
- 17.Waldman T, Kinzler KW, Vogelstein B. p21 is necessary for the p53-mediated G1 arrest in human cancer cells. Cancer Res. 1995;55(22):5187–5190. [PubMed] [Google Scholar]
- 18.Hirai H, et al. MK-1775, a small molecule Wee1 inhibitor, enhances anti-tumor efficacy of various DNA-damaging agents, including 5-fluorouracil. Cancer Biol Ther. 2010;9(7):514–522. doi: 10.4161/cbt.9.7.11115. [DOI] [PubMed] [Google Scholar]
- 19.Bridges KA, et al. MK-1775, a novel Wee1 kinase inhibitor, radiosensitizes p53-defective human tumor cells. Clin Cancer Res. 2011;17(17):5638–5648. doi: 10.1158/1078-0432.CCR-11-0650. [DOI] [PMC free article] [PubMed] [Google Scholar]
- 20.Do K, Doroshow JH, Kummar S. Wee1 kinase as a target for cancer therapy. Cell Cycle. 2013;12(19):3159–3164. doi: 10.4161/cc.26062. [DOI] [PMC free article] [PubMed] [Google Scholar]
- 21.Rajeshkumar NV, et al. MK-1775, a potent Wee1 inhibitor, synergizes with gemcitabine to achieve tumor regressions, selectively in p53-deficient pancreatic cancer xenografts. Clin Cancer Res. 2011;17(9):2799–2806. doi: 10.1158/1078-0432.CCR-10-2580. [DOI] [PMC free article] [PubMed] [Google Scholar]
- 22.Guertin AD, et al. Preclinical evaluation of the WEE1 inhibitor MK-1775 as single-agent anticancer therapy. Mol Cancer Ther. 2013;12(8):1442–1452. doi: 10.1158/1535-7163.MCT-13-0025. [DOI] [PubMed] [Google Scholar]
- 23.Castedo M, et al. Cell death by mitotic catastrophe: A molecular definition. Oncogene. 2004;23(16):2825–2837. doi: 10.1038/sj.onc.1207528. [DOI] [PubMed] [Google Scholar]
- 24.De Witt Hamer PC, Mir SE, Noske D, Van Noorden CJF, Würdinger T. WEE1 kinase targeting combined with DNA-damaging cancer therapy catalyzes mitotic catastrophe. Clin Cancer Res. 2011;17(13):4200–4207. doi: 10.1158/1078-0432.CCR-10-2537. [DOI] [PubMed] [Google Scholar]
- 25.Kreahling JM, et al. MK1775, a selective Wee1 inhibitor, shows single-agent antitumor activity against sarcoma cells. Mol Cancer Ther. 2012;11(1):174–182. doi: 10.1158/1535-7163.MCT-11-0529. [DOI] [PMC free article] [PubMed] [Google Scholar]
- 26.Kotecki M, Reddy PS, Cochran BH. Isolation and characterization of a near-haploid human cell line. Exp Cell Res. 1999;252(2):273–280. doi: 10.1006/excr.1999.4656. [DOI] [PubMed] [Google Scholar]
- 27.Carette JE, et al. Global gene disruption in human cells to assign genes to phenotypes by deep sequencing. Nat Biotechnol. 2011;29(6):542–546. doi: 10.1038/nbt.1857. [DOI] [PMC free article] [PubMed] [Google Scholar]
- 28.van den Boom V, et al. Nonredundant and locus-specific gene repression functions of PRC1 paralog family members in human hematopoietic stem/progenitor cells. Blood. 2013;121(13):2452–2461. doi: 10.1182/blood-2012-08-451666. [DOI] [PubMed] [Google Scholar]
- 29.Padmakumar VC, Aleem E, Berthet C, Hilton MB, Kaldis P. Cdk2 and Cdk4 activities are dispensable for tumorigenesis caused by the loss of p53. Mol Cell Biol. 2009;29(10):2582–2593. doi: 10.1128/MCB.00952-08. [DOI] [PMC free article] [PubMed] [Google Scholar]
- 30.Sakaue-Sawano A, et al. Visualizing spatiotemporal dynamics of multicellular cell-cycle progression. Cell. 2008;132(3):487–498. doi: 10.1016/j.cell.2007.12.033. [DOI] [PubMed] [Google Scholar]
- 31.Satyanarayana A, Hilton MB, Kaldis P. p21 Inhibits Cdk1 in the absence of Cdk2 to maintain the G1/S phase DNA damage checkpoint. Mol Biol Cell. 2008;19(1):65–77. doi: 10.1091/mbc.E07-06-0525. [DOI] [PMC free article] [PubMed] [Google Scholar]
- 32.Krajewska M, et al. Forced activation of Cdk1 via wee1 inhibition impairs homologous recombination. Oncogene. 2013;32(24):3001–3008. doi: 10.1038/onc.2012.296. [DOI] [PubMed] [Google Scholar]
- 33.Pappano WN, Zhang Q, Tucker LA, Tse C, Wang J. Genetic inhibition of the atypical kinase Wee1 selectively drives apoptosis of p53 inactive tumor cells. BMC Cancer. 2014;14(1):430. doi: 10.1186/1471-2407-14-430. [DOI] [PMC free article] [PubMed] [Google Scholar]
- 34.Bauman JE, Chung CH. CHK it out! Blocking WEE kinase routs TP53 mutant cancer. Clin Cancer Res. 2014;20(16):4173–4175. doi: 10.1158/1078-0432.CCR-14-0720. [DOI] [PMC free article] [PubMed] [Google Scholar]
- 35.Domínguez-Kelly R, et al. Wee1 controls genomic stability during replication by regulating the Mus81-Eme1 endonuclease. J Cell Biol. 2011;194(4):567–579. doi: 10.1083/jcb.201101047. [DOI] [PMC free article] [PubMed] [Google Scholar]
- 36.Beck H, et al. Cyclin-dependent kinase suppression by WEE1 kinase protects the genome through control of replication initiation and nucleotide consumption. Mol Cell Biol. 2012;32(20):4226–4236. doi: 10.1128/MCB.00412-12. [DOI] [PMC free article] [PubMed] [Google Scholar]
- 37.Saini P, Li Y, Dobbelstein M. Wee1 is required to sustain ATR/Chk1 signaling upon replicative stress. Oncotarget. 2015;6(15):13072–13087. doi: 10.18632/oncotarget.3865. [DOI] [PMC free article] [PubMed] [Google Scholar]
- 38.Watanabe N, et al. M-phase kinases induce phospho-dependent ubiquitination of somatic Wee1 by SCFbeta-TrCP. Proc Natl Acad Sci USA. 2004;101(13):4419–4424. doi: 10.1073/pnas.0307700101. [DOI] [PMC free article] [PubMed] [Google Scholar]
- 39.Potapova TA, Daum JR, Byrd KS, Gorbsky GJ. Fine tuning the cell cycle: Activation of the Cdk1 inhibitory phosphorylation pathway during mitotic exit. Mol Biol Cell. 2009;20(6):1737–1748. doi: 10.1091/mbc.E08-07-0771. [DOI] [PMC free article] [PubMed] [Google Scholar]
- 40.Chow JPH, Poon RYC, Ma HT. Inhibitory phosphorylation of cyclin-dependent kinase 1 as a compensatory mechanism for mitosis exit. Mol Cell Biol. 2011;31(7):1478–1491. doi: 10.1128/MCB.00891-10. [DOI] [PMC free article] [PubMed] [Google Scholar]
- 41.Gorr IH, Boos D, Stemmann O. Mutual inhibition of separase and Cdk1 by two-step complex formation. Mol Cell. 2005;19(1):135–141. doi: 10.1016/j.molcel.2005.05.022. [DOI] [PubMed] [Google Scholar]
- 42.Hümmer S, Mayer TU. Cdk1 negatively regulates midzone localization of the mitotic kinesin Mklp2 and the chromosomal passenger complex. Curr Biol. 2009;19(7):607–612. doi: 10.1016/j.cub.2009.02.046. [DOI] [PubMed] [Google Scholar]
- 43.Niiya F, Xie X, Lee KS, Inoue H, Miki T. Inhibition of cyclin-dependent kinase 1 induces cytokinesis without chromosome segregation in an ECT2 and MgcRacGAP-dependent manner. J Biol Chem. 2005;280(43):36502–36509. doi: 10.1074/jbc.M508007200. [DOI] [PubMed] [Google Scholar]
- 44.Aarts M, et al. Forced mitotic entry of S-phase cells as a therapeutic strategy induced by inhibition of WEE1. Cancer Discov. 2012;2(6):524–539. doi: 10.1158/2159-8290.CD-11-0320. [DOI] [PubMed] [Google Scholar]
- 45.Yu Z-Y, et al. Fission yeast nucleolar protein Dnt1 regulates G2/M transition and cytokinesis by downregulating Wee1 kinase. J Cell Sci. 2013;126(Pt 21):4995–5004. doi: 10.1242/jcs.132845. [DOI] [PMC free article] [PubMed] [Google Scholar]
- 46.Lianga N, et al. A Wee1 checkpoint inhibits anaphase onset. J Cell Biol. 2013;201(6):843–862. doi: 10.1083/jcb.201212038. [DOI] [PMC free article] [PubMed] [Google Scholar]
- 47.Forbes SA, et al. COSMIC: Exploring the world’s knowledge of somatic mutations in human cancer. Nucleic Acids Res. 2015;43(Database issue):D805–D811. doi: 10.1093/nar/gku1075. [DOI] [PMC free article] [PubMed] [Google Scholar]
- 48.Barretina J, et al. The Cancer Cell Line Encyclopedia enables predictive modelling of anticancer drug sensitivity. Nature. 2012;483(7391):603–607. doi: 10.1038/nature11003. [DOI] [PMC free article] [PubMed] [Google Scholar]
- 49.Kim SJ, et al. Recurrence risk score based on the specific activity of CDK1 and CDK2 predicts response to neoadjuvant paclitaxel followed by 5-fluorouracil, epirubicin and cyclophosphamide in breast cancers. Ann Oncol. 2012;23(4):891–897. doi: 10.1093/annonc/mdr340. [DOI] [PubMed] [Google Scholar]
- 50.Shi Q, King RW. Chromosome nondisjunction yields tetraploid rather than aneuploid cells in human cell lines. Nature. 2005;437(7061):1038–1042. doi: 10.1038/nature03958. [DOI] [PubMed] [Google Scholar]
- 51.Fujiwara T, et al. Cytokinesis failure generating tetraploids promotes tumorigenesis in p53-null cells. Nature. 2005;437(7061):1043–1047. doi: 10.1038/nature04217. [DOI] [PubMed] [Google Scholar]
Associated Data
This section collects any data citations, data availability statements, or supplementary materials included in this article.


