

Abstract
Proanthocyanidins (PAs) in sainfoin (Onobrychis viciifolia Scop.) are of interest to ameliorate the sustainability of livestock production. However, sainfoin forage yield and PA concentrations, as well as their composition, require optimization. Individual plants of 27 sainfoin accessions from four continents were analyzed with LC-ESI-QqQ-MS/MS for PA concentrations and simple phenolic compounds. Large variability existed in PA concentrations (23.0–47.5 mg g–1 leaf dry matter (DM)), share of prodelphinidins (79–96%), and mean degree of polymerization (11–14) among, but also within, accessions. PAs were mainly located in leaves (26.8 mg g–1 DM), whereas stems had less PAs (7.8 mg g–1 DM). Overall, high-yielding plants had lower PA leaf concentrations (R2 = 0.16, P < 0.001) and fewer leaves (R2 = 0.66, P < 0.001). However, the results show that these two trade-offs between yield and bioactive PAs can be overcome.
Keywords: condensed tannins, LC-ESI-QqQ-MS/MS, yield, breeding, polyphenols
Introduction
Sainfoin (Onobrychis viciifolia Scop.) is a traditional forage legume that was an important forage source as early as the mid-16th century.1 Although it was a very important forage crop for a long time, it lost importance in the second half of the 20th century, due to other forages exhibiting higher yields and better tolerance toward frequent cutting.2 Nowadays, as livestock farming has attracted public debate, due to, among other reasons: (i) contributions to climate change, both directly (greenhouse gas emissions) and indirectly (deforestation) and (ii) sources of nutrient pollution for water bodies, resulting from both feed and livestock production, sainfoin has benefited from a renewed interest (www.legumeplus.eu).3 Because of various beneficial properties, mostly linked to the presence of proanthocyanidins (PAs) (syn. condensed tannins) and the ability to fix nitrogen directly from the air (reviewed in refs (4 and 5)), sainfoin is potentially considered a partial solution. The beneficial properties include an ability to grow on marginal soils without mineral nitrogen fertilizer, thus reducing environmental pollution and competition with food production; lower nitrous oxide emissions due to a shift of the nitrogen excretion pathway from urine to a more stable form in feces; and some indications that PAs may have the potential to reduce methane emissions. Additional benefits include lower burdens of parasitic gastrointestinal nematodes and bloat prevention, thereby increasing animal health and welfare.6,7 Furthermore, sainfoin has a good forage quality with higher crude protein and total sugar contents than birdsfoot trefoil (Lotus corniculatus) and chicory (Cichorium intybus).8
Individual PA compounds in a plant can be constructed of either procyanidin (PC) or prodelphinidin (PD) subunits, but it is quite common to find oligomeric (2–10 subunits) and polymeric PAs (>10 subunits) that contain both PC and PD units. In addition, individual plants synthesize a mixture of tens to hundreds of different oligomers and polymers. Among these types of PC/PD mixtures of oligo- and polymers, PD-rich PAs have generally shown higher antiparasitic activity than PC-rich PAs,9,10 and PAs rich in polymers have been shown to improve antiparasitic effects and the potential for reducing methane emission.11 This may be related to the fact that PAs with higher molecular weights (i.e., polymer size) are better able to interact with macromolecules,12,13 although this may not be the sole factor. However, higher PC share, on the other hand, seems to enhance protein protection, which is important for ruminant nutrition and also for sustainable livestock production. The exact reasons for this remain unclear, but PDs are expected to have a higher protein binding affinity than PCs based on their ability to form more hydrogen bonds. This would make tannin–protein complexes consisting of PD-rich tannins more difficult to dissociate in the digestive tract and thus lead to higher fecal nitrogen losses in ruminants.7 Therefore, farmers will need sainfoin varieties with a PA composition that is optimized for both animal health and nutrition and with sufficient concentrations of these optimized PAs.9,10 Interestingly, anthelmintic properties may also be enhanced by monomeric flavonoids,14,15 which are very common in many plants. As recent findings have determined that the average composition of PAs is, at least in part, heritable,16,17 the major remaining obstacle is the variability in PA concentration, which is required for optimization. However, until recently, screening of large numbers of individual plants simultaneously for PA concentrations and their composition was not feasible, which prohibited detailed characterization of this variability. Hence, with the exception of one accession, the differences in PA concentrations among individual plants have never been established.18 The previous limitations have since been overcome by a new method for UPLC-MS/MS analysis of extractable PAs, which allows high-throughput rates for the measurement of PA composition, such as the mean degree of polymerization (mDP) and PC/PD ratios, allowing for large screenings of individual plants for their PA concentration and composition.19
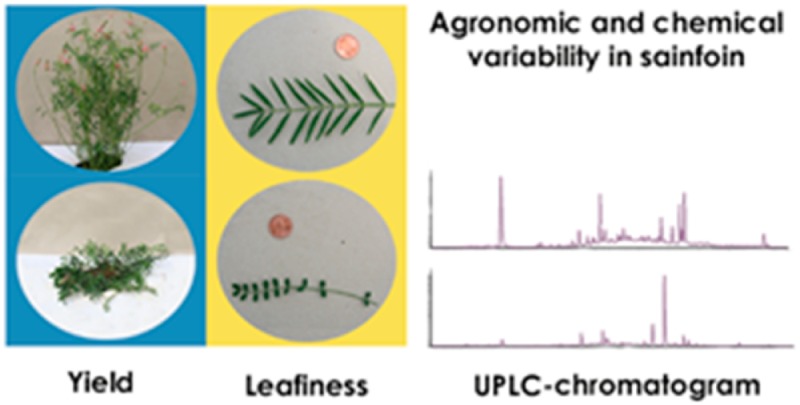
As PA-based bioactivity of sainfoin is of interest for increasing the sustainability of livestock production systems, we evaluated the existing variability of PA properties (PA concentration and composition) and of agronomic properties (yield and leaf share) in sainfoin. Special emphasis was placed (i) on variability in PA properties at different levels, such as among accessions, among individual plants within accessions, and among plant organs within individual plants and (ii) on the correlation between the PA properties of a plant and its yield. Our findings will be of substantial value for the optimization of sainfoin as a bioactive forage, by establishing that the required variability in PA concentration and composition is available and that the concomitant improvement of yields and PA properties in sainfoin is possible.
Materials and Methods
Chemicals and Reagents
Technical grade acetone for extraction was purchased from VWR (Haasrode, Belgium). Formic acid (HCOOH) and LC-MS Chromasolv acetonitrile for the UHPLC-ESI-QqQ-MS were obtained from Sigma-Aldrich (Seelze, Germany), and catechin for the catechin stock solution was acquired from Sigma-Aldrich (St. Louis, MO, USA). Kaempferol-3-O-rutinoside, myricitrin, caffeoylquinic acid, arbutin, and quercetin-O-rutinoside for the calibration curves, as well as kaempferol-7-O-glucoside, kaempferol-7-O-neohesperoside, kaempferol-3-O-glucoside, hyperoside, and quercetin glucopyranoside for the stock solutions were obtained from Extrasynthese (Genay, France). Digalloylglucose (98% purity, as determined by UPLC-DAD) for the calibration of galloylated compounds was purified by J.-P. Salminen (University of Turku, Turku, Finland) from a Betula pubescens leaf extract by a combination of Sephadex LH-20 gel chromatography and semipreparative HPLC. Water was purified with a Millipore Synergy water purification system from Merck KGaA (Darmstadt, Germany). Sephadex LH-20 was obtained from GE Healthcare (Uppsala, Sweden).
Site Description
Plant material was harvested from a field experiment in Rümlang (47°44′ N 8°53′ E, 482 m asl), near Zurich, Switzerland. The soil is a calcic cambisol of at least 0.75 m depth and ranges from loam to clay loam. The volume of the soil skeleton was measured at 5–10%, and the pH was 7.1. Except where otherwise noted, all data were generated under the following environmental conditions: cumulative precipitation from the sowing of the experiment (June 1) to the harvest of the samples (September 24) was 559 mm (annual cumulative precipitation = 1165 mm) at the Agroscope research station, which is 1 km from the field site (shortest, direct route). The average temperature over the same time frame was 17.7 °C (average annual temperature = 9.8 °C).
Experimental Design
In a common garden experiment, seeds of 27 sainfoin accessions (Table S1) were sown in 8 replicates in a randomized complete block design. We aimed to cover a large range of variability, and thus the accessions were selected according to their status of cultivation, covering a range from wild accessions to fully registered cultivars, as well as according to their geographic origin, covering 12 different countries from 4 different continents. Each accession was sown in a row with 0.5 m distance between accessions, and of germinated seedlings, healthy individuals that were 0.25 m apart from each other (within rows) were selected for further examination, and all others were removed. Each row consisted of 13 plants, from which 9 were experimental plants: the 2 plants on each end were eliminated to decrease margin effects. The design, thus, added up to a total of 1944 experimental plants (27 accessions × 8 replicates (i.e., blocks) × 9 individuals), with a subset of the 9 individuals per block and accession being used for the various analyses described below.
Sampling
For the chemical analysis, from each of the 27 accessions, at least 12 plants were selected according to size (large, medium, and small size, from a subset of 4 blocks), to determine the possible trade-off between plant size and PA concentration and to cover the whole range of variability within and among the accessions. Altogether, polyphenol extracts from a subset of 364 individual plants from all accessions was analyzed by UPLC-ESI-QqQ-MS/MS. Per plant, five whole leaves (leaflets including petiole and rachis) of a comparative developmental stage (intermediate age) were taken from each plant. Additionally, young (freshly unfolded) and old leaves (Figure S1), as well as stems, were harvested simultaneously from a subset of seven accessions to study the variability of PA among plant organs. Sampling was conducted in the morning of a cool, cloudy autumn day to prevent evapotranspiration and biological degradation. Immediately after sampling, samples were cooled on dry ice and within an hour stored in a −70 °C freezer. Prior to grinding and extraction, samples were taken out of the freezer, immediately dipped in liquid nitrogen, and loaded into a precooled Freeze-Drying Plant Sublimator 3x4x5 (ZIRBUS Technology GmbH, Bad Grund, Germany) for lyophilization.
For agronomical measurements, all 1944 experimental plants, including the subset used for chemical analysis, were oven-dried at 40 °C, with high air-throughput rates, to constant weight. In addition to dry matter, the leaf ratio (leaf dry mass to plant total dry mass) was determined for 545 plants, which included 102 large and medium plants used for chemical analysis.
Extraction and Sample Preparation
After freeze-drying, chemical samples were ground using an MM 400 ball mill (Retsch Technology GmbH, Haan, Germany) in 25 mL tungsten carbide containers with four tungsten carbide balls (7 mm diameter). Plant material (20 mg) was weighed into 2 mL Eppendorf tubes and stored at −20 °C. For extraction, 1.4 mL of acetone/H2O (80:20, v/v) was added into the Eppendorf tubes, which were then shaken for 15 min, and the plant/solvent mixture was allowed to macerate in a refrigerator overnight to enhance the extraction efficiency of especially large PAs.20,21 The tubes were then shaken in a planar shaker for 3 h before centrifuging at 12000g and decanting the solvent. The solvent samples were concentrated for approximately 2 h in an Eppendorf concentrator plus (Eppendorf AG, Hamburg, Germany) to remove the acetone, whereas the plant residues were extracted with a new 1.4 mL of acetone/H2O (80:20, v/v) for an additional 3 h. The two extracts were then combined and concentrated into the water phase. Subsequently, the extracts were frozen and freeze-dried with a Christ Alpha 2-4 (B. Braun Biotech International, Melsungen, Germany) overnight and stored at −20 °C. Prior to injection in the UPLC-MS/MS, samples were dissolved in 1 mL of ultrapure water, shaken for 10 min, filtered with 0.2 μm PTFE syringe filters (VWR International, Radnor, PA, USA), and diluted 4-fold with ultrapure water.
Treatment of Extracts with Sephadex LH-20
For identification of the main monomeric phenolic compounds, equal plant subsamples of 200 mg were taken from 50 randomly selected samples, to obtain a 10 g pooled sample. The pooled sample was then extracted according to the protocol above, but solvent quantities were adjusted according to the increased plant biomass. Of the freeze-dried crude extract, 2 g was dissolved in a small quantity of ultrapure water and loaded onto a Sephadex LH-20 column, which had been equilibrated with 100% water. Solvents were pumped with a flow rate of 5 mL/min with the following gradient: water fraction (100% H2O; 1000 mL), MeOH/H2O (50:50, v/v; 500 mL), acetone/H2O (20:80, v/v; 500 mL), acetone/H2O (40:60, v/v; 500 mL), acetone/H2O (60:40, v/v; 500 mL), and acetone/H2O (80:20, v/v; 500 mL). The fractions were collected separately, organic solvents removed with a rotary evaporator, and the remaining aqueous extracts frozen and lyophilized.
UPLC-MS/MS Analysis
The UPLC-MS/MS analysis was conducted according to the method of Engström et al.19 on the Acquity UPLC system (Waters Corp., Milford, MA, USA), interfaced to a Xevo TQ triple-quadrupole mass spectrometer with electrospray ionization (ESI) (Waters Corp., Milford, MA, USA). In brief, the UPLC system was equipped with an autosampler, a binary solvent manager, a 100 mm × 2.1 mm i.d., 1.7 μm, Acquity UPLC BEH Phenyl column (Waters Corp., Wexford, Ireland), and a diode array detector. The flow rate was set to 0.5 mL/min, and the mobile phase consisted of two solvents: acetonitrile (A) and 0.1% aqueous formic acid (B) with the following gradient profile: 0–0.5 min, 0.1% A in B (isocratic); 0.5–5.0 min, 0.1–30% A in B (linear gradient); 5.0–6.0 min, 30–35% A in B (linear gradient); 6.0–9.5 min, column wash and stabilization. Data collection of both UV and MS occurred continuously from 0 to 6 min. Negative ESI mode was used, with ESI conditions as follows: capillary voltage, 2.4 kV; desolvation temperature, 650 °C; source temperature, 150 °C; desolvation and cone gas (N2), 1000 and 100 L/h, respectively; and argon as collision gas.
Standards and Method Performance
Before each run, a flavonoid mix stock solution containing 4 μg mL–1 each of kaempferol-7-O-glucoside, kaempferol-7-O-neohesperoside, kaempferol-3-O-glucoside, quercetin-3-O-galactoside, and quercetin-3-O-glucoside, in a mixture of acetonitrile/0.1% aqueous formic acid (1:4 v/v), was injected twice to assess the performance of the system (stability of the UPLC retention times and m/z values of the MS detector). Furthermore, a catechin stock solution, containing 1 μg mL–1 of catechin in a mixture of acetonitrile/0.1% aqueous formic acid (1:4 v/v) was injected five times every 10 samples, to account for possible changes in the quantitative performance of the MS/MS system for polyphenols throughout the 110 min that was required for each analysis set of 10 samples. Quantitative results were corrected for possible fluctuations in the system’s quantitative performance within each analysis set, as well as among different sets. Replicate analyses (the same sample injected 10 times) were tested for quantitative results, and the relative standard deviation (RSD) was ±2.8% (range ±0.8–6.5%, Table 1) for all compounds that were analyzed quantitatively.
Table 1. Chromatographic, UV, and Mass Spectral Characteristics of Individual Phenolic Compounds Identified in the Sainfoin Extracta.
| compd | tR | [M – H]− | MS2 | fragments of daughter ion | λmax | tentative ID | MRM | RSD |
|---|---|---|---|---|---|---|---|---|
| 1 | 1.18 | 271 | 108 | 222, 282 | arbutinb,c | 6.5 | ||
| 2 | 2.01 | 331 | 169 | 222, 272 | 1-O-monogalloylglucoseb | 331 → 169 | 2.9 | |
| 3 | 2.44 | 353 | 191, 179, 135 | 108 | 219, 323 | caffeoylquinic acidc | 353 → 191 | 3.5 |
| 4 | 2.87 | 353 | 191 | 171, 155, 137, 115, 108 | 244, 324 | chlorogenic acidb,c | 353 → 191 | 2.5 |
| 5 | 2.92 | 325 | 163, 119 | 119 | ND | coumaric acid glucoside,c,f | ||
| 6 | 2.92 | 625 | 463, 301, 299 | 301 | 255, 352 | quercetin dihexoside | 625 → 300 | |
| 7 | 3.32 | 337 | 191, 173, 163, 119 | 173, 127, 111 | 230, 310 | coumaroylquinic acid,c,f | 337 → 191 | |
| 8 | 3.65 | 337 | 191, 173, 163, 127, 119 | 173, 137, 127, 111 | 234, 304 | coumaroylquinic acid,c,f | 337 → 191 | |
| 9 | 3.68 | 325 | 163, 119 | 117, 101 | 219, 279 | coumaric acid glucoside,c,f | 4.2 | |
| 10 | 2.93 | 771 | 609, 462, 301 | 300, 272, 194 | 255, 352 | quercetin-3-O-rutinoside-7-O-β-d-glucosidef | 3.9 | |
| 11 | 3.56 | 755 | 301 | 255, 352 | quercetin-3-O-rhamnosylrutinosidec,e,f | 1.4 | ||
| 12 | 3.79 | 739 | 285, 284 | 265, 347 | kaempferol-3-O-rhamnosylrutinosidec,f | 1.4 | ||
| 13 | 3.89 | 609 | 301, 300, 271, 255 | 255, 352 | quercetin-3-O-rutinosideb,c,f | 609 → 300 | 2.2 | |
| 14 | 4.20 | 593 | 285 | 265, 346 | kaempferol-3-O-rutinosideb,c,f | 593 → 285 | 0.8 | |
| 15 | 4.24 | 505 | 301 | 254, 351 | quercetinacetyl hexoside | |||
| 16 | 4.28 | 623 | 315, 300 | 254, 352 | isorhamnetin-3-O-rutinosidec | |||
| 17 | 4.62 | 489 | 285, 284, 255, 227 | 265, 335 | kaempferolacetyl hexoside | |||
| 18 | 3.55 | 625 | 316, 271 | 258, 355 | myricetin-3-O-rutinosidec,f | 2.0 | ||
| 19 | 4.41 | 947 | 623, 609, 301, 179 | 300 | 252, 334 | quercetin feruloyl triglycoside | ||
| 20 | 3.94 | 463 | 317, 316, 287, 271, 179, 151 | 228, 349 | myricetin-3-O-rhamnosideb,c | 463 → 316 | ||
| 21 | 4.02 | 463 | 301, 300, 271, 255, 179, 151 | 255, 353 | quercetin-3-O-glucosideb,c | 463 → 300 | ||
| 22 | 4.33 | 447 | 285, 255, 227 | 265, 348 | kaempferol-3-O-glucosideb,c | 447 → 284 | ||
| 23 | 5.10 | 961 | 755, 301, 300, 179 | 300 | 243, 335 | quercetin 3-O-(4‴-O-E-sinapoyl)-α-rhamnopyranosyl-(1‴→2″) [α-rhamnopyranosyl-(1″″→6″)]-β-glucopyranosided | ||
| 24 | 5.12 | 931 | 755, 301, 300 | 300 | 243, 334 | quercetin 3-O-(4‴-O-E-feruloyl)-α-rhamnopyranosyl-(1‴→2″)[α-rhamnopyranosyl-(1″″→6″)]-β-glucopyranosided |
RSD is the relative standard deviation of a replicate quantitative analysis of all the main compounds included in the quantifications. Oligomeric and polymeric proanthocyanidins are not shown in the table because they do not elute as sharp chromatographic peaks. They were identified and quantified by MS/MS according to the method of Engström et al. (2014).19
Identification compared to a reference standard.
As previously identified by Regos et al. (2009).18
As previously identified by Veitch et al. (2011).43
As previously identified by Marais et al. (2000).44
As previously identified by Lu et al. (2000).45
Calibration Curves
In addition to the quantitative measurements of PA concentration and the determination of its composition (PC/PD ratio, mDP, and largest mean degree of polymerization (maxmDP)), we performed a qualitative analysis of 24 individual phenolic compounds, 6 of which were also quantified and thus required calibration curves for quantification (Table 1). Identification of compounds is described in the Supporting Information. Dilution series from stock solutions of 40 μg mL–1 were prepared for calibration of kaempferol-3-O-rutinoside, myricitrin, chlorogenic acid, and rutin and were diluted with H2O. The dilution range was from 40 to 0.3125 μg mL–1. The arbutin dilution series from a stock solution of 200 μg mL–1 diluted in H2O ranged from 200 to 20 μg mL–1, and the dilution series of digalloylglucose was prepared from a stock solution of 10 μg mL–1, ranged from 10 to 0.375 μg mL–1, and was diluted with H2O. Calibration curves for PC and PD concentrations were produced as described in Engström et al. from purified PA stock solutions (1.0 μg mL–1) of a PC-rich sample (Salix caprea leaves: 95% pure, as determined by thiolysis) and a PD-rich sample (Trifolium repens flowers: 98% pure, as determined by thiolysis),19 respectively, by dilution with acetonitrile/H2O (20:80, v/v). The dilution range was from 1.0 to 0.01 μg mL–1. Calibration curves were used to determine the linear range for quantification. The mDP was determined according to the method of Engström et al.19 by calculating the ratio of terminal and extension units for both PCs and PDs (eq S1). As larger PAs tend to elute later, the maxmDP was calculated by utilizing the same method as for mDP, but only integrated the terminal units and extension units from a retention time window from 3.70 to 5.50 min, which enabled a strong enough signal for the terminal and extension units of the larger PAs. Thus, the maxmDP is not the largest polymer size found in the analyzed sample per se, but it shows reliably the mean degree of polymerization for the largest PA polymers that elute in that given retention time window (Figure S2). The maxmDP could also have been calculated from a later retention time window, but this approach would generate less reliable data from samples with low amounts of such PAs.
Statistical Analysis
The primary response variables analyzed were plant weight, leaf ratio, PA concentration, mDP, and share of prodelphinidins. Because accessions were selected for high variability in both their geographic origin and their cultivation status (i.e., cultivars, wild accessions), both criteria were initially tested for their impact on the response variables. It turned out that the geographic origin of an accession was of minor importance in explaining variation in the response variables. Therefore, with regard to the following analyses, accessions were grouped only for their cultivation status without consideration of their origin. The 27 accessions were assigned to one of three groups of cultivation status. Cultivar/cultivated (hereafter referred to as “cultivars”) were accessions that have been cultured substantially and were, in most cases, even registered as cultivars. Ecotype/landrace (referred to as “landraces”) were “adapted to a specific region or location, such as a farm”, that is, a very small scale, with landrace adaptation being driven by human intervention and ecotype adaptation driven by natural selection pressures.22 Wild/unknown (referred to as “wild”) were either wild accessions or accessions for which the cultivation status was not well established, which hints at a very low level of cultivation.
The effects of the cultivation status and the accession on the response variables were analyzed with linear mixed regression.23 With y being one of the response variables (plant weight, etc., see above), the model was
| 1 |
with yijkm being the response of the ith plant of cultivation status j and accession k in block m. The fixed parameter α estimates the mean response of the cultivation status j. To consider the variation of accessions within their status, b was modeled as a random parameter with b–N(0, σb2). Likewise, block was modeled as a random parameter with g–N(0, σg2). The error ei was assumed to be normally distributed with zero mean and variance σ2. The model contrasts were used to infer differences among groups of the cultivation status.
Variability within accessions was evaluated by analysis of the population standard deviations of the 27 accessions. To this aim, a modified version of eq 1 was used:
| 2 |
Here, the fixed parameter β estimates the mean response of accession k, with the random variable block, as defined above. The variance parameter is Var(eki) = σ2δk2, with δ being a ratio that represents k variances, one for each accession. Inferences of the average variances of the three groups j of the cultivation status were derived from a model similar to eq 2, but using only three variance estimates, that is, with Var(eji) = σ2δj2. To achieve normality and homoscedasticity of the error variance, the plant weight was log transformed in eqs 1 and 2, and the PD share was logit transformed, because its values were restricted between zero and one.23P values of all correlations were calculated utilizing Pearson’s product moment correlation coefficient while checking the data for outliers. All analyses were performed using the statistical software R,24 with Figure 2 being generated using the R-package “multcompView”.25
Figure 2.

(A) Proanthocyanidin concentration [PA], (B) mean degree of polymerization (mDP), (C) maximum degree of polymerization (maxmDP), (D) share of prodelphinidins (PD), (E) rutin concentration, and (F) nicotiflorin concentration in leaves of different ages and stems. Boxes display medians (bold line), the first and third quartile (lower and upper line of box), and whiskers extending to the most extreme data point, which is <1.5 times the interquartile range. Different letters among medians indicate significant differences at P ≤ 0.05.
Results and Discussion
Variability among Accessions
Over all 27 accessions, the concentration of PAs in leaves varied by a factor of 2, with the accession average ranging from 23.0 to 47.5 mg g–1 DM (Figure 1). The other PA properties varied less: the accession means of PD share in leaves ranged from 79 to 96% of the PAs and mDP ranged from 11 to 14. The maxmDP ranged from 23 to 32 flavan-3-ol units (results not shown, as maxmDP was strongly related to mDP (R2 = 0.75, P < 0.001)). The largest variability occurred in the forage yield, where the smallest accession had, on average, 0.2 g DM plant–1, whereas the largest accession yielded an average 20.3 g DM plant–1 (Figure 1). The accessions had a highly significant impact on all four parameters described above (P < 0.001).
Figure 1.

(A) Proanthocyanidin concentration [PA] in leaves, (B) mean degree of polymerization (mDP), (C) share of prodelphinidins (PD), and (D) plant weight of sainfoin accessions, arranged in order of their status of cultivation and—within status—increasing plant weight. Displayed are predicted means and population standard deviations of each accession based on regression analysis (eqs 1 and 2). Different letters among group values indicate significant differences at P ≤ 0.05: upper case for group means (eq 1), lower case for standard deviations (eq 2). Note the log-scale in panels C and D. Accession NA/RCAT028437 is abbreviated as RCAT and Cholderton–Hampshire Common as Hampshire.
The cultivation status of the accessions contributed significantly to the overall variability among accessions described above. With their group mean of 32.7 mg g–1 DM, wild accessions had higher (P < 0.001) leaf PA concentrations than cultivars (26.5 mg g–1 DM) and landraces (25.6 mg g–1 DM) (Figure 1). In contrast, group means for yield were clearly higher (P < 0.001) for cultivars (9.7 g DM plant–1) and landraces (8.9 g DM plant–1) than for wild accessions (3.0 g DM plant–1). These effects of cultivation status may be explained by the fact that until now, breeding efforts have been aimed at improving the agronomic performance of sainfoin, as is stated for the breeding of the cultivars Nova and Melrose, bred in Canada.26 Improving yields is a major aim of breeding for all crops and has also been successful during recent decades for forage crops.27 In addition, visual scoring of yield is fast and easy to conduct with a limited amount of labor. This explains why PAs were not a breeding target in the past. However, a recently developed, novel technique has made it possible now to scan large numbers of plants for PAs and thus to exploit the beneficial impacts PAs have on animal health and the environment.19
Although low PA concentrations in cultivars may be insufficient for the bioactivity of sainfoin, we also found that forage yield was of substantial importance for producing high amounts of PAs per plant. This is because the difference between the forage yields in cultivars as compared to those in wild accessions was, on average, 76%, whereas the respective difference in PA concentration was, on average, only 20% (Figure 1). Consequently, when the amount of PAs per plant was calculated (eq S2), as determined by the biomass and PA concentration exhibited in Figure 1, cultivars achieved on average 332 mg plant–1 (median = 298 mg plant–1), which was higher compared to wild accessions (P < 0.01) with 263 mg plant–1 (median = 177 mg plant–1). Landraces were not significantly different from either cultivars or wild accessions with 256 mg plant–1 (median = 234 mg plant–1).
Variability within Accessions
The variability among individual plants within accessions was huge. For example, the standard deviation of PA concentration in leaves of WKT10 was 10.6 mg g–1 DM (Figure 1), meaning that approximately one-third of the plants had PA leaf concentrations >58.1 mg g–1 DM (mean PA of WKT10 + 1 standard deviation) or <36.9 mg g–1 DM (mean – 1 standard deviation). This range in PA within accessions was comparable to the range among the accession means: the greatest mean PA value of all 27 accessions was 47.5 mg PA g–1 DM in WKT10, whereas the smallest PA value was 23.0 mg g–1 DM in Wiedlisbach. The largest variability within accession was found with respect to plant yields. There, the standard deviation for CPI 63820 identified one-third of the plants to be either >21.6 g DM plant–1 or <0.6 g DM plant–1, compared to the range in accession means from 20.3 to 0.3 g DM plant–1. Figure 1 further shows that the variabilities within the accessions (standard deviation) for mDP and PD share were slightly smaller than that of PA leaf concentration.
The cultivation status had a distinct effect on the variability exhibited within accessions: with a group mean standard deviation of 7.5 mg g–1 DM for PA leaf concentration, wild accessions had, on average, a greater (P < 0.001) standard deviation than cultivars (5.9 mg g–1 DM) and landraces (5.3 mg g–1 DM). For plant weight, the average standard deviation in wild accessions (2.9 g DM plant–1) was also larger (P < 0.001) than in both cultivars (2.0 g DM plant–1) and landraces (1.9 g DM plant–1). This may be explained, at least for registered cultivars, by the fact that uniformity is one of the criteria that cultivars have to fulfill for registration, according to paragraph 6 of Council Directive 2002/53/EC of 13 June 2002 from the European Union.28 Still, the observed variability is invaluable for the optimization of sainfoin.
Variability within the Plant
The mean leaf concentration of PAs (averaged over all three age classes of leaves) was 26.8 mg g–1 DM and, thus, was almost 3.5 times higher (P < 0.001) than the stem concentration of PAs, which was only 7.8 mg g–1 DM (Figure 2). This is consistent with the literature, although the extent of the difference was more pronounced in our findings.29,30 The composition of the PAs in sainfoin leaves might also be better suited for anthelmintic effects and methane suppression: leaves had longer (P < 0.001) polymers (mDP = 13, maxmDP = 28) than stems (mDP = 5, maxmDP = 10) and a higher (P < 0.001) share of PDs (89%) than stems (60%). Furthermore, quercetin-O-rutinoside (rutin) and kaempferol-O-rutinoside (nicotiflorin) were also significantly higher (P < 0.001) in leaves than in stems. Leaves had, on average, concentrations of 5.9 mg g–1 DM rutin and 0.7 mg g–1 DM nicotiflorin, compared to stems with 1.4 and 0.0 mg g–1 DM, respectively (Figure 2). Rutin has been shown to exhibit antioxidant and anti-inflammatory properties.31 Additionally, both rutin and nicotiflorin are also expected to enhance the anthelmintic of PAs. A study by Barrau14 found that in high concentrations, rutin resulted in 25% and nicotiflorin in 30% reduction of the larval migration of Hemonchus contortus, as compared to the negative control treatment. The study did not, however, quantify whether this effect was additive with the effect of PAs or whether an interaction between PAs and the flavonoids occurred. The large differences in PAs found in stems and leaves demonstrate that the leaf share of a plant may be as, or even more, important for PA concentration and PA composition of the whole forage plant than the concentration and composition of PA in the leaves alone.
The three leaf age classes differed significantly in their PA properties, although the differences were clearly smaller than those observed between leaves and stems (Figure 2). Proanthocyanidins changed from an average concentration of 38.8 mg g–1 DM in young leaves to 20.9 mg g–1 DM in old leaves (P < 0.001) (Figure 2). The mDP increased (P < 0.001) from 12 to 14 between young and old leaves, whereas the PD share changed (P < 0.05) from young (90%) to old (88%) leaves. Rutin decreased (P < 0.01) from 6.9 to 5.3 mg g–1 DM, and nicotiflorin increased (P < 0.001) from 0.75 to 0.99 mg g–1 DM with aging of leaves. It has to be considered, however, that such concentration changes do not imply anything about the rates of PA synthesis. A graphical vector analysis (GVA), as proposed by Koricheva,32 revealed that at first (young to intermediate aged leaves) the PAs showed predominantly a dilution effect, which indicates that the leaf biomass growth rates were higher than the PA synthesis rates. This reduced the concentration despite the fact that the amount of PA produced per leaf continued to increase. From intermediate-aged to old leaves, there was a shift toward a reduced synthesis rate of PAs (Figure 3), in which case even the PA amount decreased between intermediate and old leaves, although biomass of the leaves increased in the same time period. This indicates that PAs either were metabolized or became insoluble and were, thus, not measured by our method, which detects only soluble PAs. This could, for example, happen when tannins are embedded into cell walls, as previously recorded for ellagitannins (syn. hydrolyzable tannins).33 However, we did a follow-up analysis on the extraction residues of 30 leaf samples (young, intermediate, and old leaves of 10 plants), which were tested for insoluble PAs with the modified HCl–butanol analysis.34 These analyses did not find an increase in insoluble PAs with the aging of leaves (results not shown). Nevertheless, the observed reduction in PA amounts agrees with another study by Lees et al.,35 in which PAs were located with light and electron microscopy in leaves of different developmental stages. These authors found that although PAs were very abundant in young leaves, they seemed to disappear with the aging of the leaf until the cells were almost entirely devoid of PAs.
Figure 3.

Graphical vector analysis for leaves of sainfoin (Onobrychis viciifolia), comparing the concentration and amount of proanthocyanidins (PA). Arrows follow aging of leaves from young to intermediate aged leaves and from there to old leaves. Gray dotted lines are isolines for leaf biomass; arrows crossing the lines indicate changes in biomass. Synthesis rate changes are defined by angle relative to biomass isolines and can be identified with the help of the black arrows on the top right. Error bars indicate standard error.
Trade-offs: Growth Rate Hypothesis
The optimization of sainfoin as a bioactive forage needs not only amelioration of PA properties (concentration and composition) but also an improved biomass yield. Yield increase is crucial in two respects: to produce higher amounts of PAs (at a given concentration of PA in that biomass) and to make sainfoin more competitive compared to high-yielding non-PA forage species. However, there are potential trade-offs that may restrict the concomitant increase of sainfoin yield and PA properties. One potential trade-off between yield and PA properties is based on the growth rate hypothesis (GRH) (also known as resource availability hypothesis).36,37 The GRH is based on the fact that plants have only limited resources, and each resource can be invested in only either growth or defense mechanisms, such as plant secondary metabolites (e.g., PAs). Over all plants, such a trade-off was significant (Figure 4A, R2 = 0.16, P < 0.001). However, plant yield explained only 16% of the observed variability in PA leaf concentration, and this effect was negligible above 5 g DM plant–1 (R2 = 0.01, NS), as seen from the regression line. In addition, within each yield group (e.g., plants of 10–20 g DM), the range in PA concentrations was huge, and a 3-fold difference in PA concentrations is possible. In conclusion, in the yield range that is of interest for plant breeding (large plants), this trade-off is negligible and a large variability in PA leaf concentration is available that will allow improvement of PA leaf concentrations and yields.
Figure 4.

(A) Proanthocyanidin concentration [PA] in leaves and (B) leaf share of individual plants both compared to plant yield. Data are for the first harvests of the years 2013 and 2014. The equation for the exponential trendline and its regression analysis are denoted at the bottom right.
Besides a concomitant increase in PA leaf concentration and yield as discussed above, ameliorating PA composition (at a given concentration of PA) and yield in parallel is a second strategy. The composition of PAs is considered to be at least as important as PA concentration for the bioactivity of PA-containing feeds and their beneficial or antinutritional activity to animal health.7,11 Our results on PA composition demonstrate neither a negative relationship (trade-off) between plant yield and mDP (R2 = 0.01, NS) nor PD share (R2 = 0.02, NS) (see the Supporting Information). Accordingly, enhancing the PAs by improving their composition seems possible and should not be hampered by a parallel increase of the forage yield.
Trade-offs: Reduced Leaf Share with Increased Plant Size
Another potential trade-off between yield and PA properties is based on the leaf share of the plant. Given the on-average 3.5 times higher PA concentration in leaves as compared to stems (Figure 2), the leaf share of the plant becomes an important factor in determining PA concentration of the entire forage,38,39 and studies generally found reduced leaf share in bigger plants.40 In fact, Figure 4B shows such a negative correlation (trade-off) between yield and leaf share (R2 = 0.66, P < 0.001). However, when observing only plants larger than 20 g DM, leaf share appears quite stable at about 43%, as can be seen in the regression line (Figure 4B), and no significant effect on leaf share occurred anymore with higher plant weight. In addition, the variability in leaf share was quite large and exhibited a 2-fold variation for three of four plant size classes (vertical lines, Figure 4B) above 20 g DM. This indicates that yields could be extensively increased without compromising the leaf share and that there seems to be enough variability to increase the leaf share at any given plant size. Finally, the possible increments in yield without further reductions in leaf share for plant weights above 20 g DM are also of importance, as Borreani et al. identified the leaves to be richer in crude protein and lower in neutral detergent fiber (NDF) than the stems (on average, 227.7 and 83.3 g kg–1 DM crude protein and 240.0 and 527.7 g kg–1 DM NDF for leaves and stems, respectively).41 Whereas Azuhnwi et al. in a comparison of 15 different sainfoin accessions found significant differences in both crude protein and NDF between these accessions, the ranges of 156–182 g kg–1 DM for crude protein and 378–417 g kg–1 DM for NDF were much lower than the differences between leaves and stems.42
In conclusion, we found that a large variability exists for breeding a sainfoin ideotype with high yields and large amounts of PAs with every possible combination of PD share and mDP, which will be identified to be ideal to obtain high bioactivity. This is of particular importance, as bioactivity is currently the main driver for the cultivation of sainfoin, yet cultivation becomes attractive only once the forage yield is competitive with those of other forage legumes. Our results suggest three independent strategies to increase bioactivity in the entire forage, which could have an additive effect, if applied together: (1) to ameliorate the composition of PAs, (2) to increase the overall PA concentration in sainfoin organs, and (3) to increase the share of leaves, which are the organs with the highest PA concentration. These findings further strengthen the opportunities offered by sainfoin to ameliorate the sustainability of livestock production.
Acknowledgments
We are very grateful to the USDA ARS-GRIN germplasm database for the provision of the seeds of the sainfoin accessions. We thank Matthias Suter for his consultancy regarding statistical questions. Furthermore, we thank Hansueli Hirschi, Erich Rosenberg, and Friederike Johnigk for their support with the field work and sample preparation, as well as Maarit Karonen, Anne Koivuniemi, and Jorma Kim for their guidance and assistance in the laboratory. Juuso Laitila helped with the analysis of insoluble tannins.
Glossary
Abbreviations Used
- PAs
proanthocyanidins
- DM
dry matter
- PD
prodelphinidins
- PC
procyanidins
- mDP
mean degree of polymerization
- GRH
growth rate hypothesis
- ESI
electrospray ionization
- RSD
relative standard deviation
- maxmDP
largest mDP
- GVA
graphical vector analysis
- NDF
neutral detergent fiber
Supporting Information Available
The Supporting Information is available free of charge on the ACS Publications website at DOI: 10.1021/acs.jafc.5b04946.
All examined accessions with their status of cultivation, country of origin, and ploidy, a visual comparison of different leaf ages, calculation for the mean degree of polymerization (mDP) and the largest mean degree of polymerization (maxmDP), formula for the calculation of the amount of proanthocyanidins, description of the identification of phenolic compounds, and correlation between plant weight and PD share and between plant weight and maxmDP (PDF)
These investigations were supported by the European Commission (PITN-GA-2011-289377, “LegumePlus” project). Sample analyses by UPLC-MS/MS were made possible by a strategic grant of the University of Turku (Ecological Interactions).
The authors declare no competing financial interest.
Supplementary Material
References
- Chorley P. Early evidence of sainfoin cultivation around Paris. Agric. History Rev. 1981, 29, 118–124. [Google Scholar]
- Boller B.; Schubiger F. X.; Koelliker R.. Red clover. In Fodder Crops and Amenity Grasses, 1st ed.; Boller B., Posselt U. K., Veronesi F., Eds.; Springer: New York, 2010; Vol 5, pp 439–456. [Google Scholar]
- Kingston-Smith A. H.; Edwards J. E.; Huws S. A.; Kim E. J.; Abberton M. Plant-based strategies towards minimising ‘livestock’s long shadow’. Proc. Nutr. Soc. 2010, 69, 613–620 10.1017/S0029665110001953. [DOI] [PubMed] [Google Scholar]
- Lüscher A.; Mueller-Harvey I.; Soussana J. F.; Rees R. M.; Peyraud J. L. Potential of legume-based grassland–livestock systems in Europe: a review. Grass Forage Sci. 2014, 69, 206–228 10.1111/gfs.12124. [DOI] [PMC free article] [PubMed] [Google Scholar]
- Wang Y.; McAllister T. A.; Acharya S. Condensed tannins in sainfoin: composition, concentration, and effects on nutritive and feeding value of sainfoin forage. Crop Sci. 2015, 55, 13–22 10.2135/cropsci2014.07.0489. [DOI] [Google Scholar]
- Aufrere J.; Dudilieu M.; Andueza D.; Poncet C.; Baumont R. Mixing sainfoin and lucerne to improve the feed value of legumes fed to sheep by the effect of condensed tannins. Animal 2013, 7, 82–92 10.1017/S1751731112001097. [DOI] [PubMed] [Google Scholar]
- Mueller-Harvey I. Unravelling the conundrum of tannins in animal nutrition and health. J. Sci. Food Agric. 2006, 86, 2010–2037 10.1002/jsfa.2577. [DOI] [Google Scholar]
- Scharenberg A.; Arrigo Y.; Gutzwiller A.; Soliva C. R.; Wyss U.; Kreuzer M.; Dohme F. Palatability in sheep and in vitro nutritional value of dried and ensiled sainfoin (Onobrychis viciifolia) birdsfoot trefoil (Lotus corniculatus), and chicory (Cichorium intybus). Arch. Anim. Nutr. 2007, 61, 481–496 10.1080/17450390701664355. [DOI] [PubMed] [Google Scholar]
- Kommuru D. S.; Barker T.; Desai S.; Burke J. M.; Ramsay A.; Mueller-Harvey I.; Miller J. E.; Mosjidis J. A.; Kamisetti N.; Terrill T. H. Use of pelleted sericea lespedeza (Lespedeza cuneata) for natural control of coccidia and gastrointestinal nematodes in weaned goats. Vet. Parasitol. 2014, 204, 191–198 10.1016/j.vetpar.2014.04.017. [DOI] [PubMed] [Google Scholar]
- Mechineni A.; Kommuru D. S.; Gujja S.; Mosjidis J. A.; Miller J. E.; Burke J. M.; Ramsay A.; Mueller-Harvey I.; Kannan G.; Lee J. H.; et al. Effect of fall-grazed sericea lespedeza (Lespedeza cuneata) on gastrointestinal nematode infections of growing goats. Vet. Parasitol. 2014, 204, 221–228 10.1016/j.vetpar.2014.06.002. [DOI] [PubMed] [Google Scholar]
- Hatew B.; Stringano E.; Mueller-Harvey I.; Hendriks W. H.; Carbonero C. H.; Smith L. M. J.; Pellikaan W. F.. Impact of variation in structure of condensed tannins from sainfoin (Onobrychis viciifolia) on in vitro ruminal methane production and fermentation characteristics. J. Anim. Physiol. Anim. Nutr. 2015, DOI: 10.1111/jpn.12336. [DOI] [PubMed] [Google Scholar]
- Huang X. D.; Liang J. B.; Tan H. Y.; Yahya R.; Long R.; Ho Y. W. Protein-binding affinity of Leucaena condensed tannins of differing molecular weights. J. Agric. Food Chem. 2011, 59, 10677–10682 10.1021/jf201925g. [DOI] [PubMed] [Google Scholar]
- Zeller W. E.; Sullivan M. L.; Mueller-Harvey I.; Grabber J. H.; Ramsay A.; Drake C.; Brown R. H. Protein precipitation behavior of condensed tannins from Lotus pedunculatus and Trifolium repens with different mean degrees of polymerization. J. Agric. Food Chem. 2015, 63, 1160–1168 10.1021/jf504715p. [DOI] [PubMed] [Google Scholar]
- Barrau E.; Fabre N.; Fouraste I.; Hoste H. Effect of bioactive compounds from sainfoin (Onobrychis viciifolia Scop.) on the in vitro larval migration of Haemonchus contortus: role of tannins and flavonol glycosides. Parasitology 2005, 131, 531–538 10.1017/S0031182005008024. [DOI] [PubMed] [Google Scholar]
- Klongsiriwet C.; Quijada J.; Williams A. R.; Mueller-Harvey I.; Williamson E. M.; Hoste H. Synergistic inhibition of Haemonchus contortus exsheathment by flavonoid monomers and condensed tannins. Int. J. Parasitol.: Drugs Drug Resist. 2015, 5, 127–134 10.1016/j.ijpddr.2015.06.001. [DOI] [PMC free article] [PubMed] [Google Scholar]
- Lattanzio V. Bioactive polyphenols: their role in quality and storability of fruit and vegetables. J. Appl. Bot. 2003, 77, 128–146. [Google Scholar]
- Scioneaux A.; Schmidt M.; Moore M.; Lindroth R.; Wooley S.; Hagerman A. Qualitative variation in proanthocyanidin composition of populus species and hybrids: genetics is the key. J. Chem. Ecol. 2011, 37, 57–70 10.1007/s10886-010-9887-y. [DOI] [PubMed] [Google Scholar]
- Regos I.; Urbanella A.; Treutter D. Identification and quantification of phenolic compounds from the forage legume sainfoin (Onobrychis viciifolia). J. Agric. Food Chem. 2009, 57, 5843–5852 10.1021/jf900625r. [DOI] [PubMed] [Google Scholar]
- Engström M. T.; Pälijärvi M.; Fryganas C.; Grabber J. H.; Mueller-Harvey I.; Salminen J.-P. Rapid qualitative and quantitative analyses of proanthocyanidin oligomers and polymers by UPLC-MS/MS. J. Agric. Food Chem. 2014, 62, 3390–3399 10.1021/jf500745y. [DOI] [PubMed] [Google Scholar]
- Salminen J.-P. Effects of sample drying and storage, and choice of extraction solvent and analysis method on the yield of birch leaf hydrolyzable tannins. J. Chem. Ecol. 2003, 29, 1289–1305 10.1023/A:1024249016741. [DOI] [PubMed] [Google Scholar]
- Baert N.; Karonen M.; Salminen J.-P.. Isolation, characterisation and quantification of the main oligomeric macrocyclic ellagitannins in Epilobium angustifolium by ultra-high performance chromatography with diode array detection and electrospray tandem mass spectrometry. J. Chromatogr., A 2015, 1419, 26. 10.1016/j.chroma.2015.09.050. [DOI] [PubMed] [Google Scholar]
- Boller B.; Greene S.. Genetic resources. In Fodder Crops and Amenity Grasses, 1st ed.; Boller B., Posselt U. K., Veronesi F., Eds.; Springer: New York, 2010; Vol. 5, pp 13–38. [Google Scholar]
- Pinheiro J.; Bates D.; DebRoy S.; Sarkar D.. R Core Team. nlme: Linear and Nonlinear Mixed Effects Models, R package version 3.1-117; 2014. [Google Scholar]
- R Core Team. R: A Language and Environment for Statistical Computing, Vienna, Austria, 2014. [Google Scholar]
- Figueroa-Pérez M. G.; Rocha-Guzmán N. E.; Pérez-Ramírez I. F.; Mercado-Silva E.; Reynoso-Camacho R. Metabolite profile, antioxidant capacity, and inhibition of digestive enzymes in infusions of peppermint (Mentha piperita) grown under drought stress. J. Agric. Food Chem. 2014, 62, 12027–12033 10.1021/jf503628c. [DOI] [PubMed] [Google Scholar]
- Goplen B. P.; Richards K. W.; Moyer J. R.. Sainfoin for Western Canada, 3rd ed.; Agriculture Canada: Ottawa, Canada, 1991; pp 1–22. [Google Scholar]
- Walter A.; Studer B.; Kölliker R. Advanced phenotyping offers opportunities for improved breeding of forage and turf species. Ann. Bot. 2012, 110, 1271–1279 10.1093/aob/mcs026. [DOI] [PMC free article] [PubMed] [Google Scholar]
- Council of the European Union, Council Directive 2002/53/EC of 13 June 2002 on the common catalogue of varieties of agricultural plant species. In Off. J. Eur. Union 2002, L193, 0001–0011. [Google Scholar]
- Theodoridou K.; Aufrere J.; Andueza D.; Le Morvan A.; Picard F.; Stringano E.; Pourrat J.; Mueller-Harvey I.; Baumont R. Effect of plant development during first and second growth cycle on chemical composition, condensed tannins and nutritive value of three sainfoin (Onobrychis viciifolia) varieties and lucerne. Grass Forage Sci. 2011, 66, 402–414 10.1111/j.1365-2494.2011.00798.x. [DOI] [Google Scholar]
- Stringano E.; Carbonero C. H.; Smith L. M. J.; Brown R. H.; Mueller-Harvey I. Proanthocyanidin diversity in the EU ‘HealthyHay’ sainfoin (Onobrychis viciifolia) germplasm collection. Phytochemistry 2012, 77, 197–208 10.1016/j.phytochem.2012.01.013. [DOI] [PubMed] [Google Scholar]
- Lee C.-C.; Shen S.-R.; Lai Y.-J.; Wu S.-C. Rutin and quercetin, bioactive compounds from tartary buckwheat, prevent liver inflammatory injury. Food Funct. 2013, 4, 794–802 10.1039/c3fo30389f. [DOI] [PubMed] [Google Scholar]
- Koricheva J. Interpreting phenotypic variation in plant allelochemistry: problems with the use of concentrations. Oecologia 1999, 119, 467–473 10.1007/s004420050809. [DOI] [PubMed] [Google Scholar]
- Salminen J.-P.; Ossipov V.; Pihlaja K. Distribution of hydrolysable tannins in the foliage of Finnish birch species. Z. Naturforsch., C: J. Biosci. 2002, 57, 248–256 10.1515/znc-2002-3-409. [DOI] [PubMed] [Google Scholar]
- Grabber J. H.; Zeller W. E.; Mueller-Harvey I. Acetone enhances the direct analysis of procyanidin- and prodelphinidin-based condensed tannins in lotus species by the butanol-HCl-iron assay. J. Agric. Food Chem. 2013, 61, 2669–2678 10.1021/jf304158m. [DOI] [PubMed] [Google Scholar]
- Lees G. L.; Gruber M. Y.; Suttill N. H. Condensed tannins in sainfoin. 2. Occurrence and changes during leaf development. Can. J. Bot. 1995, 73, 1540–1547 10.1139/b95-167. [DOI] [Google Scholar]
- Coley P. D.; Bryant J. P.; Chapin F. S. Resource availability and plant antiherbivore defense. Science 1985, 230, 895–899 10.1126/science.230.4728.895. [DOI] [PubMed] [Google Scholar]
- Stamp N. Out of the quagmire of plant defense hypotheses. Q. Rev. Biol. 2003, 78, 23–55 10.1086/367580. [DOI] [PubMed] [Google Scholar]
- Häring D. A.; Scharenberg A.; Heckendorn F.; Dohme F.; Lüscher A.; Maurer V.; Suter D.; Hertzberg H. Tanniferous forage plants: agronomic performance, palatability and efficacy against parasitic nematodes in sheep. Renewable Agric. Food Syst. 2008, 23, 19–29 10.1017/S1742170507002049. [DOI] [Google Scholar]
- Häring D. A.; Suter D.; Amrhein N.; Lüscher A. Biomass allocation is an important determinant of the tannin concentration in growing plants. Ann. Bot. 2007, 99, 111–120 10.1093/aob/mcl227. [DOI] [PMC free article] [PubMed] [Google Scholar]
- Lemaire G.; Gastal F.. N uptake and distribution in plant canopies. In Diagnosis of the Nitrogen Status in Crops; Lemaire G., Ed.; Springer: Berlin, Germany, 1997; pp 3–43. [Google Scholar]
- Borreani G.; Peiretti P. G.; Tabacco E. Evolution of yield and quality of sainfoin (Onobrychis viciifolia Scop.) in the spring growth cycle. Agronomie 2003, 23, 193–201 10.1051/agro:2002082. [DOI] [Google Scholar]
- Azuhnwi B. N.; Boller B.; Martens M.; Dohme-Meier F.; Ampuero S.; Gunter S.; Kreuzer M.; Hess H. D. Morphology, tannin concentration and forage value of 15 Swiss accessions of sainfoin (Onobrychis viciifolia Scop.) as influenced by harvest time and cultivation site. Grass Forage Sci. 2011, 66, 474–487 10.1111/j.1365-2494.2011.00811.x. [DOI] [Google Scholar]
- Veitch N. C.; Regos I.; Kite G. C.; Treutter D. Acylated flavonol glycosides from the forage legume, Onobrychis viciifolia (sainfoin). Phytochemistry 2011, 72, 423–429 10.1016/j.phytochem.2011.01.001. [DOI] [PubMed] [Google Scholar]
- Marais J. P. J.; Mueller-Harvey I.; Brandt E. V.; Ferreira D. Polyphenols, condensed tannins, and other natural products in Onobrychis viciifolia (Sainfoin). J. Agric. Food Chem. 2000, 48, 3440–3447 10.1021/jf000388h. [DOI] [PubMed] [Google Scholar]
- Lu Y. R.; Sun Y.; Foo L. Y.; McNabb W. C.; Molan A. L. Phenolic glycosides of forage legume Onobrychis viciifolia. Phytochemistry 2000, 55, 67–75 10.1016/S0031-9422(00)00143-6. [DOI] [PubMed] [Google Scholar]
Associated Data
This section collects any data citations, data availability statements, or supplementary materials included in this article.