Abstract
Functional near-infrared spectroscopy (fNIRS) has been increasingly utilized for detecting human cerebral activity in many disciplines because of the potential for less-restraining conditions. However, users often suffer from motion artifacts originating from optode fluctuation during task execution when the task includes motion. In such cases, the optode fluctuation induces changes both in the reflection by hair and in the transmission between the optode and scalp. If part of the reflected light is directly received by the detector optode (short-circuited light), it will contaminate the fNIRS signal. The transmittance change at the optode–scalp gap will also contaminate the signal. In this study, we proposed an optical model on the influence of optode fluctuation on the fNIRS signal and a method for removing the influence. The model revealed the following: (1) the received short-circuited light and the gap transmittance change generated a baseline change in the detected light intensity, and (2) the signal from the tissues was downscaled with increases in the receiving intensity of short-circuited light. To avoid erroneous detection of short-circuited light, we developed a method that optically eliminated hair-reflected light from the detection using linearly polarized light sources and an orthogonally polarized analyzer. The method was validated with an optical phantom possessing a haired surface. The optical absorbance change of a close source–detector (S-D) pair equipped with polarizers was very similar to that of distant S-D pairs, even though these optodes were artificially fluctuated. By combining the multidistance optode arrangement technique with the short-circuited light elimination method, the measurement could effectively eliminate motion artifacts originating from optode fluctuation.
OCIS codes: (170.0170) Medical optics and biotechnology, (170.2655) Functional monitoring and imaging, (170.3880) Medical and biological imaging
1. Introduction
Along with a growing utilization of commercial fNIRS systems in many disciplines, several practical problems in fNIRS measurements have emerged in recent years. The most important issue among them is how to remove many kinds of signal contaminants other than the true signal resulting from cerebral functional hemodynamics. Such contaminants include baseline changes caused by optode fluctuations because of the subject’s motion, and adverse effects caused by scalp blood flow. The extraneous baseline changes, referred to as motion artifacts, have troubled users ever since systems became commercially available. Although some useful methods for removing the scalp blood effect from fNIRS signal have been developed in recent years, including multidistance optode arrangement techniques [1–4] and diffusion optical imaging [5, 6], the problem of motion artifacts has been left essentially unsolved. A study using optodes attached on the forehead area reported that multidistance NIRS methods are generally better in reducing movement artifacts than the conventional single distance NIRS [7]. In fact, even if the multidistance optode arrangement fNIRS is used, the subject’s motion often evoked baseline changes that obviously differed from the hemodynamic changes in the scalp and cerebral layers. This is because the optode fluctuation generated by the subject’s motion induces various patterns of fNIRS baseline change for every optode, where the patterns show distinct spikes that are often followed by a considerable amount of baseline shift and more prolonged baseline drifts. If different patterns are obtained with the close and distant S-D pairs in a multidistance optode arrangement or by diffusion optical imaging, the difference in baselines causes errors in the methods. Consequently, motion artifacts are observed in not only in the usual fNIRS measurement but also in the multidistance fNIRS measurement and diffusion optical imaging technique.
Under such conditions, commercial fNIRS users are sometimes forced to execute their experiments with subjects under restrained conditions to avoid motion artifacts, even if it obviously wastes its technical advantage of allowing for less-restraint. In other cases, users are forced to discard the data that contains motion artifacts, or remove the artifacts using some ad hoc method. In recent years, several kinds of method were proposed for removing motion artifacts in fNIRS signal [8–12, 16, 17]. Some were based on data processing techniques such as the spline interpolation [8], the wavelet filtering [9, 10], the autoregression [11], and the principal component analysis [12]. Comparisons in artifact corrections using them and other techniques were reported [13–15]. Also, a combing use of other biological markers [16] and a stabilization of optodes to the scalp surface [17] were proposed. However, every method of them does not have a sufficient theoretical basis to determine whether the signal fluctuation is a motion artifact or not. Therefore, the performance of such techniques often differs according to the method, criterion, optode fixture, cerebral area, subject, stimuli or tasks, and wavelengths of light used. In some disciplines, such as the neuroscience of infants and medicines in sports or rehabilitation, reliable fNIRS measurements should be performed on unrestrained subjects. Therefore, removal of motion artifacts is a crucial problem and some theoretical basis of motion artifact generation will be necessary to establish a universal method for motion artifact removal.
Because almost all types of fNIRS optodes merely have physical contact with the scalp surface, an air gap between the optode and scalp inevitably exists. In the measurement at a region of a hair-covered head, a certain amount of hairs necessarily lie in the optode–scalp gap. This is because the optode aperture of several millimeters in usual systems is larger than the hair root’s spatial interval of approximately 1 mm in the human adult scalp. In such an optode–scalp gap at a hair-covered area, instead of propagating through the head tissues, part of the illumination light from the source optode are reflected by hairs and directly received by a neighboring detector optode. As detailed in the following section, such “short-circuited” light increases the total amount of the detection intensity and decreases the contribution from signals of tissue travelling light. This effect may be serious enough to affect precise measurements of hemoglobin changes in tissue layers with fNIRS. Moreover, the reflection and transmission of light at the optode–scalp gap simultaneously changes with the optode fluctuation along with the subject’s head motion. Consequently, not only the contribution rate but also the signal intensity of tissue travelling light changes temporally, which produces artifacts complicated by baseline fluctuations and sensitivity alterations in fNIRS signals. Such motion artifacts are significant in cases, such as multidistance optode arrangements and diffusion optical imaging where close S-D pairs are used.
In the motion artifact generation, the detection of singly hair-reflected light may predominantly affect the fNIRS measurement because its intensity is less attenuated than those repeatedly hair-reflected or traveled through tissues. Therefore, exclusion of the singly hair-reflected light from detection may be an effective method to decrease motion artifacts. The surface of human hair produces specular reflection of light in a broad range from visible to near-infrared wavelengths. This is noteworthy because the polarization of illumination lightto an extent holds after a single reflection at hair. By using a pair of linear polarizers at the source and detector optodes in an orthogonal direction with each other, the singly reflected light (the major component in motion artifacts) can be effectively eliminated from detection.
In this study, we developed an optical model for the generation of motion artifacts in fNIRS signals. On the basis of this model, we investigated the influence of reflection and transmission changes in the optode–scalp gap, the effect of exclusion of short-circuited light, and its combined use with a multidistance optode arrangement. Finally, we implemented and evaluated the methods using a fNIRS system with optical polarizer films and a phantom equipped with a haired surface.
2. Materials and methods
2.1. Optical model on the motion artifact generation
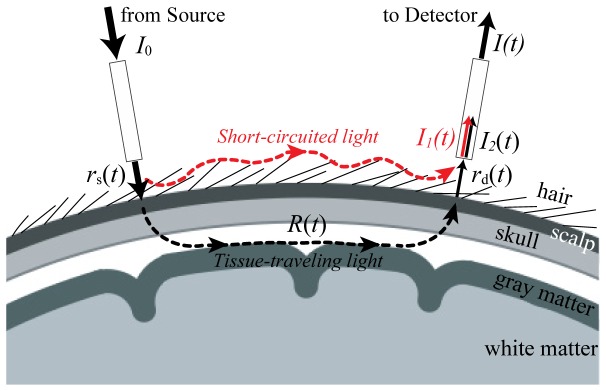
To understand how the optode fluctuation generates motion artifacts in the fNIRS signal, we created an optical model of the generation of motion artifacts considering reflection and transmission in the optode–scalp gap. A typical optical process through the fNIRS measurement using an S-D pair is illustrated in Fig. 1 . Here, and are the total intensities of illumination light and detected light, respectively. Part of the illumination light is reflected by hairs and is received by the detector optode, which is referred to as the short-circuited light. The intensity of short-circuited light is denoted as . Another part of the illumination light travels through the head tissues and some amount reaches the detector optode, which is referred to as the tissue-travelling light. The intensity of tissue-travelling light is denoted as . The is attenuated depending on transmittances of the source–scalp gap , head tissue , and scalp-detector gap and .
Fig. 1.
Illustration of the optical model for motion artifact generation. The light illuminated by the source optode is either partly reflected at hairs to get short-circuited, or travels through the tissues. Both are received by detector optode. , illumination intensity; , intensity of short-circuited light; , transmittance at source–scalp gap; , transmittance at head tissues; , transmittance at optode–scalp gap; , intensity of tissue-traveling light; , total detection intensity.
On the basis of the definition in conventional fNIRS measurements, the temporal absorbance change between the source–detector (S-D) pair can be defined and transformed as follows:
| (1) |
where denotes the initial value of at . The tissue transmittance is written as , where denotes the tissue transmittance change from the initial value.
If an ideally stable and close contact occurs between the optodes and scalp surface, , and are assumed. In this condition, Eq. (1) is simply transformed to which genuinely reflects only the tissue transmittance change. Many fNIRS studies have interpreted the measured data on the basis of this assumption of the ideal condition. In practice, however, optodes often fluctuate with inadvertent or task-evoked motion in the subject. In such non-ideal conditions, , and as well as temporally change. Under this condition, the first term in Eq. (1) generates various patterns of baseline change. Because exists as a non-zero value, the second term in Eq. (1) is no longer . Remarkably, the contribution of to the second term decreases with the increase of . We refer to this as the signal-bleaching effect in fNIRS measurements, which varies with the amplitude of the short-circuited light . In extreme cases when >> , the second term goes to zero even if the itself genuinely reflects the neural activity. In contrast, as long as the condition of exists, the second term in Eq. (2) exactly coincides with , even if and variously fluctuate.
Consequently, to avoid signal bleaching and appropriately detect the tissue transmittance change by fNIRS, the elimination of short-circuited light is crucial, regardless of whether the experiment includes subject’s motion or not. In addition, minimization of the first term in Eq. (1) is necessary to thoroughly decrease motion artifacts. We addressed these issues with a two-step approach. First, we eliminated the short-circuited light using the optical polarization technique to extract the change in tissue transmittance. Second, by combining this technique with the multidistance optode arrangement technique proposed in our previous work [3], the remaining baseline fluctuation was minimized.
2.2. Elimination of short-circuited light using optical polarizer films
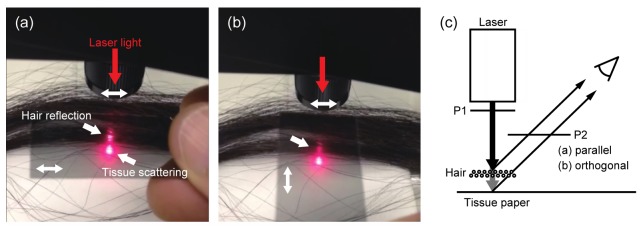
In previous fNIRS studies on multidistance optode arrangement techniques, S-D pairs of short distance are often used for monitoring scalp blood flow. Because the short-circuited light is more intense when shorter S-D distances are used, signal bleaching as well as baseline fluctuations will be significantly pronounced in these cases, which may decrease the reliability of scalp blood flow monitoring. To eliminate the short-circuited light, we proposed an optical method using a pair of linear polarizers attached to the source and detector optodes in orthogonal directions with each other. This method is demonstrated in Fig. 2 . Its experimental setting is illustrated in Fig. 2(c). A laser light at a visible wavelength of 670 nm was used to visualize the light elimination effect. The laser light was polarized with the first optical polarizer film (P1) and then partly reflected by an artificial hair and partly transmitted through the hair and scattered at a piece of tissue paper overlaid on a base. The hair reflection and the tissue paper scattering were observed through another optical polarizer film (P2). The polarization direction of P2 was switched between parallel and orthogonal to that of P1 in (a) and (b) of Fig. 2, respectively. In both photographs (a) and (b) in Fig. 2, two light spots corresponding to the hair reflection and the base scattering were observed. However, only the brightness of hair reflection distinctively decreased by switching the direction of P2 from parallel (a) to orthogonal (b) to that of P1, whereas the brightness of the scattering spot at the tissue paper had no significant change between (a) and (b).
Fig. 2.
Elimination effect on the hair reflected light using a pair of polarizers. (a) Parallel configuration of polarizers. (b) Orthogonal configuration of polarizers. (c) Setup of optical elements for the demonstration. P1, polarizer for illumination light; P2, polarizer for reflected or scattered light.
This finding suggested that the light reflected by hairs considerably held its polarization direction, whereas the light scattering at the tissue paper did not. Therefore, hair reflected light was exclusively eliminated from detection through P2 in an orthogonal direction to P1. If the same effect could be expected with near-infrared light on human hair and head tissues, only the short-circuited light in fNIRS measurement may be effectively eliminated without the loss of the tissue-traveling light. As detailed in a later section, we used an optical polarizer film specialized for eliminating the short-circuited light in the near-infrared wavelength range. Under such conditions, holds and Eq. (1) is transformed as follows:
| (2) |
Here, the second term reflects the tissue transmittance without any signal-bleaching effect. However, there still remains the first term that may change according to the optode fluctuation and ; therefore, certain minimization techniques for the first term are required.
2.3. Motion artifact removal with combined use of multidistance fNIRS
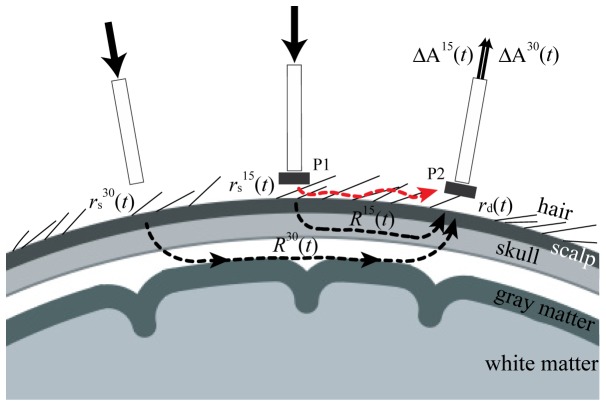
To minimize the first term in Eq. (2), we used a multidistance optode arrangement technique proposed in our previous study [3]. We arranged optodes of two sources and one detector with different S-D distances of 15 mm and 30 mm as shown in Fig. 3 . The absorbance changes and were observed by using S-D pairs of 15 and 30 mm, respectively. When the short-circuited light at S-D pairs in each distance were sufficiently decreased, follows Eq. (2).
Fig. 3.
Schematic illustration of the proposed method with combined use of the multidistance optode arrangement and the short-circuited light elimination method. For eliminating short-circuited light from the source to detector optodes at S-D pairs of 15 mm distance, polarizers P1 and P2 were arranged in orthogonal directions with each other. and , transmittances of optode–scalp gaps at source optodes of 30 mm and 15 mm distance from the detector optode, respectively; and , transmittances of head tissues when S-D pairs of 30 mm and 15 mm were used, respectively; , transmittance between the detector optode and scalp surface; and , absorbance changes when S-D pairs of 30 mm and 15 mm were used, respectively.
Typically, fNIRS techniques, including most of the multidistance techniques, assume that the data includes no motion artifact; thus, the absorbance change at S-D pair of distance d is written as follows:
| (3) |
In such a case, we can obtain an absorption coefficient change in the gray matter layer through a weighted subtraction between and as follows.
| (4) |
where indicates an optical partial path length in the gray matter layer at S-D pair of distance d. The subtraction weighting factor k theoretically means the ratio of optical partial path lengths in the superficial tissue layer between S-D pairs of 15 and 30 mm. In practice, however, each value of optical partial path length cannot be directly measured by any empirical method. In the Monte Carlo simulation on a five-layered optical slab model in the same previous study, we calculated the optical partial path length in each layer and S-D distance and the results showed the k value to be approximately 1 at wavelengths typically used in fNIRS measurements. As a more empirical procedure, the ratio k can be estimated by realizing a criterion below.
| (5) |
where and are absorbance changes in the resting state obtained with S-D pairs in distances of 15 mm and 30 mm, respectively. Because the absorbance changes in the resting state at both S-D pairs should not contain the targeted cerebral functional hemodynamic component, we can expect that and indicate similar temporal patterns mainly associated with hemodynamics in the superficial tissue layer. Therefore, Eq. (5) works as a stable empirical criterion for estimating k and the values estimated were approximately 1 for human adult subjects. In any case, appropriately introduced k values satisfies Eq. (4).
We used the multidistance technique depicted above extensionally for data, including motion artifacts. Using Eq. (2), (3) and (4), the weighted subtraction can be transformed as follows:
| (6) |
Because the k theoretically means the ratio of the partial path length in the superficial tissue layer at S-D pairs in distance of 15 mm and 30 mm, it should hold a constant value even if and fluctuate in any amplitude, and it indicate approximately 1 for a human adult head. In the condition of , the detector optode fluctuation in Eq. (6) is cancelled and no longer influences the measurement. On the other hand, the source optode fluctuations and may still influence the measurement. Only in the case where the temporal patterns and amplitudes in and are similar to each other, their influences on the measurements effectively decrease. The similarity between and highly depends on techniques used for optode fixation. The cross-linkage of adjacent optodes may unify these optodes and thus be effective for consolidating the similarity between and . As described in a later section, we used an originally designed optode holding system for consolidating the similarity between and . Consequently, by combining the multidistance optode arrangement technique with the optical method of short-circuited light elimination, motion artifacts originating from optode fluctuations could be effectively removed.
In this study, experimental data obtained with the optical phantom naturally did not include functional hemodynamics as similar to data in the resting state. Thus, the k value could be estimated using the criterion Eq. (5). On the basis of the modified Lambert–Beer’s law, the oxygenated and deoxygenated hemoglobin changes were finally calculated with the use of obtained with Eq. (6). The molar absorption coefficients at wavelengths used in calculation were taken from a literature reference [18].
2.4. Implementation of the proposed method
A commercially available fNIRS system OEG-16 (Spectratech, Inc., Japan) was improved to use for the current experiments. This improved system was detailed in a previous report [19]. Briefly, the system has six high illumination LEDs as sources and six avalanche photodiodes as detectors. Their apertures were 4 mm in diameter. The LEDs emitted quasi-monochromatic light at peak wavelengths of 770 nm and 840 nm. Each detector received the light from every source and their intensity was sampled at a rate of 6.1 Hz. In this study, three sources and two detectors were used for evaluating the proposed method.
Sources and detectors of the system were cross-linked by using the originally designed holder system. The holding mechanism was detailed in previous reports [19, 20]. Briefly, adjacent optodes were cross-linked by two-layered linkage plates. The lower plates hold the distances between optodes. The upper plates were equipped with elongated holes and nuts, which consolidate the curvature of the holder along with the shape of the individual head surface. The cross-linked optodes moved as a unified body against extraneous fluctuations, which may cause the patterns and magnitudes in fluctuation of adjacent optodes to be similar with each other.
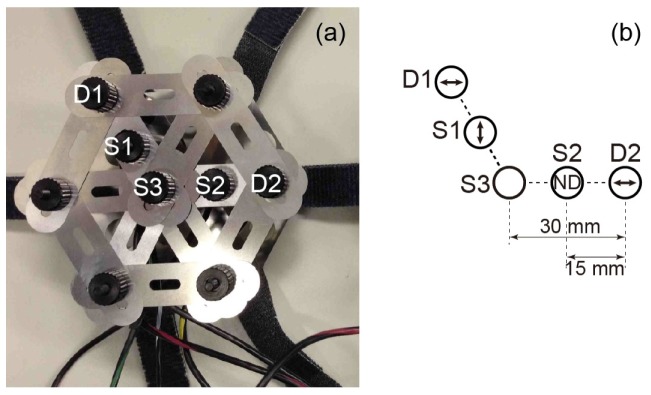
Figure 4 shows the geometrical arrangement of sources and detectors used in the experiments. Two couples of multidistance optode arrangements (i.e., S3-S1-D1 and S3-S2-D2) are shown. Each arrangement consisted of two S-D pairs in distances of 15 mm and 30 mm (i.e., S1-D1 and S2-D2 for 15 mm and S3-D1 and S3-D2 for 30 mm). The optodes S1 and D1 were equipped with wire grid-type optical polarizer film (WGF, AsahiKASEI E-material Corporation, Japan) in such a way that their polarization directions were orthogonal with each other. The optode D2 was also equipped with WGF in the same direction to that of D1. The optode S2 was equipped with an optical neutral density film for balancing the illumination intensity of S1. The optode S3 was equipped with neither polarizer nor ND film because the distance of 30 mm was thought to be enough to decrease the intensity of the short-circuited light. It stands on the following arguments: 1) Simply according to geometric optics, the intensity of the short-circuited light may decrease with the inverse-square of the S-D distance. In the current arrangement, only 25% of intensity at S-D distance of 15 mm can be detected at 30 mm. 2) By hairs on the scalp surface, the short-circuited light will be attenuated at higher rate against the S-D distance. 3) Part of the short-circuited light from S3 to D1 may be blocked by S2 optode because of their in-line arrangement. Consequently, the arrangement S3-S1-D1 for the proposed method and the arrangement S3-S2-D2 for the original multidistance technique were prepared and their availabilities were compared through the experiments.
Fig. 4.
(a) Photograph and (b) illustration of the implementation system. S1-S3, source optodes; D1 and D2, detector optodes. S3-S1-D1 and S3-S2-D2 were used for the proposed and original multidistance optode arrangements, respectively. Distances of far and close S-D pairs were 30 mm and 15 mm, respectively. S1 and D1 were equipped with polarizer films of orthogonal directions with each other. D2 was equipped with polarizer film so as to equalize the light intensity detected by S3-D2 with that by S3-D1. S2 was equipped with a ND filter film so as to equalize the light intensity detected by S2-D2 with that by S1-D1.
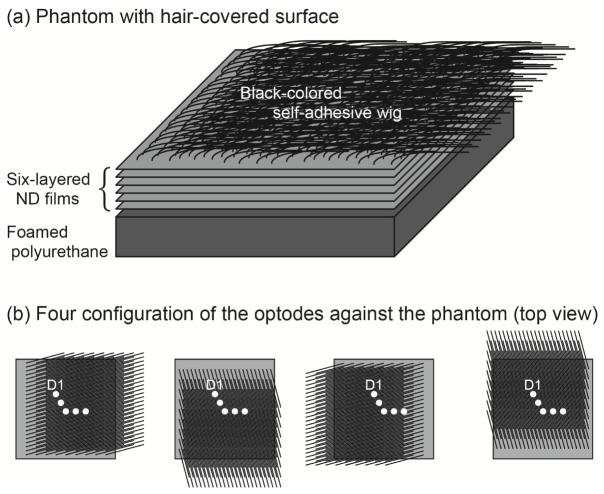
To appropriately examine the availability of the proposed method for removing motion artifacts generated by optode fluctuations, a phantom of a haired surface shown in Fig. 5(a) was prepared. A base body was made of black-colored polyurethane foam in the size of 200 mm × 200 mm × 30 mm. The polarizer, WGF indicated a transmittance of about 45% at the wavelength range utilized in this study. Using a couple of polarizers, the light intensity at S3-D1 is decreased to about 20% of that without polarizers. On the other hand, the intensity of backscattering light from the base body was significantly larger than that from human head. On balance, we could achieve an attenuation level similar to that of human head by inserting six-layered neutral density films between the optodes and main body. A self-adhesive hair wig with a hair length of approximately 150 mm (Hair Contact, Propia Co Ltd, Japan) was attached on the top surface. After the optodes were surmounted on the hair-covered phantom and held along its surface, the optodes were manually fluctuated in various directions and amplitudes during measurement. To examine the availability of the proposed method under various conditions in the polarization angle to hair direction, measurements were repeatedly performed in four conditions shown Fig. 5(b). Three or four trials of measurements for durations of approximately 60 s were performed in each condition; thus, fifteen measurement trials were conducted in total.
Fig. 5.
(a) Structure of the phantom with hair covered surface. (b) Four configurations of optodes against the phantom.
To evaluate the performance of the proposed method with the original multidistance technique, we calculated the standard deviation for each hemoglobin change, where h denotes each hemoglobin species and m denotes the S-D pair used. Then, we obtained the ratio of the standard deviation in the proposed or original multidtistanace technique to the standard deviation in the conventional fNIRS measurement; i.e., and for the proposed method and and for the original multidistance technique.
3. Results
A typical absorbance change obtained with the two couples of multidistance arrangements are shown in Fig. 6 . Concerning the usual multidistance arrangement S3-S2-D2, the and at both wavelengths (red and blue dashed lines, respectively) showed temporal changes, including spikes, baseline shifts, and drifts which are typical in motion artifacts. In addition, these motion artifacts in and at each wavelength indicated distinct differences. Similarly, in the arrangement S3-S1-D1 of the proposed method, the and at both wavelengths (red and blue solid lines, respectively) showed motion artifacts. In this case, however, the temporal changes in and at each wavelength almost entirely overlapped with each other. By thorough comparison of these absorbance changes, the spiky fluctuations appeared to concurrently occur among the cases that used different S-D pairs, but only the case S2-D2 had distinctively smaller peak heights compared to the other three cases. Also, the direction of baseline shifts in the case S2-D2 differed from that in other cases. Moreover, only the case S2-D2 showed a distinctive difference in the amplitude of baseline shifts between wavelengths of 770 nm and 840 nm. The findings described above were similarly observed in each data of the fifteen trials (each data was not shown). The reason for the tendency observed in the S2-D2 case will be discussed in a later section.
Fig. 6.
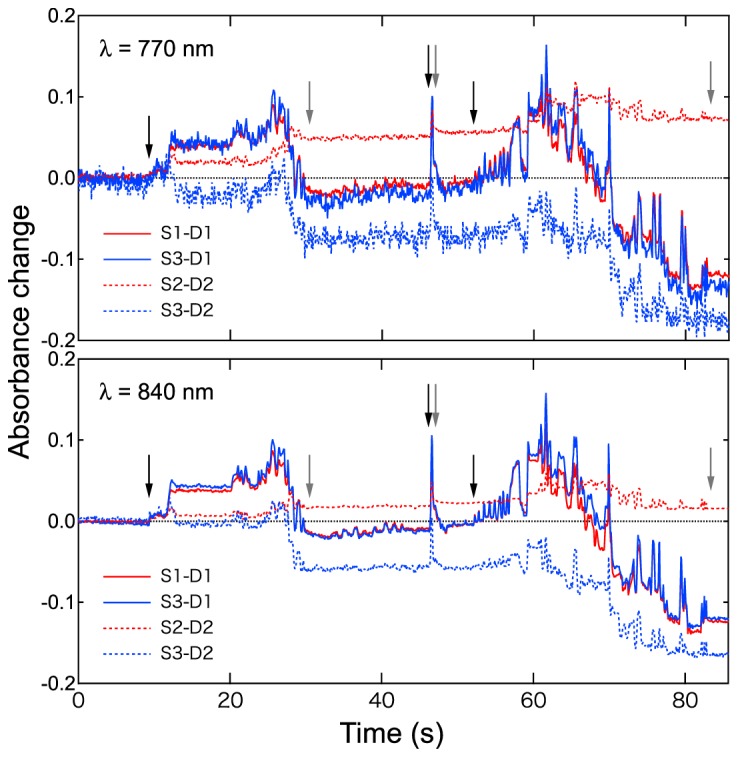
Typical absorbance changes, including motion artifacts. Lines in upper and lower frames were obtained at wavelengths of 770 nm and 840 nm, respectively. In each frame, red solid, blue solid, red dashed, and blue dashed lines were obtained with S1-D1, S3-D1, S2-D2, and S3-D2 pairs, respectively. Black and gray arrows indicate the beginning and the end of fluctuating the optodes, respectively.
To evaluate the similarities of patterns in and , we calculated Pearson correlation coefficients for each multidistance arrangement at both wavelengths. The results are shown in Fig. 7 . Although the data obtained with the usual multidistance arrangement showed broadly various correlations with trials from negative to positive at each wavelength and showed few high correlations (>0.9), almost all data obtained with the proposed method showed high correlations at both wavelengths. This strongly suggested that the proposed method stably works under various conditions in angles between the hair direction and source light polarization.
Fig. 7.
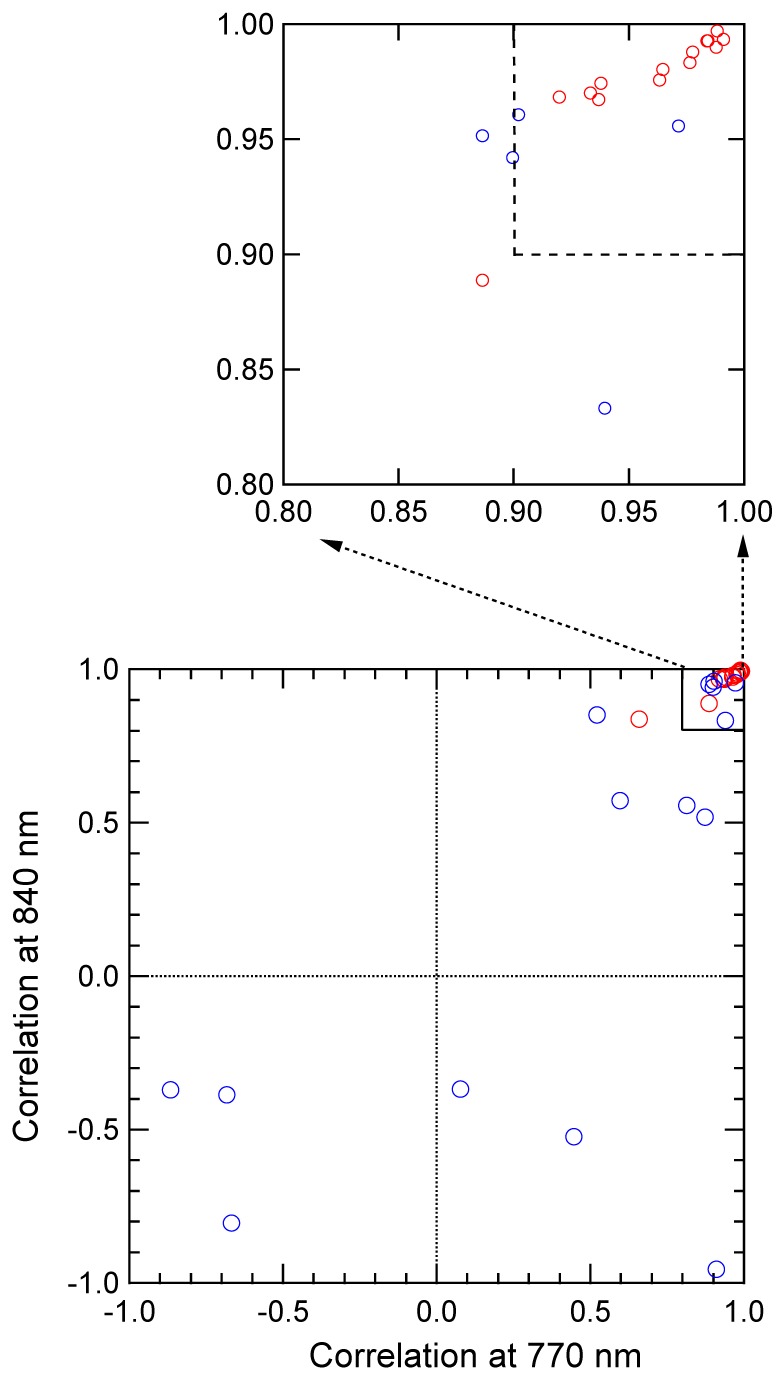
Pearson correlation coefficients of absorbance changes at distant and close S-D pairs. Red circles represent correlations in absorbance changes at S1-D1 and S3-D1. Blue circles represent those at S2-D2 and S3-D2. The region larger than 0.8 for both measurement wavelengths in the lower frame was graphically magnified and drawn in the upper frame.
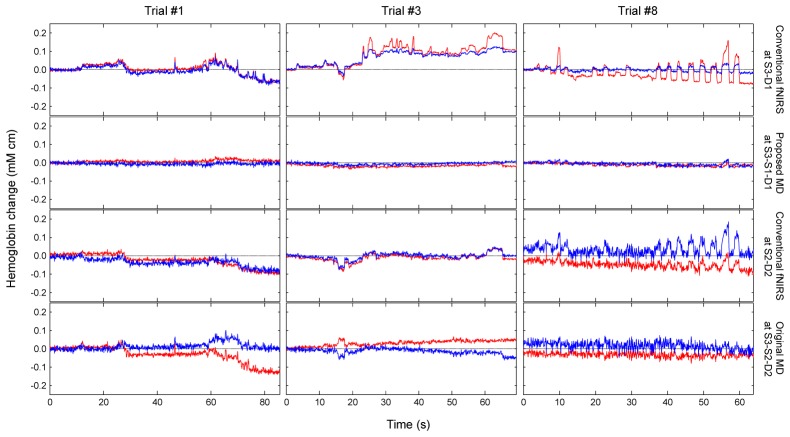
We applied the multidistance optode arrangement technique for the data obtained in experiments described above to calculate oxygenated and deoxygenated hemoglobin changes. Because the data contained no tissue hemodynamic change in the phantom experiments, baselines of oxygenated and deoxygenated hemoglobin changes were expected to be flattened if the method worked effectively. Figure 8 shows the results obtained from the data of trial #1, #3, and #8. The data of trial #1 was shown in Fig. 6. Trial #3 and #8 were the cases that indicated the best of motion artifact reduction ratios in the proposed and original multidistance techniques, respectively (see Fig. 10). The first and third frames in each column of trail indicate indicates the case of a conventional single distance fNIRS measurement, where motion artifacts caused by extraneous optode fluctuations were clearly observed. The second frame in each column shows the case of the proposed method, where baselines in each hemoglobin species were successfully flattened in each trial. The fourth frame in each column shows the case of the original multidistance technique. Comparing the case to that of the proposed method, the resulted baseline often appeared to fluctuate.Figure 9 shows the scattering plots of k values at two wavelengths calculated from each trial data. The k values obtained with the original multidistance technique scattered to a large range from negative to positive. In contrast, those obtained with the proposed method showed a distinct convergence in a range from 1 to 2. Averages of k values at wavelengths of 770 nm and 840 nm obtained with the original multidistance technique were 1.22 ± 2.66 and 1.41 ± 1.60, respectively. Those obtained with the proposed method were 1.34 ± 0.28 and 1.30 ± 0.33, respectively. Any statistical differences in average between both the factors of methods (proposed/usual) and wavelengths (770 nm/840 nm) were not found with the repeated measure ANOVA (p = 0.996 and p = 0.795, respectively). However, the standard deviations in the cases of the proposed method were clearly smaller than those in the cases of the original multidistance technique. Moreover, several cases obtained with the original multidistance technique indicated negative k values. Theoretically, k means the ratio between optical partial path lengths at two couples of S-D pairs. Hence, it should naturally be positive even if the value was estimated through any empirical method such as Eq. (5). For example, a blue-colored filled circle in Fig. 9 indicates negative k values at both wavelengths. This case of the original multidistance technique was calculated from the data shown in Fig. 6 and the resulting hemoglobin changes are shown in Fig. 8, trial #1. Comparing the fourth frame with the third frame in Fig. 8, trial #1, the sole use of the multidistance technique appeared to cause baseline fluctuations. These results suggested that the multidistance optode arrangement technique did not necessarily effectively work, but worked by combining with the short-circuited light elimination when the motion artifact generated by optode fluctuation existed. From the viewpoint of estimation error, the negative k value will be discussed in a later section. The points corresponding to the best cases of the artifact reduction ratio obtained with the proposed method (trail #3) and the original multidistance technique (trial #8) were also indicated in Fig. 9.The motion artifact reduction ratios for two different methods are shown in Fig. 10 . In most cases that used the proposed method, the artifact reduction ratios fell in the range lower than 1, whereas the cases that used the original multidistance technique scattered to a range higher than 1. The red and blue filled circles corresponds to the case shown in Fig. 6 and Fig. 8, trial #1. The points corresponding to the best cases obtained with the proposed method (trail #3) and the original multidistance technique (trial #8) were also indicated. The averages of the motion artifact reduction ratio for oxygenated and deoxygenated hemoglobin using the proposed method were 0.27 ± 0.12 and 0.45 ± 0.25, respectively. Those using the original multidistance technique were 1.11 ± 0.40 and 0.85 ± 0.37, respectively. Using the repeated measure ANOVA with the multiple comparison correction (Tukey-Kramer method), the statistical differences was observed only between the methods (proposed/original) with p values of <0.01. In various conditions of polarization angle to hair direction, artifact reduction ratios for both oxygenated and deoxygenated hemoglobin did not significantly change (p = 0.109 and p = 0.260 with the single-factor ANOVA, respectively). These findings clearly showed that the proposed method effectively worked for removing the motion artifacts, whereas the solitary use of the multidistance arrangement tended to fluctuate around the baseline under the existence of optode fluctuation.
Fig. 8.
Hemoglobin changes obtained with conventional and two multidistance fNIRS measurements. Results for each trial are indicated in individual column. In each column, results of conventional fNIRS at S3-D1, the proposed multidistance measurement at S3-S1-D1, conventional fNIRS at S3-D2, and the original multidistance measurement at S3-S2-D2 are presented in descending order. The results calculated on the basis of the data in Fig. 6 were shown in the trial #1. The trail #3 and #8 were the best cases in the motion artifact reduction with the proposed and the original multidistance measurements, respectively. The k values and the artifact reduction ratios in each case are indicated in Figs. 9 and 10, respectively.
Fig. 9.
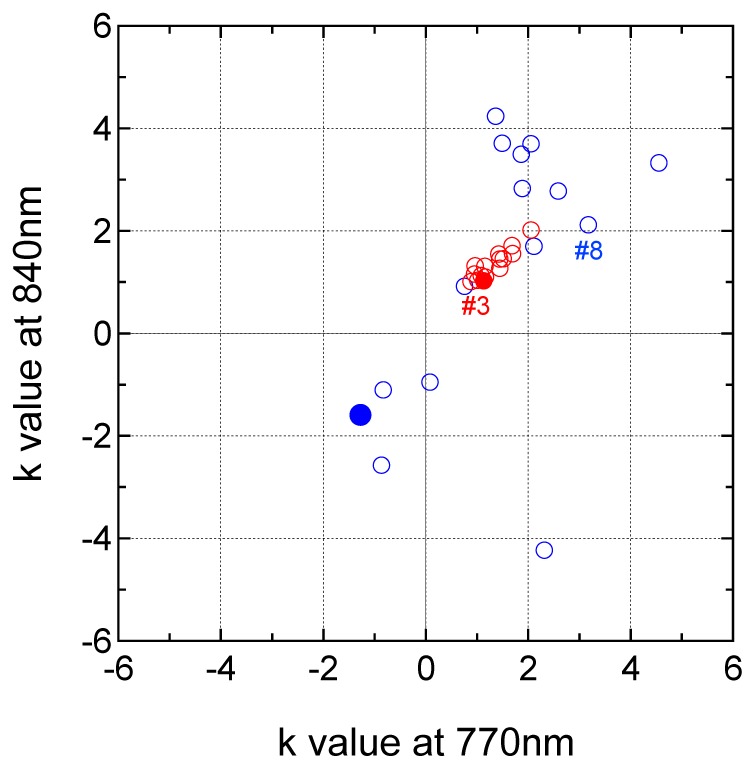
Difference in k values estimated with the proposed and original multidistance technique. Red and blue circles represent values with the arrangements S3-S1-D1 and S3-S2-D2, respectively. The filled circle in each color corresponds to the cases shown in Figs. 6 and 8. Circles of the best cases in artifact reduction used the proposed (#3) and the original (#8) multidistance measurements were indicated with colored letters, respectively.
Fig. 10.
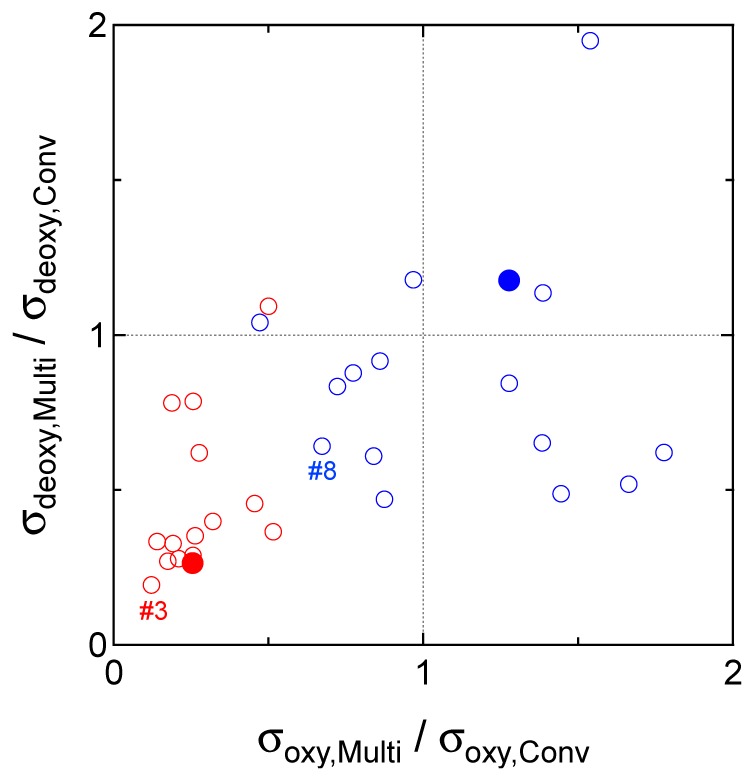
Improvement in baseline flatness evaluated by the relative reduction ratio of standard deviation in hemoglobin changes calculated with the multidistance arrangement technique. Red and blue circles represent values obtained with arrangements S3-S1-D1 and S3-S2-D2, respectively. The filled circle in each color corresponds to the cases shown in Figs. 6 and 8. Circles of the best cases in artifact reduction used the proposed (#3) and the original (#8) multidistance measurements were indicated with colored letters, respectively.
4. Discussion
As shown in Fig. 6, the baseline fluctuations in absorbance obtained with S2-D2 were distinctively smaller in amplitude than those obtained with other S-D pairs. This was similarly found in each data of the fifteen trials. The S2 was not equipped with an optical polarizer for eliminating short-circuited light, though S2 was positioned closely enough to D2 to detect the short-circuited light at the S2-D2 pair. Such a condition was observed only in the case of S2-D2. Therefore, on the basis of Eq. (1), this result could be understood as a signal-bleaching effect because of the consecutive existence of short-circuited light from source S2 to detector D2. The intensity change in at S2-D2 may have uniquely interfered with absorbance detection there, which could have induced absorbance shifts and drifts at S2-D2 in different patterns from those at other S-D pairs. In Fig. 6, the absorbance at S2-D2 showed counter-directed shifts against those observed in the other cases. The optical model formulated in Eq. (1) was essential for understanding the generation of such motion artifacts with optode fluctuations. In particular, the signal-bleaching effect observed in the S2-D2 case in Fig. 6 has never been explicitly reported in past fNIRS studies. On the other hand, researchers have understood that a closer S-D arrangement may be suitable for monitoring only the scalp blood flow [21]. Such closer S-D arrangements, however, inevitably increase if it is not eliminated by some adequate method. The detection in such condition may cause downscaling of the detected scalp blood signal and waste the monitoring data even if the data contains no motion artifacts. Therefore, the elimination of short-circuited light is crucial in techniques using closer S-D arrangements. For measuring infants in fNIRS, closer S-D arrangements compared to measurements of adults are often recommended [22]. In such cases, the possibility of the signal-bleaching effect on the measured fNIRS signal should also be considered.
In contrast, concerning the arrangement S3-S1-D1 used for the proposed method, the absorbance change at S1-D1 was similar to the absorbance change at S3-D1. This finding was also observed in each experimental trial. The S1-D1 pair was equipped with polarizers for eliminating the short-circuited light, whereas the S3-D1 pair might have had a distance large enough to decrease the short-circuited light. In addition, the phantom experiment in this study allowed the tissue transmittance to be . On the basis of these experimental conditions, the absorbance changes at S1-D1 and S3-D1 could be equated as equal to , which is the first term in Eq. (2). Therefore, the results related to the similarity in the absorbance change between S1-D1 and S3-D1 strongly suggested that at S1-D1 proportionally changed with at S3-D1. We theorize that it could be realized by the holder system used in the experiments, because its two-layered crosslinking system enabled optodes in the same arrangement to fluctuate with uniformed motion. Therefore, we noted that the optode holder system formed an important part for performing the motion artifact removal in this study.
In Fig. 6, only the amplitude in absorbance change at S2-D2 showed considerable dependency on the measurement wavelength. The absorbance and reflectance at hairs will vary with the measurement wavelength and thus will change with wavelength. On the other hand, and are not expected to change with wavelength because such transmittances of air gap have little dependency on the measurement wavelength. Therefore, the difference in amplitude in the absorbance change with two wavelengths originates from the spectroscopic nature of the hair. As a result, the error in the multidistance optode arrangement technique may increase. In Fig. 9, although the k values at two wavelengths estimated with the arrangement S3-S1-D1 showed high concordance with each other, those estimated with the arrangement S3-S2-D2 often showed considerable differences between two wavelengths. Such different k values at two wavelengths also caused baseline fluctuations in hemoglobin changes and increased the motion artifact reduction ratio in Fig. 10 as a result. The improvements with the arrangement S3-S1-D1 in Fig. 10 indicated that this problem could be effectively canceled with combined use of the short-circuited light elimination method.
As shown in Fig. 9, the k value was often estimated as a negative value in the case using arrangement S3-S2-D2. Theoretically, k refers to the ratio of optical partial path lengths in the superficial tissue layer using distant and close S-D pairs; thus, it should always result in a positive value. To review why some cases incorrectly resulted in negative k values, the negative k values at both wavelengths plotted by a blue filled circle in Fig. 9 were derived by using the arrangement S3-S2-D2 and the absorbance changes for this case are shown in Fig. 6. After reviewing the absorbance changes at S2-D2 and S3-D2, baseline drifts in opposite directions were observed at both wavelengths. In such a case that and have long term drifts in opposite directions and spikes in only small amplitudes, a negative k value can minimize the deviation of . This may be a most convincing reason why k sometimes indicates negative value. By eliminating the short-circuited light, such erroneous differences in baseline drifts also can be decreased. In fact, the cases using arrangement S3-S1-D1 showed no negative k values (see red circles in Fig. 9).
The influence of optode fluctuation, such as the first term in Eq. (6), can be ideally canceled out when k = 1 and . The k, however, depends on the optical characteristics of the observed object. Several studies have reported a k value of approximately 1 for a human head [3, 4]. In the experiment using the proposed method and phantom, k values of 1.34 ± 0.28 and 1.30 ± 0.33 were obtained at wavelengths of 770 nm and 840 nm, respectively; thus, these did not necessarily indicate the ideal value for removal of motion artifacts. However, we believe that the obtained k values effectively worked for removing motion artifacts because the values have resulted in artifact reduction ratios for oxygenated and deoxygenated hemoglobin of 0.27 ± 0.12 and 0.45 ± 0.25, respectively. For improving the baseline flatness to the equivalent level of the result, the conventional fNIRS measurement requires several experimental repetitions to perform block-averaging. The proposed method may solve such problems and result in more concise fNIRS measurements.
The size of optode aperture may be a considerable factor that changes the intensity of the short-circuited light. A larger aperture of optode may increase the detection intensity of the short-circuited light as well as that of the tissue-traveling light. The system we used in this study equipped with the optode with an aperture of 4 millimeter in diameter, which is relatively larger than those of other commercial systems. However, because the results showed a sufficient cutoff of the short-circuited light even in this case, the method will be also available for other commercial systems in so far as those use the same optode arrangement with this study.
Concerning the optode arrangement, the closer S-D pair was positioned at a distance of 15 mm in this study. There are some different understandings about the optimum distance of the closer S-D pair in the multidistance fNIRS techniques. Because the scalp tissue has considerably inhomogeneous blood vasculatures [23], an extremely localized detection of the skin blood flow using the much closer S-D pairs may cause some error. In contrast, shorter distance in the closer S-D pair assures the detection excluding the cerebral blood flow component. A recent simulation study based on anatomically informed multilayer models reported the optimum short-separation distance to be about 8 mm for human adult head [21]. Using such closer distance of 8 mm, the influence of short-circuited light on the detection at closer S-D pair will be larger comparing the case in this study, and thus cutoff of the short-circuited light will be more crucial. Availability of the proposed optical method for such cases should be studied in future.
We previously reported a study on the detection of weak and instable optode contacts [24], where an optical model of optode contact and detection noise was proposed. The model proposed in this study extended this previous model to introduce the concept of short-circuited light. However, the term representing detection noise was disregarded in this study to avoid over-complicated equations. Also, the angular fluctuation of optodes was not regarded in the model in this study. The angular fluctuation of optodes at the scalp surface may change the light pathway in tissues, and result in another artifact complexed crosstalk. Neither theoretical nor simulated studies of such possibilities on the basis of the radiation transport equation have been reported, and thus remain for future works. In the present experiment, however, the influence of angular fluctuation could be minimized. Because the phantom used in the current experiments was equipped with ND films on the surface of the main body so as to attenuate the backscattered light from it, the difference in the light pathway in the main body according to the illumination and detection angles may have little influence on the detection intensity even if it exists. Nevertheless, further experimental and theoretical studies including simulations that focus on the full issues mentioned above will provide information such as efficiency of the proposed method with various aperture sizes, S-D distances, and tilting angles of optodes. These will contribute to completely eliminate the motion artifact in fNIRS signals using various systems.
5. Conclusion
The optical model proposed in this study revealed that elimination of the short-circuited light is crucial in fNIRS measurements. The combined use of the multidistance optode arrangement technique, crosslinking optode holder system, and the short-circuited light elimination method effectively removed motion artifacts originating from optode fluctuation. Techniques and methods used in this study were relatively simple, and thus will be able to incorporate in commercial fNIRS systems. We believe that such incorporated fNIRS systems will possess the same measurement reliability while providing for simplified experiments using fNIRS.
Acknowledgment
We appreciate AsahiKASEI E-material Corporation and its distribution agent, Optical Solutions Corporation, for providing the WGF samples.
References and links
- 1.Saager R. B., Berger A. J., “Direct characterization and removal of interfering absorption trends in two-layer turbid media,” J. Opt. Soc. Am. A 22(9), 1874–1882 (2005). 10.1364/JOSAA.22.001874 [DOI] [PubMed] [Google Scholar]
- 2.Zhang Q., Brown E. N., Strangman G. E., “Adaptive filtering for global interference cancellation and real-time recovery of evoked brain activity: a Monte Carlo simulation study,” J. Biomed. Opt. 12(4), 044014 (2007). 10.1117/1.2754714 [DOI] [PubMed] [Google Scholar]
- 3.Yamada T., Umeyama S., Matsuda K., “Multidistance probe arrangement to eliminate artifacts in functional near-infrared spectroscopy,” J. Biomed. Opt. 14(6), 064034 (2009). 10.1117/1.3275469 [DOI] [PubMed] [Google Scholar]
- 4.Funane T., Atsumori H., Katura T., Obata A. N., Sato H., Tanikawa Y., Okada E., Kiguchi M., “Quantitative evaluation of deep and shallow tissue layers’ contribution to fNIRS signal using multi-distance optodes and independent component analysis,” Neuroimage 85(Pt 1), 150–165 (2014). 10.1016/j.neuroimage.2013.02.026 [DOI] [PubMed] [Google Scholar]
- 5.Zeff B. W., White B. R., Dehghani H., Schlaggar B. L., Culver J. P., “Retinotopic mapping of adult human visual cortex with high-density diffuse optical tomography,” Proc. Natl. Acad. Sci. U.S.A. 104(29), 12169–12174 (2007). 10.1073/pnas.0611266104 [DOI] [PMC free article] [PubMed] [Google Scholar]
- 6.Shimokawa T., Kosaka T., Yamashita O., Hiroe N., Amita T., Inoue Y., Sato M. A., “Hierarchical Bayesian estimation improves depth accuracy and spatial resolution of diffuse optical tomography,” Opt. Express 20(18), 20427–20446 (2012). 10.1364/OE.20.020427 [DOI] [PubMed] [Google Scholar]
- 7.Scholkmann F., Metz A. J., Wolf M., “Measuring tissue hemodynamics and oxygenation by continuous-wave functional near-infrared spectroscopy--how robust are the different calculation methods against movement artifacts?” Physiol. Meas. 35(4), 717–734 (2014). 10.1088/0967-3334/35/4/717 [DOI] [PubMed] [Google Scholar]
- 8.Scholkmann F., Spichtig S., Muehlemann T., Wolf M., “How to detect and reduce movement artifacts in near-infrared imaging using moving standard deviation and spline interpolation,” Physiol. Meas. 31(5), 649–662 (2010). 10.1088/0967-3334/31/5/004 [DOI] [PubMed] [Google Scholar]
- 9.Molavi B., Dumont G. A., “Wavelet-based motion artifact removal for functional near-infrared spectroscopy,” Physiol. Meas. 33(2), 259–270 (2012). 10.1088/0967-3334/33/2/259 [DOI] [PubMed] [Google Scholar]
- 10.Chiarelli A. M., Maclin E. L., Fabiani M., Gratton G., “A kurtosis-based wavelet algorithm for motion artifact correction of fNIRS data,” Neuroimage 112, 128–137 (2015). 10.1016/j.neuroimage.2015.02.057 [DOI] [PMC free article] [PubMed] [Google Scholar]
- 11.Barker J. W., Aarabi A., Huppert T. J., “Autoregressive model based algorithm for correcting motion and serially correlated errors in fNIRS,” Biomed. Opt. Express 4(8), 1366–1379 (2013). 10.1364/BOE.4.001366 [DOI] [PMC free article] [PubMed] [Google Scholar]
- 12.Yücel M. A., Selb J., Cooper R. J., Boas D. A., “Targeted principle component analysis: A new motion artifact correction approach for near-infrared spectroscopy,” J. Innov. Opt. Health Sci. 7(2), 1350066 (2014). 10.1142/S1793545813500661 [DOI] [PMC free article] [PubMed] [Google Scholar]
- 13.Orihuela-Espina F., Leff D. R., James D. R. C., Darzi A. W., Yang G. Z., “Quality control and assurance in functional near infrared spectroscopy (fNIRS) experimentation,” Phys. Med. Biol. 55(13), 3701–3724 (2010). 10.1088/0031-9155/55/13/009 [DOI] [PubMed] [Google Scholar]
- 14.Cooper R. J., Selb J., Gagnon L., Phillip D., Schytz H. W., Iversen H. K., Ashina M., Boas D. A., “A systematic comparison of motion artifact correction techniques for functional near-infrared spectroscopy,” Front. Neurosci. 6, 147 (2012). 10.3389/fnins.2012.00147 [DOI] [PMC free article] [PubMed] [Google Scholar]
- 15.Brigadoi S., Ceccherini L., Cutini S., Scarpa F., Scatturin P., Selb J., Gagnon L., Boas D. A., Cooper R. J., “Motion artifacts in functional near-infrared spectroscopy: A comparison of motion correction techniques applied to real cognitive data,” Neuroimage 85(Pt 1), 181–191 (2014). 10.1016/j.neuroimage.2013.04.082 [DOI] [PMC free article] [PubMed] [Google Scholar]
- 16.Virtanen J., Noponen T., Kotilahti K., Virtanen J., Ilmoniemi R. J., “Accelerometer-based method for correcting signal baseline changes caused by motion artifacts in medical near-infrared spectroscopy,” J. Biomed. Opt. 16(8), 087005 (2011). 10.1117/1.3606576 [DOI] [PubMed] [Google Scholar]
- 17.Yücel M. A., Selb J., Boas D. A., Cash S. S., Cooper R. J., “Reducing motion artifacts for long-term clinical NIRS monitoring using collodion-fixed prism-based optical fibers,” Neuroimage 85(Pt 1), 192–201 (2014). 10.1016/j.neuroimage.2013.06.054 [DOI] [PMC free article] [PubMed] [Google Scholar]
- 18.Matcher S. J., Elwell C. E., Cooper C. E., Cope M., Delpy D. T., “Performance comparison of several published tissue near-infrared spectroscopy algorithms,” Anal. Biochem. 227(1), 54–68 (1995). 10.1006/abio.1995.1252 [DOI] [PubMed] [Google Scholar]
- 19.T. Yamada, M. Ohashi, and S. Umeyama, “Development of a fiber-less fNIRS system and its aplicatinapplication to hair-covered head,” Proc. SPIE Int. Soc. Opt. Eng., 8928, 8928R (2014). [Google Scholar]
- 20.T. Yamada, S. Umeyama, and K. Matsuda, “A multidistance probe arrangement NIRS for detecting absorption changes in cerebral gray matter,” Proc. SPIE Int. Soc. Opt. Eng., 7557, 75570X (2010). [Google Scholar]
- 21.Brigadoi S., Cooper R. J., “How short is short? Optimum source-detector distance for short-separation channels in functional near-infrared spectroscopy,” Neurophotonics 2(2), 025005 (2015). 10.1117/1.NPh.2.2.025005 [DOI] [PMC free article] [PubMed] [Google Scholar]
- 22.Lloyd-Fox S., Blasi A., Elwell C. E., “Illuminating the developing brain: The past, present and future of functional near infrared spectroscopy,” Neurosci. Biobehav. Rev. 34(3), 269–284 (2010). 10.1016/j.neubiorev.2009.07.008 [DOI] [PubMed] [Google Scholar]
- 23.Kirilina E., Jelzow A., Heine A., Niessing M., Wabnitz H., Brühl R., Ittermann B., Jacobs A. M., Tachtsidis I., “The physiological origin of task-evoked systemic artefacts in functional near infrared spectroscopy,” Neuroimage 61(1), 70–81 (2012). 10.1016/j.neuroimage.2012.02.074 [DOI] [PMC free article] [PubMed] [Google Scholar]
- 24.Umeyama S., Yamada T., “Detection of an unstable and/or a weak probe contact in a multichannel functional near-infrared spectroscopy measurement,” J. Biomed. Opt. 18(4), 047003 (2013). 10.1117/1.JBO.18.4.047003 [DOI] [PubMed] [Google Scholar]


