Abstract
This article provides an overview of advanced image processing for three dimensional (3D) optical coherence tomographic (OCT) angiography of macular diseases, including age-related macular degeneration (AMD) and diabetic retinopathy (DR). A fast automated retinal layers segmentation algorithm using directional graph search was introduced to separates 3D flow data into different layers in the presence of pathologies. Intelligent manual correction methods are also systematically addressed which can be done rapidly on a single frame and then automatically propagated to full 3D volume with accuracy better than 1 pixel. Methods to visualize and analyze the abnormalities including retinal and choroidal neovascularization, retinal ischemia, and macular edema were presented to facilitate the clinical use of OCT angiography.
OCIS codes: (110.4500) Optical coherence tomography, (100.0100) Image processing, (100.2960) Image analysis, (170.4470) Ophthalmology
1. Introduction
Optical coherence tomography (OCT) provides cross-sectional and three-dimensional (3D) imaging of biological tissues, and is now a part of the standard of care in ophthalmology [1, 2]. Conventional OCT, however, is only sensitive to backscattered light intensity and is unable to directly detect blood flow and vascular abnormalities such as capillary dropout or pathologic vessel growth (neovascularization), which are the major vascular abnormalities associated with two of the leading causes of blindness, age-related macular degeneration (AMD) and proliferative diabetic retinopathy (PDR) [3]. Current techniques that visualize these abnormalities require an intravenous dye-based contrast such as fluorescein angiography (FA) or indocyanine green (ICG) angiography.
OCT angiography uses the motion of red blood cells against static tissue as intrinsic contrast. This approach eliminates the risk and reduces the time associated with dye injections [4, 5], making it more accessible for clinical use than FA or ICG. A novel 3D OCT angiography technique called split-spectrum amplitude-decorrelation angiography (SSADA) can detect motion-related amplitude-decorrelation on commercially available OCT machines. Using this algorithm, the contrast between static and non-static tissue enables visualization of blood flow, providing high resolution maps of microvascular networks in addition to the conventional structural OCT images [6, 7]. En face projection of the maximum decorrelation within anatomic layers (slabs) can produce angiograms analogous to traditional FA and ICG angiography [5, 8].
Applying SSADA-based OCT angiography, we and others have quantified vessel density and flow index [9–12], choroidal neovascularization (CNV) area [4, 13], and detected retinal neovascularization (RNV) [12, 14] and macular ischemia. Accurate segmentation is necessary for interpretation and quantification of 3D angiograms. However, in the diseased eye, pathologies such as drusen, cystoid macular edema, subretinal fluid, or pigment epithelial detachment distort the normal tissue boundaries. Such distortion increases the difficulty of automated slab boundary segmentation. Although researchers have been working on improving automated segmentation in pathological retina [15–17], there is still no fully automated method which guarantees success in all clinical cases and hence manual segmentation or correction is often required. Previously reported manual correction of segmentation is tedious and inefficient [18, 19]. In this manuscript, we provide an overview of our advanced image processing of SSADA-based OCT angiography, introduce an automated layer segmentation algorithm with expert correction, which is able to efficiently handle all clinical cases and show results of our technique applied to the processing of OCT angiograms of diseased eyes.
2. Methods
2.1 OCT angiography data acquisition
The OCT angiography data was acquired using a commercial spectral domain OCT instrument (RTVue-XR; Optovue). It has a center wavelength of 840 nm with a full-width half-maximum bandwidth of 45 nm and an axial scan rate of 70 kHz. Volumetric macular scans consisted of a 3 × 3 mm or 6 × 6 mm area with a 1.6 mm depth (304 × 304 × 512 pixels). In the fast transverse scanning direction, 304 A-scans were sampled. Two repeated B-scans were captured at a fixed position before proceeding to the next location. A total of 304 locations along a 3 mm or 6 mm distance in the slow transverse direction were sampled to form a 3D data cube. The SSADA algorithm split the spectrum into 11 sub-spectra and detected blood flow by calculating the signal amplitude-decorrelation between two consecutive B-scans of the same location. All 608 B-scans in each data cube were acquired in 2.9 seconds. Two volumetric raster scans, including one x-fast scan and one y-fast scan, were obtained and registered [20].
2.2 Overview of advanced image processing
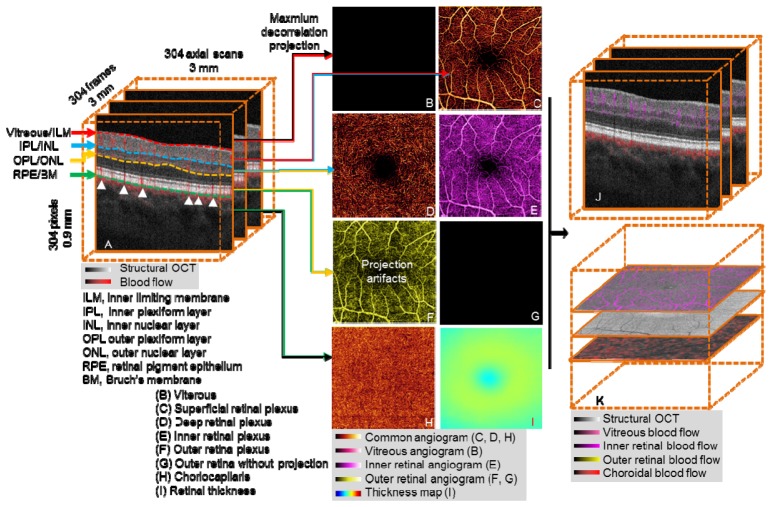
Segmentation of OCT angiography 3D flow data allows visualization and analysis of isolated vascular beds. OCT structural images provide reference boundaries for the segmentation of 3D OCT angiograms. Useful reference boundaries (Fig. 1(A) ) include, but are not limited to, the inner limiting membrane (ILM), outer boundary of the inner plexiform layer (IPL), inner nuclear layer (INL), outer boundary of the outer plexiform layer (OPL), outer nuclear layer (ONL), retinal pigment epithelium (RPE), and Bruch’s membrane (BM). Vascular layers or “slabs” are identified by two relevant tissue boundaries. For example, retinal circulation is between the boundaries Vitreous/ILM and OPL/ONL. B-scan images can be automatically segmented by a graph search technique [16, 21]. We used a conceptually simple directional graph search technique and simplified the complexity of the graph to reduce the computation time. When pathology severely disrupts normal tissue anatomy, manual correction is required. Manual correction of B-scan segmentation was propagated forward and backward across multiple B-scans, expediting image processing and reducing manpower cost. In evaluation, our approach shows good efficiency and accuracy in clinical cases.
Fig. 1.
Overview of OCT angiography image processing of a healthy macula. (A) The 3D OCT data (3 × 3 × 0.9 mm), after motion correction with structural information overlaid on angiography data. OCT angiogram is computed using the SSADA algorithm. (B-I) After segmentation of the retinal layers, 3D slabs are compressed to 2D and presented as en face maximum projection angiograms. (B) The vitreous angiogram shows the absence of flow. (C) The superficial inner retinal angiogram shows healthy retinal circulation with a small foveal avascular zone. (D) The deep inner retina angiogram shows the deep retinal plexus which is a network of fine vessels. (E) Inner retinal angiogram. (F) The healthy outer retinal slab should be absent of flow, but shows flow projection artifacts from the inner retina. (G) The outer retinal angiogram after projection removal (F minus E). (H) The choriocapillaris angiogram. (I) Retinal thickness map segmented from vitreous/ILM to RPE/BM, the color bar range is 0 to 600 μm. (J) Composite structural and angiogram B-scan images generated after removal of shadowgraphic projection. (K) Composite C-scan images generated by the flattening of OCT structural and angiogram data volume using RPE/BM.
We created composite cross-sectional OCT images by combining color-coded angiogram B-scans (flow information) superimposed on gray-scale structural B-scans (Fig. 1(A)), presenting both blood flow and retinal structure together. This provided detailed information on the depth of the microvasculature network.
OCT angiograms are generated by summarizing the maximum decorrelation within a slab encompassed by relevant anatomic layers [6]. The 3D angiogram slabs are then compressed and presented as 2D en face images so they can be more easily interpreted in a manner similar to traditional angiography techniques. Using the segmentation of the vitreous/ILM, IPL/INL, OPL/ONL, and RPE/BM, five slabs can be visualized as shown in Figs. 1(B)-1(D), 1(G) and 1(H).
2.2.1 Advanced image processing: healthy eye
In a healthy eye, the vitreous is avascular, and there is no flow above the vitreous/ILM boundary. Therefore, the en face image will appear black (Fig. 1(B)). The superficial inner retinal angiogram (between vitreous/ILM and IPL/INL) shows healthy retinal circulation with a small foveal avascular zone (Fig. 1(C)). The deep inner retina angiogram (between IPL/INL and OPL/ONL) shows the deep retinal plexus which is a network of fine vessels (Fig. 1(D)). The inner retina angiogram (Fig. 1(E)) is a combination of two superficial slabs (Fig. 1(C) and 1(D)).
Blood flow from larger inner retinal vessels casts a fluctuating shadow, inducing signal variation in deeper layers. This variation is detected as decorrelation and results in a shadowgraphic flow projection artifact. Signal characteristics alone cannot distinguish this shadowgraphic flow projection from true deep-tissue blood flow, but it can be recognized by its vertical shadow in the cross-sectional OCT angiogram (white arrows in Fig. 1(A)). A comparison of Figs. 1(F) and 1(E) reveals projection and replication of the vascular patterns from superficial slabs in the deeper layers. This is particularly evident in the outer retinal slab, where the retinal pigment epithelium (RPE) is the dominant projection surface (Fig. 1(F)). Subtracting the angiogram of the inner retina from that of the outer retina can remove this artifact, producing an outer retinal angiogram devoid of flow, as would be expected in a healthy retina (Fig. 1(G)). Flow detected in the outer retinal angiogram after removal of projection artifact is pathologic [13, 22]. The choriocapillaris angiogram (RPE/BM to 15 µm below) shows nearly confluent flow (Fig. 1(H)). Figure 1(I) shows an en face thickness map of the retina, segmented from vitreous/ILM to RPE/BM.
After removal of flow projection, the outer retinal en face angiogram (Fig. 1(G)) is then used as the reference for removing shadowgraphic flow projection on cross-sectional images. This produces composite B-scan images with color-coded flow corresponding to various slabs, without vertical shadowgraphic artifacts in the outer retina (Fig. 1(J) compared to Fig. 1(A)). Similarly, we can generate composite C-scan images. Because of the curved nature of the retina, the volume data is flattened using RPE/BM to produce flat C-scan images (Fig. 1(K)).
2.3. Layer segmentation
2.3.1 Directional graph search
Graph search is a common technique for image segmentation [23–25]. We designed a directional graph search technique for retinal layer segmentation. Since retinal layers are primarily horizontal structures on B-scan structural images, we first defined an intensity gradient in depth along the A-line, with each pixel assigned a value Gx,z, where
| (1) |
and Ix,z is the intensity of the pixel, and Ix,z-1 is the intensity of the previous pixel located within the A-line. From this, we established a gradient image by normalizing each Gx,z value with the function
| (2) |
where C(1) is a normalized value between 0 and 1, and min(G) and max(G) are the minimum and maximum G, respectively, for the entire B-scan structural image containing W columns and H rows. An example of a gradient image is displayed in Fig. 2(B) and assigns light-to-dark intensity transitions as having low C(1) values, shown here with the dark line at the NFL/GCL, IPL/INL, OPL/ONL and RPE/BM tissue boundaries.
Fig. 2.
(A) Composite OCT B-scan images with color-coded angiography. Angiography data are overlaid onto the structure images to help graders better visualize the OCT angiography images. Angiography data in the inner retina (between Vitreous/ILM and OPL/ONL) is overlaid as purple, outer retina (between OPL/ONL and IS/OS) as yellow, and choroid (below RPE) as red. (B) Gradient image showing light-to-dark intensity transitions. (C) Inverse gradient image showing dark-to-light intensity transitions.
Because retinal tissue boundaries displayed on structural OCT B-scans (Fig. 2(A)) have two types of intensity transitions (i.e. light-to-dark and dark-to-light [21]), an inverse gradient image was also generated using the function
| (3) |
thereby defining dark-to-light intensity transitions with a low C(2) value, demonstrated by the horizontal black lines in Fig. 2(C) at vitreous/ILM, IS/OS boundary, and INL/OPL.
Graph search segments an image by connecting C values with the lowest overall cost. Typically, a graph search algorithm considers all 8 surrounding neighbors when determining the next optimal connection (Fig. 3(A) ). Our directional graph search algorithm considers only 5 directional neighbors, as illustrated by the 5 dashed lines of Fig. 3(B). Because retinal layers are nearly flat, it can be assumed tissue boundaries will extend continuously across structural OCT B-scans, unlikely to reverse in direction. Since we perform the graph search directionally, starting left and extending right, the neighbor to Cx,z that is likely to have the lowest connection cost will be on the right side. Therefore, we exclude from the search the left side neighbors and the upward Cx,z-1 and downward Cx,z+1 neighbors. We can then include Cx+1,z-2 and Cx+1,z+2 positions to make our directional graph search sensitive to stark boundary changes. We assign a weight of 1 to Cx+1,z-1, Cx+1,z, and Cx+1,z+1 and a weight of 1.4 to Cx+1,z-2 and Cx+1,z+2, thus giving extra cost to curvy paths.
Fig. 3.
(A) Common graph search. (B) Directional graph search. The solid line represents a made move and dash line represent a possible move. C is the normalized gradient or normalized inverse gradient. x is the B-scan direction, between 1 and W, while z is the A-scan direction, between 1 and H.
In order to automatically detect the start point of a retinal layer boundary, the directional graph search starts from a virtual start point located outside the graph, such that all adjacent neighbors are in the first column (Fig. 3(B)). The lowest cost of connecting C values then ends at the rightmost column. This directional graph search method reduces computation complexity since fewer neighbors are considered, and therefore improves segmentation efficiency.
Automated image segmentation of retinal layers using graph search is a common practice with image processing and has been described at length in the literature [16, 21, 26–28]. Similar to previous demonstrations [18, 21], our directional graph search detects seven boundaries of interest one by one on a B-scan image (Fig. 2(A)).
The processing time for segmenting the 7 boundaries on a 304 × 512 pixel image is 330 ms (Intel(R) Xeon(R) E3-1226 @ 3.30GHz, Matlab environment).
2.3.2 Propagated 2D automated segmentation
In the clinic, OCT images often contain pathological abnormalities such as cysts, exudates, drusen, and/or layer separation. These abnormalities are difficult to account for on conventional 2D and 3D segmentation algorithms [16, 28]. Figure 4(A1) shows an example of layer segmentation attracted to strong reflectors, exudates in this case. Our propagated 2D automated segmentation takes into consideration the segmentation result of the previous B-scan, assuming that boundaries do not change much in adjacent B-scans. Specifically, it first segments a B-scan frame with relatively few pathological structures, which is chosen by the user. To segment the remaining B-scans using directional graph search, we further confine the boundary to be within a range that is 15 µm above and below the same boundary in the previous B-scan frame. The segmentation is propagated to the rest of the volume frame by frame. Figure 4(A2) shows the propagated automated segmentation provides accurate segmentation even in tissue disrupted by exudates.
Fig. 4.
Comparison of performance on pathologic tissue using 2D automated segmentation (A1, B1), and propagated 2D automated segmentation (A2, B2). En face images B1 and B2 maps the position of the OPL/ONL boundary of A1 and A2. Red arrows in A1 and A2 point to the segmentation differences. The colorbar of B1 and B2 is the same as Fig. 1(I).
The en face images Fig. 4(B1) and 4(B2) map the distance between the segmented OPL/ONL position and the bottom of the image, with each horizontal line corresponding to a B-scan frame. The conventional 2D algorithm (Fig. 4(B1)) shows segmentation errors, while an accurate segmentation from propagated 2D algorithm generates a continuous map (Fig. 4(B2)). This map facilitates monitoring and identification of possible segmentation errors.
2.3.3 Propagated 2D automated segmentation with intelligent manual correction
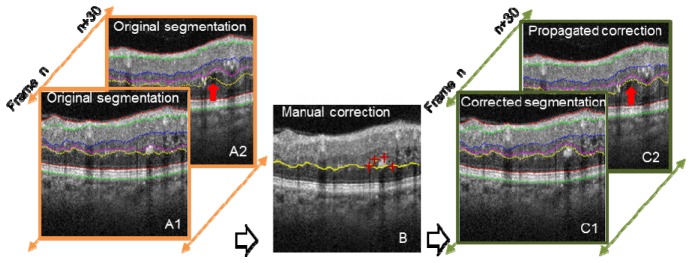
When propagated 2D automated segmentation fails, expert manual correction is required. In the manual correction mode, the user pinpoints several landmark positions with red crosses (Fig. 5(B) , 4 red crosses). An optimal path through these landmarks is automatically determined using directional graph search. After manual corrections are made on B-scans within a volume, the corrected boundary curve is propagated to adjacent frames. For example, in Fig. 5, only frame n was manually corrected, and the manual correction successfully propagated to frame n + 30, as shown in Fig. 5 (propagated correction), identified by the red arrow.
Fig. 5.
Illustration of 2D automated segmentation with and without intelligent manual correction. Manual correction (middle image, red crosses) was performed on frame n, and the correction propagated to frame n + 30. Red arrows identify the segmentation differences.
2.3.4 Semi-automatic segmentation
For cases where the retina is highly deformed and the automated segmentation completely fails, we devised a semi-automatic segmentation method. Similar to intelligent scissors [23], while the users moves the cursor along the boundary path, directional graph search is applied and displayed locally in real time (Fig. 6(A) ).
Fig. 6.
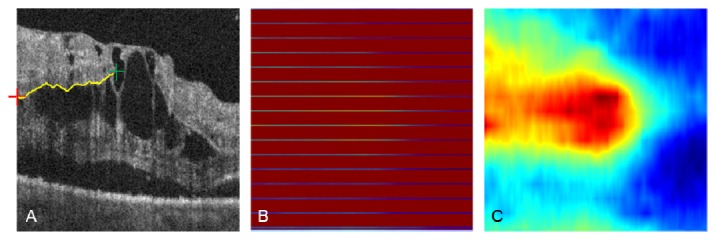
(A) Interactive manual segmentation with intelligent scissors, showing a live segmentation of OPL/ONL when the mouse click at the red cross, setting the start point and moves to the green cross. (B) En face depth map with segmentation performed every 20 frames. (C) En face depth map after interpolation of (B).
2.3.5 Interpolation mode
Automated/manual segmentation can also be applied at regular intervals (Fig. 6(B)), followed by interpolation across the entire volume. This greatly reduces the segmentation workload while maintaining reasonable accuracy. The frame interval for manual segmentation is determined according to the variation among B-scan frames, usually 10 to 20 for 3 × 3 mm scans and 5 to 10 for 6 × 6 mm scans. This provides a balance between segmentation accuracy and required manual segmentation workload.
2.3.6 Volume flattening
On 6 × 6 mm images, the automated segmentation using directional graph search may fail due to significant tissue curvature, as we will show in the result section (Fig. 9(A), inside the yellow box). A flattening procedure was utilized to solve this problem (Fig. 7 ). We first found the center of mass (pixel intensity) of each A-scan, represented as blue dots in Figs. 7(B1) and 7(C1). We then fitted a polynomial plane to these centers of mass. A shift along the depth (z) was performed to transform the volume, so that the curved plane transformed to a flat plane (Fig. 7(B2)), flattening the curved volume (compare Figs. 7(A1) and 7(A2)). By using the center of mass instead of an anatomic tissue plane, the volume flattening procedure is not subject to boundary distortion caused by pathology. Note that this volume flattening procedure is only used to aid the segmentation. For visualization, the volume is flattened using the RPE/BM boundary after segmentation.
Fig. 7.
Rendering of the 6 × 6 × 1.6 mm OCT retinal volume data, (A1) original, and (A2) flattened. In (B1) (B2) (C1) (C2), each blue dot represents the A-scan center of mass. The colored curved plane in (B1) shows the fitted center of mass plane, which can be thought of as an estimate of the retinal shape. In (B2), the curved plane is flattened. (C1) and (C2) are B-scan frames with the A-scan center of mass overlaid.
2.3.7 Standard procedure
As a first step, volume flattening is performed on and only on 6 × 6 mm scans (2.3.6). The user then chooses a frame with few pathological structures, runs 2D automated segmentation (2.3.2), and corrects segmentation errors by providing several key points (2.3.3) or using semi-automatic segmentation (2.3.4). Propagated 2D automated segmentation (2.3.3) then segments the rest of the frames. If the user observes a segmentation error, he or she performs manual correction and then rerun the propagation. In rare cases when propagation fails to correct errors, the user can manually segment selected frames and perform interpolation (2.3.5). It should be noted that often the user only needs to use interpolation to segment one or two of the boundaries, and automatic segmentation is able to work out the rest of the boundaries. Segmentation is always performed under the supervision of the user to minimize errors.
3. Results and discussion
3.1 Study population
We systematically tested our segmentation technique in eyes with DR and AMD. In the DR study, 5 normal cases, 10 non-proliferative DR (NPDR), and 10 proliferative DR (PDR) were studied. The layers of interest for segmentation include vitreous/ILM, IPL/INL, OPL/ONL, RPE/BM. In the AMD study, 4 normal, 4 dry AMD and 4 wet AMD eyes were examined. The layers of interest for segmentation included vitreous/ILM, OPL/ONL, IS/OS, RPE/BM. Table 1 summarizes the average number of layers corrected and processing time.
Table 1. Average time for processing different clinical cases.
| Case | # of subjects | Average # of boundaries corrected
|
Average time (mins) | ||||
|---|---|---|---|---|---|---|---|
| Vitreous/ILM | IPL/INL | OPL/ONL | RPE/BM | ||||
| DR
|
Normal
|
5
|
0
|
0
|
<1
|
0
|
2
|
| NPDR w/o edema
|
5
|
0
|
<1
|
2
|
0
|
3
|
|
| NPDR w/ edema
|
5
|
0
|
3
|
4
|
0
|
5
|
|
| PDR w/o edema
|
5
|
0
|
2
|
2
|
0
|
3
|
|
| PDR w/ edemaa
|
5
|
<1
|
6
|
11
|
0
|
10
|
|
|
|
Vitreous/ILM
|
OPL/ONL
|
IS/OS
|
RPE/BM
|
|
||
| AMD | Normal
|
4
|
0
|
<1
|
0
|
0
|
2
|
| Dry AMD
|
4
|
0
|
2
|
4
|
2
|
6
|
|
| Wet AMD | 4 | 0 | 3 | 13 | 6 | 12 | |
a 1 case was segmented using the interpolation mode with 20 frames interval.
3.2 Layer segmentation performance
3.2.1 Automated segmentation of pathology
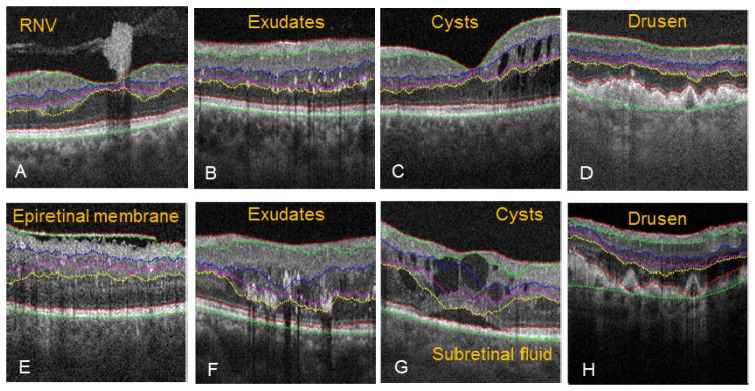
The 2D automated algorithm correctly segmented the tissue boundaries despite disruption caused from RNV (Fig. 8(A) ), small exudates (Fig. 8(B)), small intraretinal cysts (Fig. 8(C)), or drusen with strong boundary (Fig. 8(D)). However, the algorithm failed in some severe pathological cases. During segmentation of epiretinal membrane (Fig. 8(E)), the NFL/GCL boundary was assigned to the epiretinal membrane, causing an upshift in the search region, and therefore incorrect segmentation for IPL/INL, INL/OPL, and OPL/ONL. Large exudates (Fig. 8(F)) distorted the OPL/ONL boundary and caused incorrect segmentation of NFL/GCL, IPL/INL, and INL/OPL. Also, large exudates where shown to cast a shadow artifact extending past the IS/OS boundary. Subretinal fluid and large intraretinal cysts (Fig. 8(G)) disrupted the IS/OS and OPL/ONL boundary, and as result, the NFL/GCL, IPL/INL and INL/OPL were also segmented incorrectly. Drusen with weak boundary intensity (Fig. 8(H)) caused the segmentation of the IS/OS and RPE to not accurately follow the more elevated drusens, and as a consequence, NFL/GCL, IPL/INL, and INL/OPL were also segmented incorrectly. In these cases, propagated 2D automated segmentation with intelligent manual correction was applied. And in rare cases, interpolation mode was used (e.g. IPL/INL and OPL/ONL in Fig. 11, PDR with edema).
Fig. 8.
Pathological cases where automated segmentation was accurate (A-D), and severe pathology cases where the automated segmentation contained errors (E-H).
3.2.2 Segmentation processing time and accuracy
During segmentation, we recorded the number of manual corrections made on each type of boundary for both DR and AMD. The average number of manual corrections is given in Table 1. The automated segmentation of vitreous/ILM was highly accurate in DR and AMD cases. In severe DR cases, edema sometimes caused tissue boundaries to be located outside of the searching regions, and therefore required manual corrections of both the IPL/INL and OPL/ONL boundaries. Similarly, AMD with large drusen caused segmentation failure of OPL/ONL and IS/OS. RPE/BM needed to be manually corrected in AMD cases where the boundary became unclear. In general, an increase in severity of either DR or AMD required a longer average processing time. Compared to a purely manual segmentation approach (typically taking 3-4h to complete [19],), our intelligent manual correction method efficiently segmented tissue boundaries in eyes with DR and AMD, only taking 15 minutes to complete, including the most difficult case.
To evaluate segmentation accuracy, we compared the results of manual segmentation (using intelligent scissors) with those from our propagated automated segmentation with manual correction. For each case, 2 subjects were randomly chosen and 20 B-scans were randomly selected for evaluation. Three graders independently performed manual segmentation of each tissue boundary, with the help of intelligent scissors. The manually segmented boundaries were averaged among the three graders and taken as gold standard. The absolute errors of our propagated automated segmentation with manual correction was determined (mean ± std in unit of pixels). The result is given in Table 2 . In more than 62% of images, the segmentation error is less than 1 pixels (3.1 µm).
Table 2. Segmentation accuracy of different clinical cases.
| Case | Mean ± Std(pixels)
|
||||
|---|---|---|---|---|---|
| Vitreous/ILM | IPL/INL | OPL/ONL | RPE/BM | ||
| DR
|
Normal
|
0.25 ± 0.08
|
0.97 ± 0.64
|
0.13 ± 0.12
|
0.26 ± 0.09
|
| NPDR w/o edema
|
0.04 ± 0.03
|
0.29 ± 0.30
|
0.13 ± 0.23
|
0.16 ± 0.19
|
|
| NPDR w/ edema
|
0.04 ± 0.03
|
0.70 ± 0.98
|
2.85 ± 4.05
|
0.14 ± 0.18
|
|
| PDR w/o edema
|
0.06 ± 0.08
|
0.32 ± 0.50
|
1.60 ± 1.84
|
0.08 ± 0.08
|
|
| PDR w/ edema*
|
0.25 ± 0.45
|
3.23 ± 1.98
|
5.28 ± 3.72
|
1.37 ± 1.82
|
|
|
|
Vitreous/ILM
|
OPL/ONL
|
IS/OS
|
RPE/BM
|
|
| AMD | Normal
|
0.25 ± 0.08
|
0.13 ± 0.12
|
0.21 ± 0.05
|
0.26 ± 0.09
|
| Dry AMD
|
0.02 ± 0.02
|
1.45 ± 2.96
|
0.31 ± 0.57
|
0.51 ± 0.88
|
|
| Wet AMD | 0.03 ± 0.03 | 0.97 ± 1.6 | 0.26 ± 0.58 | 0.91 ± 1.02 | |
3.2.3. Volume flattening
The aforementioned volume flattening procedure was able to solve stark curvature segmentation errors. The yellow box in Fig. 9(A) demonstrates segmentation failure at multiple tissue boundaries in an area of stark curvature. By flattening the volumetric data, our automated segmentation algorithm was able to accurately segment all seven tissue boundaries inside the yellow box as shown in Fig. 9(B). When the image was restored to its original curvature, the corrected segmentation remained (Fig. 9(C)). This automated volume flattening allows for efficient image processing of large area OCT scans (e.g. 6 × 6 mm).
Fig. 9.
(A) Segmentation failure in a 6 × 6 mm image with stark curvature. Note the segmentation error inside the yellow box, and a zoom in is provided at the right side. (B) Corrected segmentation done on the flatten image. (C) Recovered image and segmentation from (B).
3.3 Advanced image processing: clinical applications
3.3.1 Age related macular degeneration (3 × 3 mm scans)
CNV, which is the pathologic feature of wet AMD, occurs when abnormal vessels grow from the choriocapillaris and penetrate Bruch’s membrane into the outer retinal space [13]. Detection of CNV depends on the segmentation of three reference planes (Vitreous/ILM, OPL/ONL, and RPE/BM) used to generate three slabs: inner retina, outer retina, and choriocapillaris.
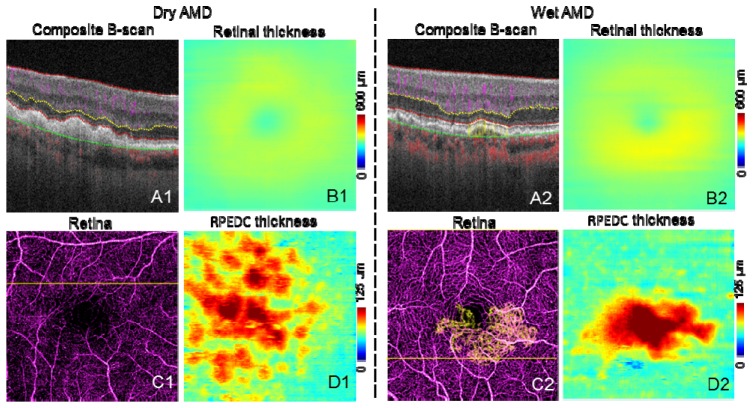
Figure 10 shows representative images of dry and wet AMD cases. Structural information from the OCT angiography scans was used to create retinal thickness (Figs. 10(B1) and 10(B2)) and RPE-drusen complex (RPEDC) maps (Figs. 10(D1) and 10(D2), distance between IS/OS and RPE/BM). The retinal thickness map is clinically useful in determining atrophy and exudation. The RPEDC map, representing the size and the volume of drusen, has been correlated with risk of clinical progression [29].
Fig. 10.
Representative images of AMD cases. The scan size is 3 × 3 mm. A are the composite B-scans. C are the composite en face angiogram of inner retina (purple) and outer retina (yellow). In C2, CNV can be seen as yellow vessels, the CNV area is 0.88 mm2. B are the retinal thickness maps. D are the RPEDC thickness (distance between IS/OS and RPE/BM) maps.
Because of shadowgraphic flow projection, true CNV is difficult to identify in both the composite B-scan and en face angiogram. We used an previously published automated CNV detection algorithm to removed projection from the outer retinal [22]. A composite en face angiogram displaying the two retinal slabs in different colors shows the CNV in relation to the retinal angiogram (Figs. 10(C2) and 12(A1)). An overlay of this composite angiogram on the cross-sectional angiogram shows the depth of the CNV in relation to retinal structures (Fig. 10(A2)). The size of CNV can be quantified by calculating the area of the vessel in the outer retinal slab.
3.3.2 Diabetic retinopathy (3 × 3 mm scans)
RNV, or growth of new vessels above the ILM, is the hallmark of proliferative diabetic retinopathy (PDR). The presence of RNV is associated with high risk of vision loss and is an indication for treatment with panretinal photocoagulation, which reduces the risk of vision loss [30].
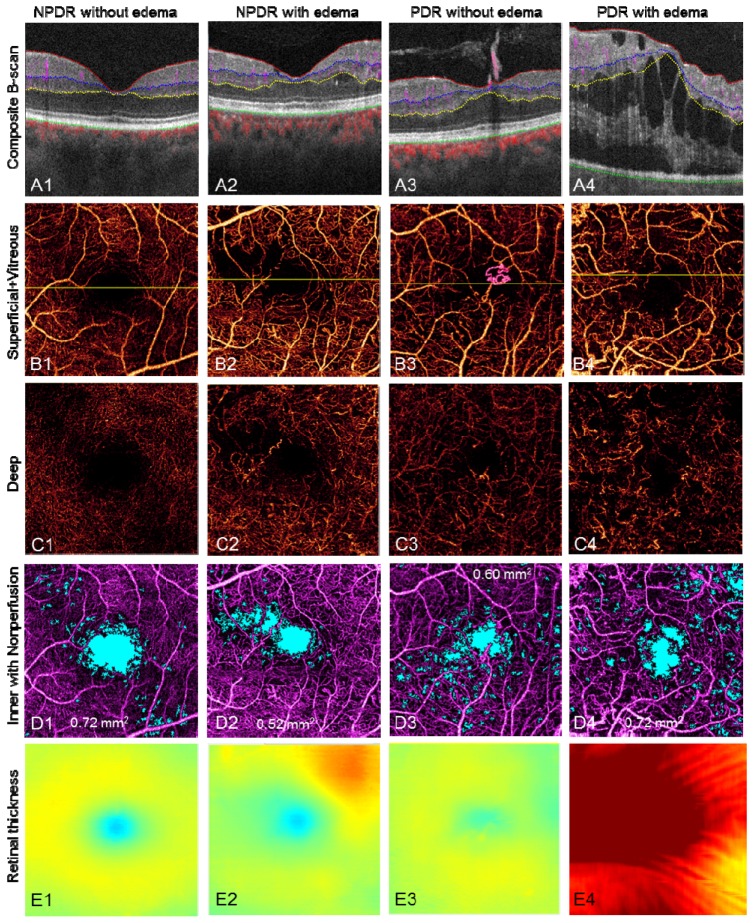
Segmenting along the vitreous/ILM border reveals the RNV in the vitreous slab, distinguishing it from intra-retinal microvascular abnormalities (IRMA), which can be difficult to distinguish clinically from early RNV (Fig. 11 , case 3, PDR without edema and Fig. 12(A2) ). By quantifying the RNV area, one can assess the extent and activity of PDR.
Fig. 11.
Representative results of DR cases. The scan size is 3 × 3 mm. (Row A) Edema, cyst, extrudes, RNV, and blood flow in different layers can be visualized on the composite B-scan images. (Row B) The composite en face angiogram of superficial inner retina and vitreous, where the RNV can be easily seen as pink vessels. The yellow line in row B marks the position of the B-scan slices in row A. (Row C) The angiogram of the deep inner retina. The vascular network is different from the superficial inner retina, although there are projection artifacts from the superficial inner retina. (Row D) shows the angiogram of inner retina with nonperfusion areas marked in light blue. The nonperfusion areas are 0.72 mm2, 0.52 mm2, 0.60 mm2, and 0.72 mm2, respectively. (Row E) The retinal thickness, i.e. the distance from Vitreous/ILM to RPE/BM. The color map is the same as in Fig. 1(I).
Fig. 12.
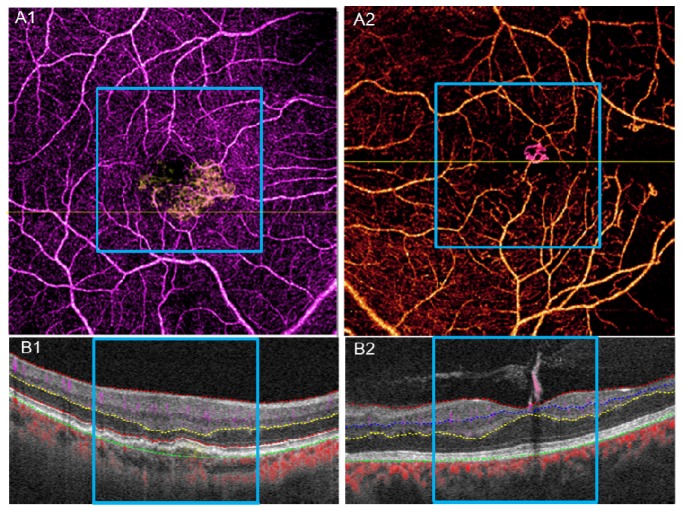
A1, B1, results of 6 × 6 mm scan for the wet AMD case in Fig. 10. A2, B2, results of 6 × 6 mm scan for the PDR without edema case in Fig. 11. The blue square marks the 3 × 3 mm range corresponding to Fig. 10 and Fig. 11.
Figure 11 shows representative images of DR. The first row shows color-coded B-scans without flow projection artifacts and the boundaries for en face projection. Presenting the structural and flow information simultaneously clarifies the anatomic relationship between vessels and tissue planes. En face composite angiograms of the superficial and deep plexus (second and third rows, respectively) disclose vascular abnormalities including RNV, IRMA, thickening/narrowing of vessels, and capillary dropout as with typical dye-based angiography.
Capillary nonperfusion is a major feature of DR that is associated with vision loss and progression of disease [31, 32]. Using an automated algorithm, we identified and quantified capillary nonperfusion [4, 13] and created a nonperfusion map (Fig. 11(D)) showing blue areas with flow signal lower than 1.2 standard deviations above the mean decorrelation signal in the foveal avascular zone. Assessing the distance from vitreous/ILM to RPE/BM across the volume scan created the retinal thickness map (Fig. 11(E)). This allows the clinician to assess the central macula for edema, atrophy, and distortion of contour.
3.3.3 Clinical evaluation of 6 × 6 mm scans
The pathology in AMD and DR can extend beyond the central macular area. While OCT angiography cannot match the field of view of the current dye-based widefield techniques [33, 34], 6 × 6 mm OCT angiography scans cover a wider area and can reveal pathology not shown in 3 × 3 mm scans. Figures 12(A1) and 12(A2) show examples of 6 × 6 mm scans of the wet AMD case in Fig. 10 and PDR without edema case seen in Fig. 11, respectively. Although these scans are of lower resolution, 6 × 6 mm scans captured areas of capillary nonperfusion not present in the 3 × 3 mm scan area (black areas outside of the blue square).
4. Conclusion
We have described in detail advanced image processing for OCT angiography quantification and visualization. Our proposed segmentation method shows good accuracy and efficiency in clinical applications. In the current phase of development, segmentation still requires manual correction in a minority of cases, but its frequency and associated workload has been highly reduced with techniques such as semi-automatic segmentation, propagated manual corrections, and interpolation as compared to previous reports [18, 19]. We also showed innovative ways of visualizing OCT angiography data including composite B-scan images and composite en face angiograms. Integration of these methods into commercial OCT angiography instruments can potentially improve the utility and diagnostic accuracy of OCT angiography.
Acknowledgments
This work was supported by NIH grants DP3 DK104397, R01 EY024544, R01 EY023285, P30-EY010572, T32 EY23211; CTSA grant UL1TR000128; and an unrestricted grant from Research to Prevent Blindness. Financial interests: Yali Jia and David Huang have a significant financial interest in Optovue. David Huang also has a financial interest in Carl Zeiss Meditec. These potential conflicts of interest have been reviewed and managed by Oregon Health & Science University.
References and links
- 1.Huang D., Jia Y., Gao S. S., “Principles of Optical Coherence Tomography Angiography” in OCT Angiography Atlas Lumbros H. D., Rosenfield B., Chen P., Rispoli C., Romano M., eds. (Jaypee Brothers Medical Publishers, New Delhi, 2015). [Google Scholar]
- 2.Huang D., Swanson E. A., Lin C. P., Schuman J. S., Stinson W. G., Chang W., Hee M. R., Flotte T., Gregory K., Puliafito C. A., Fujimoto J., “Optical coherence tomography,” Science 254(5035), 1178–1181 (1991). 10.1126/science.1957169 [DOI] [PMC free article] [PubMed] [Google Scholar]
- 3.Congdon N., O’Colmain B., Klaver C. C., Klein R., Muñoz B., Friedman D. S., Kempen J., Taylor H. R., Mitchell P., Eye Diseases Prevalence Research Group , “Causes and prevalence of visual impairment among adults in the United States,” Arch. Ophthalmol. 122(4), 477–485 (2004). 10.1001/archopht.122.4.477 [DOI] [PubMed] [Google Scholar]
- 4.Jia Y., Bailey S. T., Hwang T. S., McClintic S. M., Gao S. S., Pennesi M. E., Flaxel C. J., Lauer A. K., Wilson D. J., Hornegger J., Fujimoto J. G., Huang D., “Quantitative optical coherence tomography angiography of vascular abnormalities in the living human eye,” Proc. Natl. Acad. Sci. U.S.A. 112(18), E2395–E2402 (2015). 10.1073/pnas.1500185112 [DOI] [PMC free article] [PubMed] [Google Scholar]
- 5.López-Sáez M. P., Ordoqui E., Tornero P., Baeza A., Sainza T., Zubeldia J. M., Baeza M. L., “Fluorescein-induced allergic reaction,” Ann. Allergy Asthma Immunol. 81(5), 428–430 (1998). 10.1016/S1081-1206(10)63140-7 [DOI] [PubMed] [Google Scholar]
- 6.Jia Y., Tan O., Tokayer J., Potsaid B., Wang Y., Liu J. J., Kraus M. F., Subhash H., Fujimoto J. G., Hornegger J., Huang D., “Split-spectrum amplitude-decorrelation angiography with optical coherence tomography,” Opt. Express 20(4), 4710–4725 (2012). 10.1364/OE.20.004710 [DOI] [PMC free article] [PubMed] [Google Scholar]
- 7.Gao S. S., Liu G., Huang D., Jia Y., “Optimization of the split-spectrum amplitude-decorrelation angiography algorithm on a spectral optical coherence tomography system,” Opt. Lett. 40(10), 2305–2308 (2015). 10.1364/OL.40.002305 [DOI] [PMC free article] [PubMed] [Google Scholar]
- 8.Wang R. K., Jacques S. L., Ma Z., Hurst S., Hanson S. R., Gruber A., “Three dimensional optical angiography,” Opt. Express 15(7), 4083–4097 (2007). 10.1364/OE.15.004083 [DOI] [PubMed] [Google Scholar]
- 9.Liu L., Jia Y., Takusagawa H. L., Pechauer A. D., Edmunds B., Lombardi L., Davis E., Morrison J. C., Huang D., “Optical coherence tomography angiography of the peripapillary retina in glaucoma,” JAMA Ophthalmol. 133(9), 1045–1052 (2015). 10.1001/jamaophthalmol.2015.2225 [DOI] [PMC free article] [PubMed] [Google Scholar]
- 10.Jia Y., Wei E., Wang X., Zhang X., Morrison J. C., Parikh M., Lombardi L. H., Gattey D. M., Armour R. L., Edmunds B., Kraus M. F., Fujimoto J. G., Huang D., “Optical Coherence Tomography Angiography of Optic Disc Perfusion in Glaucoma,” Ophthalmology 121(7), 1322–1332 (2014). 10.1016/j.ophtha.2014.01.021 [DOI] [PMC free article] [PubMed] [Google Scholar]
- 11.Pechauer A. D., Jia Y., Liu L., Gao S. S., Jiang C., Huang D., “Optical Coherence Tomography Angiography of Peripapillary Retinal Blood Flow Response to Hyperoxia,” Invest. Ophthalmol. Vis. Sci. 56(5), 3287–3291 (2015). 10.1167/iovs.15-16655 [DOI] [PMC free article] [PubMed] [Google Scholar]
- 12.Ishibazawa A., Nagaoka T., Takahashi A., Omae T., Tani T., Sogawa K., Yokota H., Yoshida A., “Optical Coherence Tomography Angiography in Diabetic Retinopathy: A Prospective Pilot Study,” Am. J. Ophthalmol. 160(1), 35–44 (2015). 10.1016/j.ajo.2015.04.021 [DOI] [PubMed] [Google Scholar]
- 13.Jia Y., Bailey S. T., Wilson D. J., Tan O., Klein M. L., Flaxel C. J., Potsaid B., Liu J. J., Lu C. D., Kraus M. F., Fujimoto J. G., Huang D., “Quantitative optical coherence tomography angiography of choroidal neovascularization in age-related macular degeneration,” Ophthalmology 121(7), 1435–1444 (2014). 10.1016/j.ophtha.2014.01.034 [DOI] [PMC free article] [PubMed] [Google Scholar]
- 14.Hwang T. S., Jia Y., Gao S. S., Bailey S. T., Lauer A. K., Flaxel C. J., Wilson D. J., Huang D., “Optical Coherence Tomography Angiography Features of Diabetic Retinopathy,” Retina 35(11), 2371–2376 (2015). 10.1097/IAE.0000000000000716 [DOI] [PMC free article] [PubMed] [Google Scholar]
- 15.Chiu S. J., Izatt J. A., O’Connell R. V., Winter K. P., Toth C. A., Farsiu S., “Validated Automatic Segmentation of AMD Pathology Including Drusen and Geographic Atrophy in SD-OCT Images,” Invest. Ophthalmol. Vis. Sci. 53(1), 53–61 (2012). 10.1167/iovs.11-7640 [DOI] [PubMed] [Google Scholar]
- 16.Srinivasan P. P., Heflin S. J., Izatt J. A., Arshavsky V. Y., Farsiu S., “Automatic segmentation of up to ten layer boundaries in SD-OCT images of the mouse retina with and without missing layers due to pathology,” Biomed. Opt. Express 5(2), 348–365 (2014). 10.1364/BOE.5.000348 [DOI] [PMC free article] [PubMed] [Google Scholar]
- 17.Chiu S. J., Allingham M. J., Mettu P. S., Cousins S. W., Izatt J. A., Farsiu S., “Kernel regression based segmentation of optical coherence tomography images with diabetic macular edema,” Biomed. Opt. Express 6(4), 1172–1194 (2015). 10.1364/BOE.6.001172 [DOI] [PMC free article] [PubMed] [Google Scholar]
- 18.Teng P., “Caserel - An Open Source Software for Computer-aided Segmentation of Retinal Layers in Optical Coherence Tomography Images,” (2013).
- 19.Yin X., Chao J. R., Wang R. K., “User-guided segmentation for volumetric retinal optical coherence tomography images,” J. Biomed. Opt. 19(8), 086020 (2014). 10.1117/1.JBO.19.8.086020 [DOI] [PMC free article] [PubMed] [Google Scholar]
- 20.Kraus M. F., Potsaid B., Mayer M. A., Bock R., Baumann B., Liu J. J., Hornegger J., Fujimoto J. G., “Motion correction in optical coherence tomography volumes on a per A-scan basis using orthogonal scan patterns,” Biomed. Opt. Express 3(6), 1182–1199 (2012). 10.1364/BOE.3.001182 [DOI] [PMC free article] [PubMed] [Google Scholar]
- 21.Chiu S. J., Li X. T., Nicholas P., Toth C. A., Izatt J. A., Farsiu S., “Automatic segmentation of seven retinal layers in SDOCT images congruent with expert manual segmentation,” Opt. Express 18(18), 19413–19428 (2010). 10.1364/OE.18.019413 [DOI] [PMC free article] [PubMed] [Google Scholar]
- 22.Liu L., Gao S. S., Bailey S. T., Huang D., Li D., Jia Y., “Automated choroidal neovascularization detection algorithm for optical coherence tomography angiography,” Biomed. Opt. Express 6(9), 3564–3576 (2015). 10.1364/BOE.6.003564 [DOI] [PMC free article] [PubMed] [Google Scholar]
- 23.Mortensen E. N., Barrett W. A., “Intelligent scissors for image composition,” in Proceedings of the 22nd annual conference on Computer graphics and interactive techniques, (ACM, 1995), pp. 191–198. [Google Scholar]
- 24.Pope D., Parker D., Gustafson D., Clayton P., “Dynamic search algorithms in left ventricular border recognition and analysis of coronary arteries,” in IEEE Proceedings of Computers in Cardiology, 1984), 71–75. [Google Scholar]
- 25.Liu X., Chen D. Z., Tawhai M. H., Wu X., Hoffman E. A., Sonka M., “Optimal Graph Search Based Segmentation of Airway Tree Double Surfaces Across Bifurcations,” IEEE Trans. Med. Imaging 32(3), 493–510 (2013). 10.1109/TMI.2012.2223760 [DOI] [PMC free article] [PubMed] [Google Scholar]
- 26.Merickel M. B., Jr., Abràmoff M. D., Sonka M., Wu X., “Segmentation of the optic nerve head combining pixel classification and graph search,” in Medical Imaging, (International Society for Optics and Photonics, 2007), 651215. [Google Scholar]
- 27.Garvin M. K., Abràmoff M. D., Kardon R., Russell S. R., Wu X., Sonka M., “Intraretinal layer segmentation of macular optical coherence tomography images using optimal 3-D graph search,” IEEE Trans. Med. Imaging 27(10), 1495–1505 (2008). 10.1109/TMI.2008.923966 [DOI] [PMC free article] [PubMed] [Google Scholar]
- 28.Chen X., Niemeijer M., Zhang L., Lee K., Abràmoff M. D., Sonka M., “Three-dimensional segmentation of fluid-associated abnormalities in retinal OCT: probability constrained graph-search-graph-cut,” IEEE Trans. Med. Imaging 31(8), 1521–1531 (2012). 10.1109/TMI.2012.2191302 [DOI] [PMC free article] [PubMed] [Google Scholar]
- 29.Farsiu S., Chiu S. J., O’Connell R. V., Folgar F. A., Yuan E., Izatt J. A., Toth C. A., Age-Related Eye Disease Study 2 Ancillary Spectral Domain Optical Coherence Tomography Study Group , “Quantitative Classification of Eyes with and without Intermediate Age-Related Macular Degeneration Using Optical Coherence Tomography,” Ophthalmology 121(1), 162–172 (2014). 10.1016/j.ophtha.2013.07.013 [DOI] [PMC free article] [PubMed] [Google Scholar]
- 30.The Diabetic Retinopathy Study Research Group , “Photocoagulation treatment of proliferative diabetic retinopathy. Clinical application of Diabetic Retinopathy Study (DRS) findings, DRS Report Number 8,” Ophthalmology 88(7), 583–600 (1981). [PubMed] [Google Scholar]
- 31.E. T. D. R. S. R Group , “Early Treatment Diabetic Retinopathy Study design and baseline patient characteristics. ETDRS report number 7,” Ophthalmology 98(5 Suppl), 741–756 (1991). [DOI] [PubMed] [Google Scholar]
- 32.Ip M. S., Domalpally A., Sun J. K., Ehrlich J. S., “Long-term effects of therapy with ranibizumab on diabetic retinopathy severity and baseline risk factors for worsening retinopathy,” Ophthalmology 122(2), 367–374 (2015). 10.1016/j.ophtha.2014.08.048 [DOI] [PubMed] [Google Scholar]
- 33.Kiss S., Berenberg T. L., “Ultra Widefield Fundus Imaging for Diabetic Retinopathy,” Curr. Diab. Rep. 14(8), 514 (2014). 10.1007/s11892-014-0514-0 [DOI] [PubMed] [Google Scholar]
- 34.Silva P. S., Cavallerano J. D., Haddad N. M. N., Kwak H., Dyer K. H., Omar A. F., Shikari H., Aiello L. M., Sun J. K., Aiello L. P., “Peripheral lesions identified on ultrawide field imaging predict increased risk of diabetic retinopathy progression over 4 years,” Ophthalmology 122(5), 949–956 (2015). 10.1016/j.ophtha.2015.01.008 [DOI] [PubMed] [Google Scholar]


