Abstract
We demonstrate a pressure sensor based on deformation of a periodically nanostructured Bragg grating waveguide on a flexible 50 µm polydimethylsiloxane membrane and remote optical read out. A pressure change causes deformation of this 2 mm diameter photonic crystal membrane sealing a reference volume. The resulting shift of the guided mode resonances is observed by a remote camera as localized color change. Crossed polarization filters are employed for enhancing the visibility of the guided mode resonances. Pressure values are calculated from the intensity change in the green color channel using a calibration curve in the range of 2000 Pa to 4000 Pa. A limit of detection (LOD) of 160 Pa is estimated. This LOD combined with the small size of the sensor and its biocompatibility render it promising for application as an implantable intraocular pressure sensor.
OCIS codes: (170.0170) Medical optics and biotechnology, (050.5298) Photonic crystals
1. Introduction
High intraocular pressure is one of the main indicators for glaucoma, which can lead to permanent blindness. Glaucoma cannot be cured but stopped by timely detection and constant monitoring combined with precise medication. Only an ophthalmologist with specialized equipment can perform a pressure measurement by tonometry for now and thus the testing intervals are rather large at the moment. An easy way for regular intraocular pressure measurements is therefore desirable. Different implants were proposed in recent research [1,2]. These are based on electronic pressure sensors and either need an internal power source or some external power supply by inductive power transfer. Furthermore, they are not transparent and need to be placed far enough outside of the optical axis to not impair the patient. Other implantable devices without power supply have been suggested for camera read out [3, 4], but due to their exclusively transparent nature their contrast for pressure indication is rather low. We previously demonstrated a pressure sensor based on pressing a flexible membrane against a rigid photonic crystal waveguide [5].
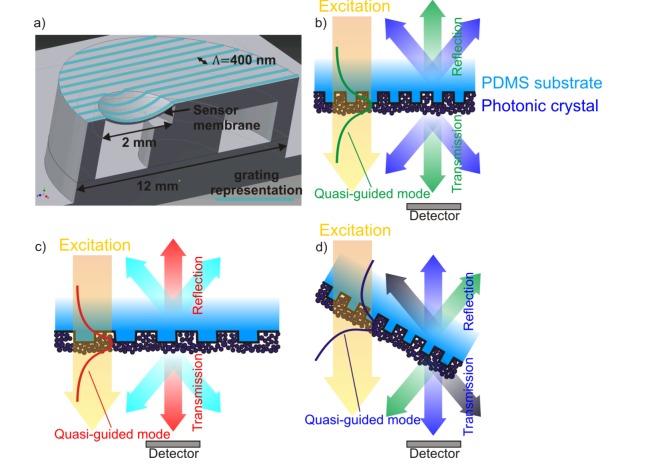
Flexible photonic crystals were proposed for many different applications, for instance, for color creation as magnetically tunable ink [6], photonic crystal paper [7], or as optical strain sensor [8,9]. The optical strain sensors in references [8,9] are based on the deformation of a photonic crystal structure. Due to the periodic nature of the photonic crystal, distinct spectral reflection and transmission features are observed. Changing the period of the structure by strain causes a spectral shift of these features. Following calibration of the sensor, strain maps are obtained by spatially resolved determination of the spectrum or the color of the sensor surface. In particular color imaging may easily be performed with a camera. In this type of sensor small probe light intensities are employed such that radiation pressure effects [10] are negligible. Also known from literature is the angular dependency of the reflection and transmission spectrum of photonic crystal slabs [11]. Tilting of a photonic crystal slab also causes a spectral shift. Here, we propose a pressure sensor based on the deformation of a flexible photonic crystal membrane sealing a reference volume as depicted schematically in Fig. 1(a) . The flexible photonic crystal slab is formed by a high refractive index layer of TiO2 nanoparticles on a periodically nanostructured surface. We employ a nanoparticle layer to prevent cracking in the photonic crystal surface under strain [12].
Fig. 1.
(a) 3D schematic of the pressure sensor based on deformation of a linearly nanostructured membrane that seals a reference volume. The pressure is deduced by normal incidence color imaging of the membrane. (b) Schematic crosssection of the nanostructured PDMS membrane with a high refractive index layer of TiO2 nanoparticles forming a photonic crystal slab waveguide. Under illumination a quasi-guided mode is excited. The mode is scattered in transmission and reflection. Exemplary, the light in two scattering directions is shown. The scattered light is detected by a camera detector (The spatial offset of excitation and detector is shown for clarity. In the measurement both are aligned on the same optical axis.) (c) Schematic of the photonic crystal slab under strain. The increased period causes a red shift of the light scattered in the detector direction. (d) Schematic of the tilted photonic crystal also producing a changed color on the detector.
The photonic crystal slab supports quasi-guided modes that couple to the far field. Incident light excites these quasi-guided modes that are subsequently scattered by the grating. The waveguide mode scattering angle θ to the surface normal depends on the period of the grating Λ, the wavelength of light λ, the mode effective refractive index neff, and the angle φ between the mode propagation direction and the linear grating lines. Equation (1) has to be fulfilled for the mode with wavevector [13].
| (1) |
Here, is the vacuum wavevector, is the grating wavevector, and m is the integer value of the coupling order. The scattered light is visible as guided-mode resonances (GMRs) in the transmission and reflection spectrum. Figure 1(b) schematically shows the scattering for two different angles. When the photonic crystal slab is illuminated and observed through crossed polarization filters, light not interacting with the grating structure is filtered out and only the GMRs of the photonic crystal are observed resulting in a distinct color impression on a camera [14].
Straining causes a change in the grating period Λ as well as a change of the thickness and refractive index of the nanoparticle waveguide layer. The property change of the waveguide layer causes a change in the mode effective refractive index neff. We showed previously that the effect of this change is rather small compared to the effect of the changed grating period [15]. Thus, it follows from Eq. (1) that the wavelength λ scattered to a particular angle changes approximately linearly with the grating period Λ causing a color change at the detector as depicted in Fig. 1(c). Tilting the photonic crystal slab with respect to the detection direction causes a color change on the detector as shown schematically in Fig. 1(d) and calculated from Eq. (1).
Increasing the outside pressure for the sensor in Fig. 1(a) deforms the membrane towards the inside of the sensor. This leads to both straining and position-dependent tilting of the photonic crystal surface. We image the color change on a camera using the concept of crossed polarization filters. In the following we present a fabrication method for realizing the sensor depicted in Fig. 1(a) with a diameter of 12 mm and a membrane diameter of 2 mm. We experimentally characterize the effects of straining and tilting the photonic crystal membrane. Finally, we demonstrate the use of this sensor as a remote-readout pressure sensor. The sensor presented here may potentially be integrated with an intraocular lens and implanted for contact-free intraocular pressure measurements.
2. Fabrication
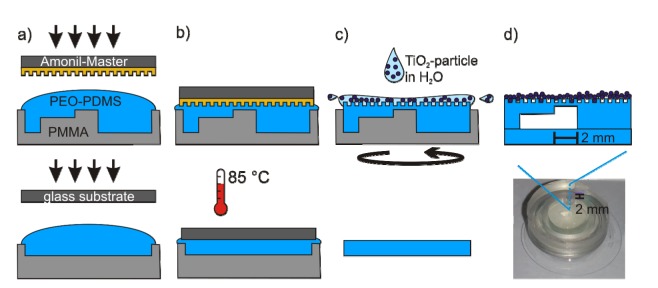
The pressure sensor consists of a reference volume within a polydimethylsiloxane (PDMS, Sylgard 184 from Sigma Aldrich) chamber that is closed by a flexible one dimensional photonic crystal slab. The photonic crystal slab consists of a linearly nanostructured PDMS membrane with a high index waveguide layer of randomly arranged TiO2-particles. In Fig. 2 the fabrication process is depicted.
Fig. 2.
(a-c) Fabrication process of the flexible photonic crystal membrane and the supporting structure (top) as well as the lid (bottom). (d) Schematic and photograph of assembled sensor.
The chamber consists of two parts. Both parts are produced in polymethylmethacrylate (PMMA) molds by pouring the two mixed components of the PDMS plus an additive of Poly (dimethylsiloxane-b-ethylene oxide), methyl terminated (PEO-PDMS from Polysciences, Inc.) (Base: Curing: PEO-PDMS → 100:10:1) into them. The additive of PEO-PDMS renders the cured PDMS more hydrophilic, which is necessary for the spin coating of the in water dissolved nanoparticles. The nanostructure is imprinted into the top part via a photo resist master (Amonil MMS4 by AMO GmbH, Aachen, Germany) that was replicated in our group from an electron-beam written glass master structure (Fig. 2(a)). The linear structure in the PDMS membrane has a periodicity of 400 nm and a depth of 100 nm. The filled molds are heated at 85 °C for 90 minutes. Due to a small 2 mm diameter cylindrical post in the mold for the top part, the thin PDMS membrane is created between this round plateau and the photo resist master during the printing and heating process. By spin-coating a layer of high index TiO2-nanoparticles (Titanium(IV) oxide, mixture of rutile and anatase, 33-37 wt.% in H2O from Sigma Aldrich; diameter < 150 nm; ~21 nm primary particle size of starting nanopowder) on the structured membrane it forms a flexible photonic crystal slab. The layer of randomly arranged TiO2-particles forms a waveguide that has a geometric periodic structure due to the linear grating in the PDMS layer below it. We diluted the dispersion to 4 wt% of TiO2-particles in H2O together with 0.5 wt% of fluorosurfactant (PFT) (NOVEC FC-4430 from 3M) to further reduce the contact angle and spin-coated it onto the nanostructure with 2000 rpm and a ramp of 5000 rpm/s for 20 s [12]. Afterwards the bottom and top part were pealed from the molds and assembled by using the “Stamp-and-Stick (SAS)” method with uncured PDMS as described by Satyanarayana et al. [16] to form the sealed chamber. Uncured PDMS was used because of its good properties for PDMS-PDMS bonding [17] without the risk of damaging the nanostructure, which could happen with the more often used process of plasma bonding. The scanning electron microscopy (SEM) scan in Fig. 3 shows a high quality of the reproduced nanostructure and a homogenous high index layer of TiO2-particles.
Fig. 3.
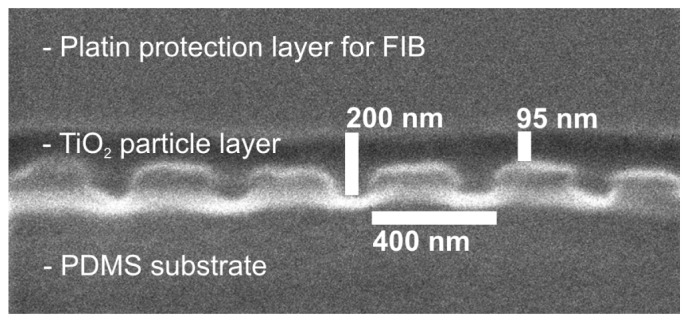
Scanning electron microscopy (SEM) scan of a focused ion beam (FIB) cut in the nanostructured PDMS membrane and the TiO2 particle layer. The TiO2 layer can be seen as a dark 95 nm to 200 nm streak above of the PDMS nanostructure. The layers of the PDMS substrate and the TiO2-particles are non conductive and therefore the SEM cannot capture features that are as small as the average particle size (~21 nm) which is why the individual particles are not visible in the SEM scan. The highlighting of the nanostructure is caused by charging effects at the PDMS material border during the SEM scan.
3. Experiments and results
We performed two sets of experiments. In the first set of experiments we evaluate the optical characteristics of the flat photonic crystal membrane under strain and tilting. These results are presented in subsection 3.1. In subsection 3.2 the calibration of the sensor is detailed and pressure measurements are carried out.
3.1 Straining and tilting of photonic crystal membranes
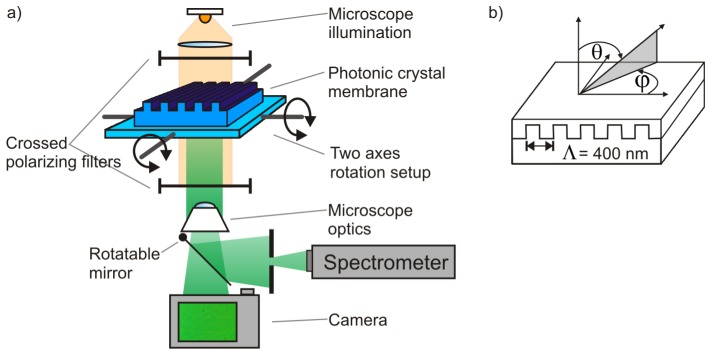
The influence of straining and tilting of the flat photonic crystal membranes is investigated by transmission measurements. Figure 4 shows the experimental setup. A photonic crystal membrane is placed in a microscope setup on a holder for adjusting the angles θ and φ. The microscope lamp is used for illumination and the transmitted light is collected by an objective with 4x magnification. Crossed polarization filters are employed for suppressing light not interacting with the grating. The initial placement of the photonic crystal membrane without tilt is such that the nanostructure lines of the sensor membrane have an angle of 45° to both polarization filters. Thus, only light interacting with the photonic crystal can be seen on the photos that were taken by the microscope as shown in [14]. An image of the sample is photographed with a camera and part of the transmitted light is guided to a spectrometer.
Fig. 4.
(a) Experimental setup for transmission measurements. (b) Schematic of angle definitions.
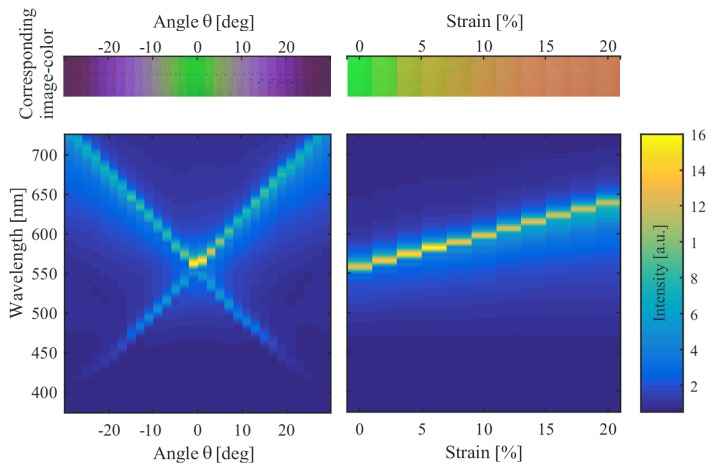
Figure 5(a) shows the results for tilting the photonic crystal slab to different observation angles θ for φ = 0°. The photonic crystal slab appears green at θ = 0° and φ = 0°. The guided mode resonances (GMR) of the photonic crystal slab shift apart when the angle of observation θ increases. The combination of the blue-shifted GMR and the red-shifted GMR results in a purple color impression for θ = 20°. Figure 5(b) displays the effect of straining the flexible photonic crystal membrane at θ = 0° and φ = 0°. The GMR wavelength of the resonance increases leading to a reddish color impression at 20% strain.
Fig. 5.
Spectra of the flexible photonic crystal slab observed between crossed polarization filters for φ = 0° under (a) tilting and (b) straining. The image color for each tilt and strain condition is displayed above.
Next, we consider the relative size of both effects. For this purpose we model the membrane depicted in Fig. 1(a) to be deformed as a spherical cap with the chord length d = 2 mm being the diameter of the membrane. The maximum observation angle θmax is obtained at the edge of the membrane, while the minimum observation angle θmin = 0° is in the middle of the membrane. The strain ε given in Eq. (2) is proportional to the ratio of arc length s to chord length d.
| (2) |
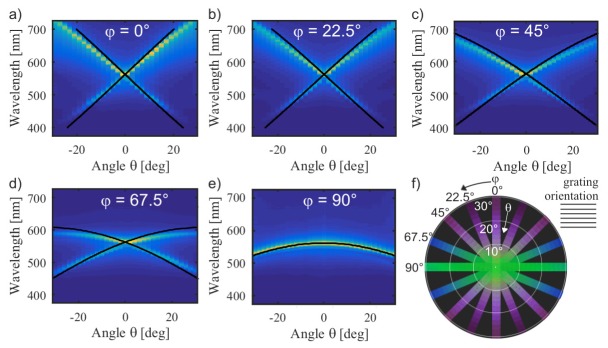
Using Eq. (2) allows us to calculate the strain for a given maximum observation angle θmax. For θmax = 10° a strain ε = 0.5% is obtained and for θmax = 20° a strain ε = 2%. Considering the experimental results in Fig. 5 we conclude that the tilt effect causes much larger spectral changes than the strain effect. Therefore, we consider the tilt effect in more detail in the following. Figure 6(a)-6(e) presents experimental measurements of spectra over observation angle θ for different values of the angle φ. Theoretical mode positions are calculated using Eq. (1). A constant neff = 1.4 is assumed for simplicity neglecting the wavelength dependency of neff. This low effective refractive index indicates that the mode is not truly guided, but has a propagation characteristic in the substrate. The resonance effect is still clearly visible rendering the membrane suitable for pressure measurements. Experimental data and theoretical mode predictions are in agreement. Figure 6(f) presents a stitched polar plot of the color photographs at different angles θ and φ. From these images it follows that for the deformed membrane in Fig. 1(a) a green color impression is expected across the membrane for φ = 90°, i.e., along the grating lines. For φ = 0° a purple color is expected at the edges, where the observation angle θ is maximum.
Fig. 6.
(a-e) Spectra as a function of observation angle θ for different angles φ. The experimental data is overlayed with calculated mode positions (black lines) obtained from Eq. (1) assuming neff = 1.4. (f) Stitched polar plot of color photographs at different angles θ and φ.
3.2 Pressure measurements
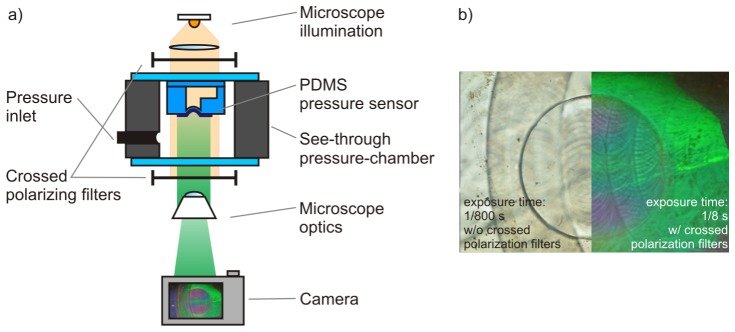
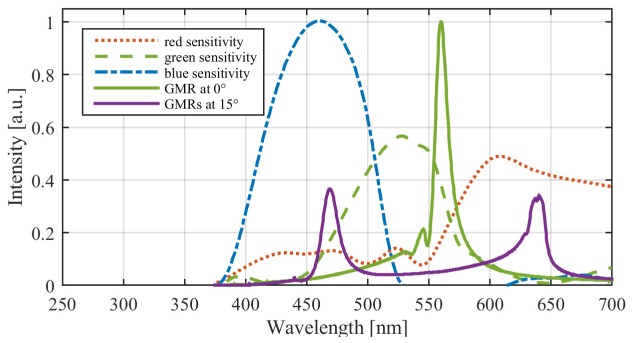
For experimental verification the fabricated pressure sensor is placed inside a small computer controlled pressure chamber as shown schematically in Fig. 7(a) . Inside the chamber different intraocular pressure (IOP) values from low normal to ocular hypertension can be simulated (10 mmHg to 40 mmHg ≈1333 Pa to 5333 Pa). Normal IOP is between 10 mmHg and 20 mmHg with an average of 15.5 mmHg. The chamber is placed in a transmission microscope between two crossed polarization filters. The nanostructure lines have a horizontal orientation in the pictures of Fig. 7. Figure 7(b) shows images of the sensor surface with and without the use of crossed polarization filters. Without polarization filters the sensor is transparent. The circular patterns and arched curves visible are tool marks from the fabrication of the PMMA molds that are preventable in an improved mold fabrication process. This transparency of the sensor demonstrates the possibility to integrate it into an intraocular lens without interfering with the patient’s line of sight. With the crossed polarization filters in place, the transmission intensity is much weaker (thus the longer exposure time) and the sensor surface displays a distinct color pattern. This color image displays a green color in the center and the cross section along the grating lines, while a purple color is observed at the edges in the cross section perpendicular to the grating lines. This is the behavior expected from Fig. 6(f). The sensitivity of the three color channels of the camera are graphed in Fig. 8 .
Fig. 7.
(a) Measurement setup for experiments with varying pressure is shown. The sensor is placed in a controllable pressure camber and viewed using a transmission microscope. The chamber is placed between crossed polarization filters to suppress the transmission light except for the guided mode resonance. It can be analyzed by a spectrometer or camera.
Fig. 8.
Sensitivity of the three color channels of a Nikon D300 camera (similar chip to the used D5100) (dotted lines). Guided mode resonances (GMR) for φ = 0° and θ = 0° (green curve) and for φ = 0° and θ = 15° (purple curve).
Figure 9 shows a series of images for increasing pressure in the pressure chamber. It is observed that the color pattern changes with pressure. The contrast in the green channel between the green center area and the purple areas above and below it is ~0.39 for the two images with highest pressure. The Michelson contrast defined as Km = (Lmax-Lmin)/(Lmax + Lmin) with Lmax being the mean maximum green value of the green center area and Lmin as the mean minimum green value of the purple areas. The contrast between the extreme points (center and edge) is not increasing, as the spectrum at the edge is shifted out of the green color channel for both images. Therefore, just considering the two points on the membrane with minimum and maximum intensity in the green color channel is not sensitive at high pressure values. For obtaining a single number correlated to the pressure value considering the whole membrane, we integrated the intensity of the green sensitivity channel of the camera across the whole circular sensor area.
Fig. 9.
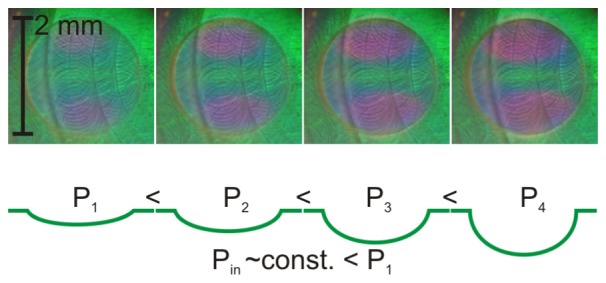
Top: Experimentally observed color patterns with increasing pressure due to the deformation of the circular sensor membrane under increasing pressure. Bottom: Schematic (and exaggerated) section through the membrane showing the increasing deformation. The reduction of the reference volume due to the deformation is small enough to be neglected.
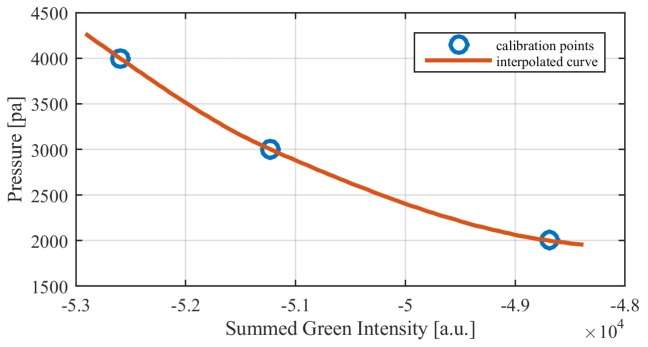
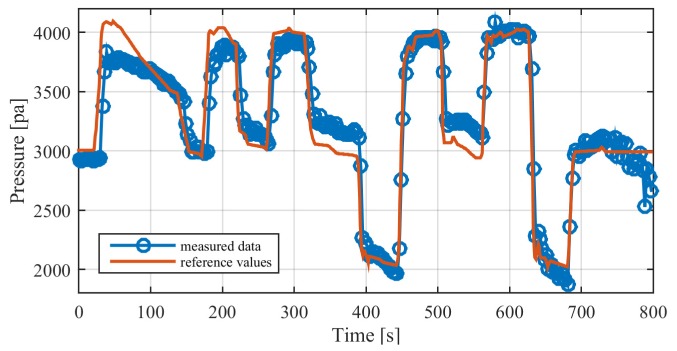
For the experiment the pressure inside the test chamber was monitored with an electronic sensor. Its recorded data also was used for calibration and comparison with the measured data from the photonic crystal membrane sensor. 20 pictures were taken from the membrane for each of three pressure levels with time steps of 2 s. The summed green intensity of the sensor area for each level was calculated and set to the pressure value of the reference sensor as seen in Fig. 10 (blue circles). The gaps between them were interpolated (red curve) with a piecewise cubic Hermite interpolation in Matlab and the derived curve was used to translate a measurement over 800 s with one picture every 2 s from green intensity values to pressure values (Fig. 11 ).
Fig. 10.
Calibration curve for the translation of the camera’s green channel intensity of the sensor area to pressure values interpolated from measurement points.
Fig. 11.
Comparison between measured values of pressure derived from the translation of the green channel’s intensity to reference values measured with the digital pressure sensor.
The translation of the intensity values to the pressure scale by using the interpolated calibration curve leads to a good alignment of the measured values to the reference data. We calculate an optimal limit of detection (LOD) from this data set of around 160 Pa (≈1.2 mmHg) under laboratory conditions. Here, the LOD is defined as LOD = (3 × σ / ΔI) × Δp with σ as the average standard deviation on two plateaus of the measured green intensity values with 12 data points each, ΔI as the average intensity difference of the plateaus and Δp as the pressure difference of the two plateaus given by the reference sensor. We only used the final 12 data points of each considered plateau to exclude possible transient phenomena. In general more measurement points would be desirable, because that would mean a more reliable signal and therefore a more robust statement about the pressure.
4. Conclusion
We have demonstrated an optical pressure sensor based on the deformation of a photonic crystal waveguide fabricated on a flexible PDMS membrane. By eliminating background light with crossed polarization filters, guided mode resonances cause color patterns on camera images. The color depends on the angle between the surface of the photonic crystal and the optical axis of the camera. The color is therefore an indirect indicator for the amount of deformation of the membrane caused by the pressure difference between the inside of the sensor and the surrounding medium as long as the sensor has a constant orientation towards the camera. With an LOD of 1.2 mmHg our sensor is suitable for monitoring IOP and supporting glaucoma diagnoses and treatment. The photonic crystal slab, as shown in Fig. 1, scatters light of the GMR in transmission and reflection. Therefore, a readout in reflection is possible. A vision for an implantable intraocular pressure sensor based on our flexible photonic crystal slab membrane is shown in Fig. 12 . Here, the sensor is suggested to be integrated into a function-augmented artificial lens.
Fig. 12.
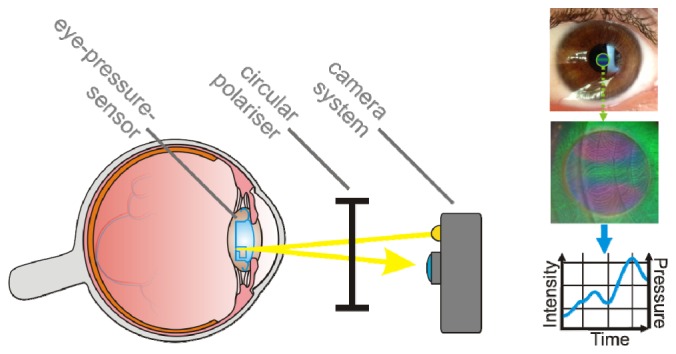
Schematic of an implantable intraocular pressure sensor integrated with an artificial lens implant. The flexible photonic crystal membrane is observed from the outside with a camera through a circular-polarization filter. From the color pattern on photos the pressure may be calculated.
In our experiments vertical incident light on the central point of the membrane and the area surrounding the membrane was ensured by the experimental setting. In a patient’s eye additional movement and tilting may occur during a measurement. When the eye moves, small tilts of the sensor around an axis partly parallel to the line grating can occur and cause a shift and split superimposing the one caused by the pressure-deformation. In that case the green center line would move out of the center and this fact can be used to determine the recordings, where the sensor was orientated correctly. Furthermore, the nanostructured area surrounding the membrane may be used for calibration as this also changes color with patient movement. This demonstrates that due to the imaging approach a correction for movement is possible and should be studied in detail for technology transfer towards application.
The electronic sensor from N. Xue et al [2] has a theoretical detection limit lower than 1 mmHg and the microfluidic based sensor from I. E. Araci et al [4] has in average error of 0.5 mmHg in their measurements. We calculated an LOD of around 160 Pa or 1.2 mmHg for our PDMS membrane based sensor, which is higher but on the same order of magnitude. We are confident that it can be further improved in the future with more stable fabrication techniques and advanced image analysis. Here, we calculated the pressure values from the integrated intensity values of the green color channel. Next, more sophisticated image analysis may be used including the spatial variation of the pattern. IOP measurements with a standard Goldmann tonometer which is the standard method today for comparison have an accuracy similar to our sensor of about 1.6 mmHg (213 Pa) caused by the patient and also by the observer [18]. Thus, our sensor design is promising for future function-augmented intraocular lenses.
References and links
- 1.Mokwa W., “Medical implants based on microsystems,” Meas. Sci. Technol. 18(5), R47–R57 (2007). 10.1088/0957-0233/18/5/R01 [DOI] [Google Scholar]
- 2.Xue N., Lee J.-B., Foland S., Chang S. P., “Biocompatible polymeric wireless pressure sensor for intraocular pressure sensing application,” IEEE Sensors Proc. 1930, 1748–1751 (2011). 10.1109/ICSENS.2011.6127005 [DOI] [Google Scholar]
- 3.Chen P.-J., Rodger D. C., Agrawal R., Saati S., Meng E., Varma R., Humayun M. S., Tai Y.-C., “Implantable micromechanical parylene-based pressure sensors for unpowered intraocular pressure sensing,” J. Micromech. Microeng. 17(10), 1931–1938 (2007). 10.1088/0960-1317/17/10/002 [DOI] [Google Scholar]
- 4.Araci I. E., Su B., Quake S. R., Mandel Y., “An implantable microfluidic device for self-monitoring of intraocular pressure,” Nat. Med. 20(9), 1074–1078 (2014). 10.1038/nm.3621 [DOI] [PubMed] [Google Scholar]
- 5.Nazirizadeh Y., Karrock T., Gerken M., “Visual device for pressure measurement using photonic crystal slabs,” Opt. Lett. 37(15), 3081–3083 (2012). 10.1364/OL.37.003081 [DOI] [PubMed] [Google Scholar]
- 6.Kim H., Ge J., Kim J., Choi S., Lee H., Lee H., Park W., Yin Y., Kwon S., “Structural colour printing using a magnetically tunable and lithographically fixable photonic crystal,” Nat. Photonics 3(9), 534–540 (2009). 10.1038/nphoton.2009.141 [DOI] [Google Scholar]
- 7.Fudouzi H., Xia Y., “Colloidal crystals with tunable colors and their use as photonic papers,” Langmuir 19(23), 9653–9660 (2003). 10.1021/la034918q [DOI] [Google Scholar]
- 8.Arsenault A. C., Clark T. J., von Freymann G., Cademartiri L., Sapienza R., Bertolotti J., Vekris E., Wong S., Kitaev V., Manners I., Wang R. Z., John S., Wiersma D., Ozin G., “From colour fingerprinting to the control of photoluminescence in elastic photonic crystals,” Nat. Mater. 5(3), 179–184 (2006). 10.1038/nmat1588 [DOI] [Google Scholar]
- 9.Fortes L. M., Gonçalves M. C., Almeida R. M., “Flexible photonic crystals for strain sensing,” Opt. Mater. (Amst) 33(3), 408–412 (2011). 10.1016/j.optmat.2010.09.024 [DOI] [Google Scholar]
- 10.Aspelmeyer M., Kippenberg T. J., Marquardt F., “Cavity optomechanics,” Rev. Mod. Phys. 86(4), 1391–1452 (2014). 10.1103/RevModPhys.86.1391 [DOI] [Google Scholar]
- 11.Turnbull G. A., Andrew P., Jory M. J., Barnes W. L., Samuel I. D. W., “Relationship between photonic band structure and emission characteristics of a polymer distributed feedback laser,” Phys. Rev. B. 64, 125122 (2001). [Google Scholar]
- 12.T. Karrock, J. Schmalz, Y. Nazirizadeh, and M. Gerken, “Fabrication of flexible photonic crystal slabs,” MRS Proc. 1698, (2014). 10.1557/opl.2014.882 [DOI] [Google Scholar]
- 13.Turnbull G. A., Andrew P., Barnes W. L., Samuel I. D. W., “Photonic mode dispersion of a two-dimensional distributed feedback polymer laser,” Phys. Rev. B 67(16), 165107 (2003). 10.1103/PhysRevB.67.165107 [DOI] [Google Scholar]
- 14.Nazirizadeh Y., Müller J., Geyer U., Schelle D., Kley E. B., Tünnermann A., Lemmer U., Gerken M., “Optical characterization of photonic crystal slabs using orthogonally oriented polarization filters,” Opt. Express 16(10), 7153–7160 (2008). 10.1364/OE.16.007153 [DOI] [PubMed] [Google Scholar]
- 15.Pradana A., Gerken M., “Photonic crystal slabs in flexible organic light-emitting diodes,” Photon. Res. 3(2), 32–37 (2015). 10.1364/PRJ.3.000032 [DOI] [Google Scholar]
- 16.Satyanarayana S., Karnik R. N., Majumdar A., “Stamp-and-Stick Room-Temperature Bonding Technique for Microdevices,” J. Microelectromech. Syst. 14(2), 392–399 (2005). 10.1109/JMEMS.2004.839334 [DOI] [Google Scholar]
- 17.Eddings M. A., Johnson M. A., Gale B. K., “Determining the optimal PDMS–PDMS bonding technique for microfluidic devices,” J. Micromech. Microeng. 18(6), 067001 (2008). 10.1088/0960-1317/18/6/067001 [DOI] [Google Scholar]
- 18.Dielemans I., Vingerling J. R., Hofman A., Grobbee D. E., de Jong P. T. V. M., “Reliability of intraocular pressure measurement with the Goldmann applanation tonometer in epidemiological studies,” Graefes Arch. Clin. Exp. Ophthalmol. 232(3), 141–144 (1994). 10.1007/BF00176782 [DOI] [PubMed] [Google Scholar]


