Abstract
We present a multi-contrast microscope based on color-coded illumination and computation. A programmable three-color light-emitting diode (LED) array illuminates a specimen, in which each color corresponds to a different illumination angle. A single color image sensor records light transmitted through the specimen, and images at each color channel are then separated and utilized to obtain bright-field, dark-field, and differential phase contrast (DPC) images simultaneously. Quantitative phase imaging is also achieved based on DPC images acquired with two different LED illumination patterns. The multi-contrast and quantitative phase imaging capabilities of our method are demonstrated by presenting images of various transparent biological samples.
OCIS codes: (110.0180) Microscopy, (110.1758) Computational imaging, (100.5070) Phase retrieval
1. Introduction
Optical microscopy is a ubiquitous tool in diverse disciplines, providing detailed visualization of materials and biological specimens [1]. Continued advances in microscopy over the past decades have introduced many new imaging modalities. However, bright-field, dark-field, and phase-contrast microscopy still represent the most common and widely employed label-free imaging methods. Bright-field (BF) microscopy provides images by mapping the intensity modulation of light passing through a specimen. Although it is the simplest and most common form of microscopy, it is not suitable for observing translucent samples such as unlabeled cells and thin tissue specimens, as these specimens do not exhibit strong attenuation in visible light. Dark-field (DF) microscopy [2, 3] produces high-contrast images of thin samples, being sensitive to the edges of specimens. DF microscopy employs oblique light illumination beyond the maximum angle that optical imaging systems can capture, thereby minimizing unscattered background while collecting scattered light from the sample. Phase contrast microscopes, such as Zernike [4, 5] and differential interference contrast (DIC) microscopy [6, 7], provide images by rendering optical phase delay of light passing through a specimen into intensity distribution. These methods operate on the principle of light interference, and thus require specialized optical components to form an interferometer in the imaging setup.
Although bright-field, dark-field, and phase contrast images offer complementary information of specimens, simultaneous acquisition of these images is not feasible in conventional microscopes, since each modality requires a distinct optical arrangement and dedicated optical elements, such as annular condensers and specialized objective lenses. Moreover, conversion between imaging modes is accompanied by the expenses in time and additional optical elements.
Recently, Zheng et al. [8] suggested using a programmable LED array as an illumination unit in microscopy for multi-contrast imaging. In the method, image acquisition with sequential LED illumination and subsequent computation of the acquired images enabled BF and DF imaging, along with digital image focusing. Tian et al. [9, 10] and Liu et al. [11] also utilized patterned LED illumination for BF, DF and phase-gradient imaging. Operation of these methods, however, required sequential acquisition of images with different illumination patterns, requiring at least three images to obtain bright-field, dark-field, and differential phase-contrast (DPC) [12–16] images. Real-time multi-contrast imaging was therefore realized with high-speed image sensors.
Here, we present a simple approach for multi-contrast microscopy capable of tri-modal imaging in a single shot. Our method, termed color-coded LED microscopy (cLEDscope), employs color-coded patterned illumination with an LED array so that each color corresponds to a different illumination angle on the specimen. Specimen image is recorded by a color image sensor, which is then separated into the images of each color and computed to generate BF, DF and DPC images in a single shot. Furthermore, cLEDscope enables acquisition of quantitative phase image by taking two shots with different LED patterns, which are set to obtain DPC images in the x and y directions, respectively. DPC images in the both directions are required to improve frequency coverage, thereby achieving more stable phase recovery [10]. Spiral phase Fourier integration [17–19] with the DPC images then yields quantitative phase image of the specimen. We describe the operation and implementation of cLEDscope, and demonstrate its real-time multi-contrast imaging capability by presenting BF, DF and DPC images of various transparent specimens and dynamic behavior of Caenorhabditis elegans (C. elegans). The quantitative phase imaging capability of our setup is also validated by imaging well-characterized microspheres and human epithelial cheek cells.
2. cLEDscope setup and operation
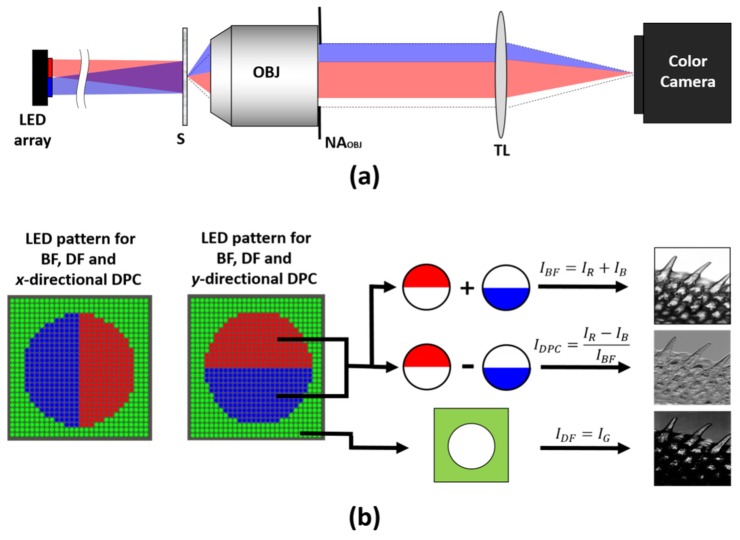
Figure 1(a) depicts a schematic of cLEDscope, which may be readily built on a conventional microscope. For illumination, an LED array (Adafruit 607, New York, USA) is positioned at the Fourier plane of the specimen (S). In our case, the LED array was positioned at a location distant from the specimen (~100 mm) so that the light source plane could be approximated as the Fourier plane of the specimen plane. Each LED in the light source was controlled individually to illuminate the specimen at a given angle. Therefore, a set of LEDs determines the illumination angles.
Fig. 1.
(a) cLEDscope schematic. A programmable color LED array is located at the Fourier plane of the specimen (S). The LED array illuminates the specimen, and a color image sensor records light transmitted through the specimen. Shown in the left of (b) are the patterns employed in cLEDscope imaging. The recorded color image for a given LED pattern is separated into images in red, blue, and green colors, which are then used to compute BF (IBF), DF (IDF), and DPC (IDPC) images. Representative multi-contrast images of a fish scale are shown on the right of (b). OBJ: Objective, NAOBJ: objective numerical aperture, TL: tube lens.
To achieve single-shot multi-contrast imaging, one of the LED illumination patterns in the left of Fig. 1(b) was employed. The pattern consists of two half circles allocated to red (R) and blue (B) colors, respectively, and the outer circle region assigned to green (G) color. The radius of the R and B half circles is determined by the numerical aperture (NA) of the objective lens (0.45/20 × , Nikon, Japan). Hence, the illumination angles set by red and blue LEDs correspond to the spatial frequencies that can be captured by the microscope. The angles from the green LEDs correspond to illumination angles larger than the maximum of the imaging system. Light transmitted through a sample is collected by the objective and then imaged by a color image sensor.
For image reconstruction, the acquired color image is decomposed into three images in R (IR), G (IG), and B (IB) channels. Summation of the R and B images is equivalent to obtaining an image with the full circle of LEDs, producing a bright-field image (IBF) (Eq. (1)). On the other hand, the image in the G channel results from the light scattered from the specimen under oblique illumination with angles larger than the NA of the imaging system. Therefore, the image in the G channel corresponds to the dark-field image (IDF) (Eq. (2)).
| (1) |
| (2) |
The differential phase contrast (DPC) image is defined as:
| (3) |
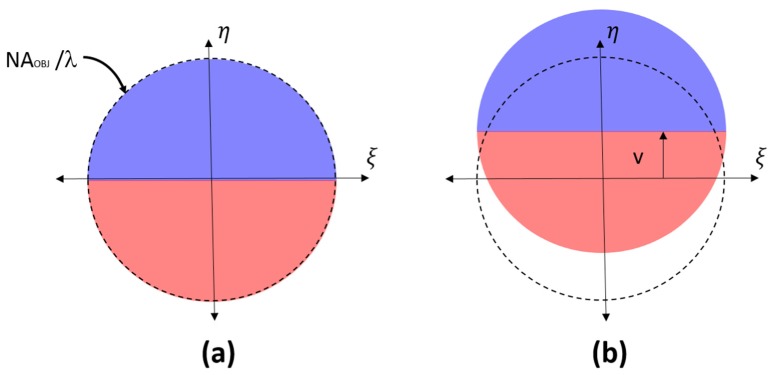
The DPC image contrast arises from the asymmetry of R and B patterns in the pupil plane due to phase gradient in the specimen. Consider a pupil plane of the microscope, as shown in Fig. 2 . For a pure real specimen with no phase variations, the illumination pattern in the LED array will be imaged at the pupil plane, producing a symmetric distribution of R and B patterns (Fig. 2(a)). In this case, the images corresponding to R and B colors would be identical, and subtracting R and B images will result in zero. For a sample with spatially varying phase distribution, the illumination pattern will shift in the pupil plane by an amount proportional to the derivative of phase along the direction of asymmetry (Fig. 2(b)). Therefore, evaluation of Eq. (3) will produce non-zero contrast.
Fig. 2.
In cLEDscope, symmetric distribution of R and B patterns is produced at the pupil plane for a sample with no phase variation (a). If the sample exhibits spatially varying phase distribution, the distribution of R and B patterns will shift by an amount proportional to the phase gradient at the pupil plane.
The relationship between the DPC image intensity and the phase gradient can be obtained by using phase-gradient transfer function (PGTF) as described in [20, 21]. For a phase gradient in a specimen, which can be represented by its corresponding spatial frequencies (u, v), the relative intensity, with which that gradient is measured, can be obtained by evaluating the overlap area of the objective pupil function and the image of the illumination pattern shifted by (u, v) in the pupil plane (Fig. 2(b)). PGTF is thus computed as:
| (4) |
where is objective pupil function and is the illumination pattern imaged onto the pupil plane. As noted by Mehta et al. [21], PGTF is not a transfer function in the usual sense, but serves as a look-up table relating the measured image intensity and the phase gradient. Hence, the effective PGTF for the ratio of two measurements with different illumination apertures is equal to the ratio of the corresponding PGTFs.
Figure 3 shows the computed PGTFs for different illumination patterns. PGTFs for and are evaluated with semicircular PS and circular PO. The and denote the spatial frequencies normalized with in the x and y directions. All the PGTFs except for that for are normalized with the maximum value of the PGTF for . It can be seen that the PGTF for , which is equivalent to bright-field imaging, is equal to the optical transfer function of an imaging system with a circular aperture. The PGTF for is an odd function that tapers down to zero at ± 2 in the normalized spatial frequency. Evaluating the ratio of the PGTF for to that for yields PGTF for , which is nearly linear up to the half the cutoff of the imaging system. This result can be used to obtain phase gradient information for a measured DPC image intensity. The same result has been reported by Mehta et al. [21]. Once phase gradient information is obtained, the phase distribution of the specimen can be quantitatively reconstructed through two-dimensional integration. While several methods can be employed for this operation, a Fourier-domain phase integration approach was used in our case, as described in [17–19].
Fig. 3.
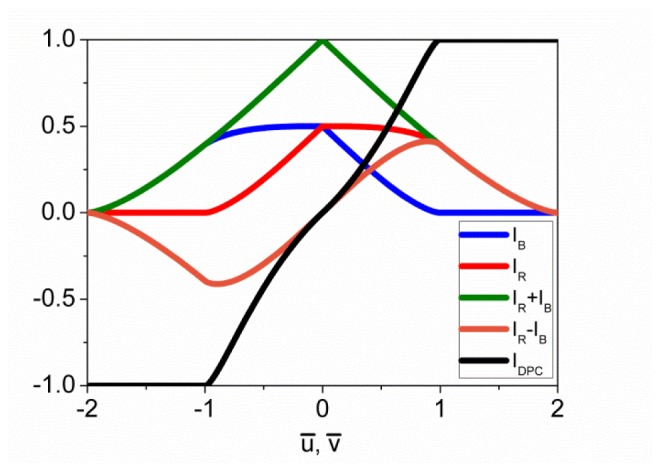
Computed for different illumination patterns. and denote spatial frequency normalized with in the x and y directions, respectively.
3. Results
In order to demonstrate multi-contrast and quantitative phase imaging capability of our cLEDscope, an LED array (Adafruit 607, New York, USA) was integrated as an illuminator in an inverted microscope (Eclipse, Nikon, Japan). Control of each LED was performed with a microcontroller (Arduino UNO, R3). For all the experiments, an objective (0.45/20 × , Nikon, Japan) was used. A color image sensor (IOI Flare 2M-180CL, Ontario, Canada) was installed at the image port of the microscope, and the image acquisition and computation of BF, DF and DPC images were performed with a software written in LabVIEW (National Instruments Co., Austin, TX, USA).
3.1. Single-shot multi-contrast imaging
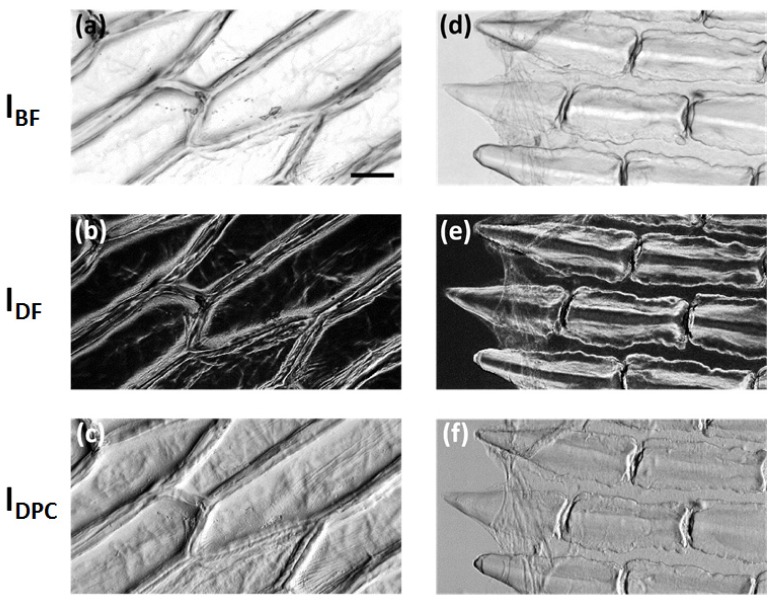
Single-shot, multi-contrast imaging capability of the cLEDscope was first assessed by imaging various translucent specimens, such as onion cells and fish scales. Figure 4 shows representative BF, DF, and DPC images of the samples. The distinct arrangement of onion cells and fish scale structures could be clearly visualized. As in conventional bright-field microscopy, the image contrast of BF images arises from light absorption and scattering of the specimens. On the other hand, dark-field images provide higher contrast for the cell membranes and fish scale boundaries. DPC images offered detailed visualization of microstructures that were not clearly observed in the other imaging modalities.
Fig. 4.
Single-shot multi-contrast images of onion cells (a-c) and scomber fish scales (d-f). Scale bar represents 100 μm.
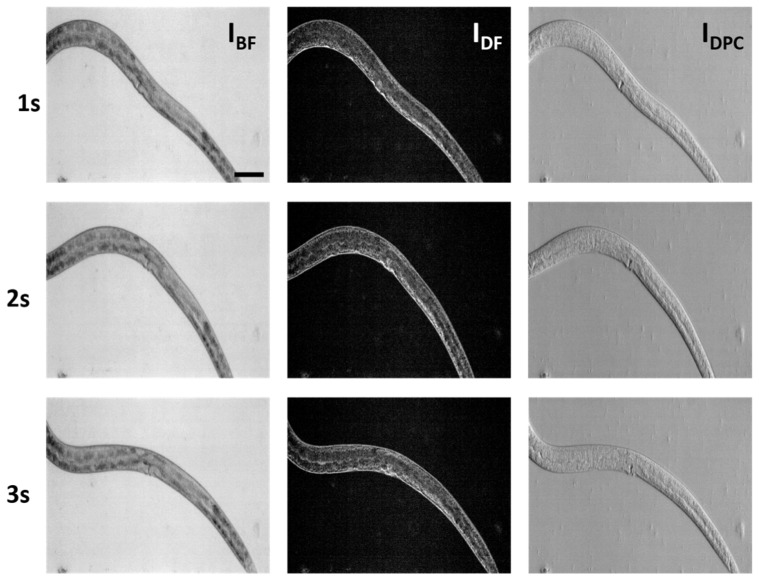
We then performed time-lapsed imaging of wild-type Caenorhabditis elegans (C. elegans) (Fig. 5 ). C. elegans immersed in phosphate buffered saline solution was sandwiched between a microscope slide and coverslip. Figure 5 shows representative BF, DF, and DPC images of C. elegans acquired at different times. Note that the tri-modal images were obtained in a single shot. Compared with BF images, higher contrast could be achieved in DF images, while structural details were more pronounced in DPC images. A movie ( Visualization 1 (2.1MB, MOV) ) presents the dynamic movement of the C. elegans visualized in different imaging modes.
Fig. 5.
Representative cLEDscope images of C. elegans acquired at 1, 2, and 3 seconds. Images were recorded at frame rate of 32 fps. Scale bar represents 100 μm.
3.2 cLEDscope quantitative phase imaging
3.2.1 Phase measurement accuracy
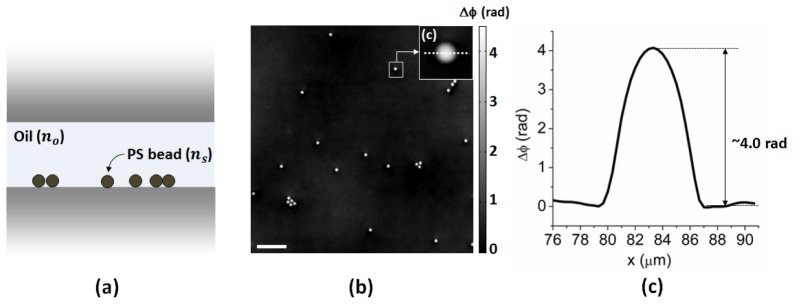
Phase measurement accuracy of our cLEDscope was evaluated by imaging polystyrene microspheres. Polystyrene microspheres with a diameter (d) of 5 μm (4205A, Duke StandardsTM, Thermo Scientific Inc., Waltham, MA, USA) were placed in immersion oil (Index Matching Liquid 150, Norland Inc., Cranbury, NJ, USA) and sandwiched between two microscope coverslips (Fig. 6(a) ). Imaging was then performed with two LED patterns as depicted in Fig. 1 to obtain DPC images in the x and y directions. The corresponding quantitative phase-gradient information was then integrated to obtain quantitative phase image. Phase delay due to the microspheres relative to a glass surface was estimated as = 4.15 rad. Here, the mean wavelength ( ) was assumed to be 0.53 μm, which corresponds to the average wavelength of red and blue LEDs. The refractive indices of the microspheres ( ) and the immersion oil ( ) were found to be 1.59 and 1.52, respectively, from the datasheets provided by the manufacturers. Figure 6(b) shows a reconstructed quantitative phase image of the sample. Shown in the inset is the magnified image of the region indicated by the rectangle. The phase distribution along the dashed line in the inset of Fig. 6(b) is presented in Fig. 6(c). The phase delay from the glass surface to the center of the microsphere was measured as ~4.00 rad. The difference between estimated and measured phase delay was ~4%. This discrepancy may be partly attributed to the uncertainties in the size of the microspheres and our estimation of the center wavelength.
Fig. 6.
(a) Polystyrene microspheres immersed in index matching liquid were imaged to evaluate phase measurement accuracy. (b) Quantitative phase image of the beads. A magnified view of the region indicated by the rectangle is shown in the inset. Scale bar denotes 50 μm. (c) Measured phase distribution along the dashed line in the inset of (b).
3.2.2 Phase imaging of biological cells
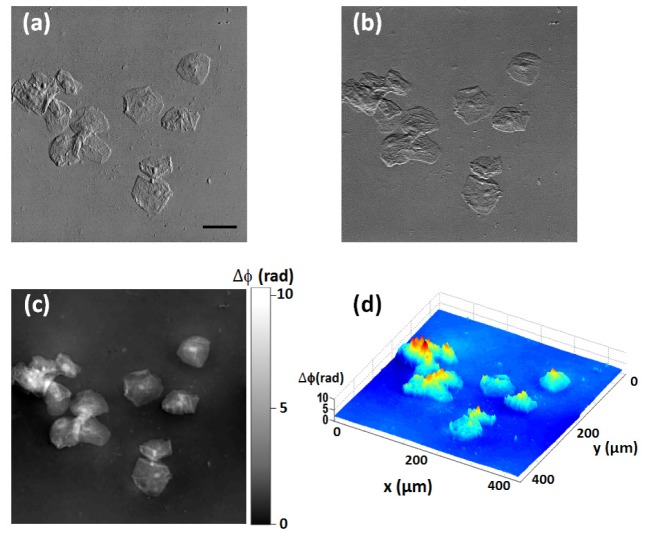
We then performed quantitative phase imaging of human epithelial cheek cells. Presented in Figs. 7(a)-7(b) are the DPC images of the cells along the x and y directions. Quantitative phase image was then obtained through Fourier-domain integration based on phase gradient information along the x and y directions. Figure 7(c) shows a quantitative phase image of the specimens. The color bar to the right of the image represents phase delay in radians. Three-dimensional visualization of the quantitative phase image is presented in Fig. 7(d). Cellular nuclei and other structures were clearly discerned.
Fig. 7.
(a-b) DPC images along x and y directions. Images were obtained with two LED patterns in Fig. 1. (c) Quantitative phase image of the cells obtained with complex Fourier integration with two images in (a-b). (d) 3D representation of quantitative phase image of human epithelial cheek cells. The scalebar represents 50 μm.
3.2.3 Effect of specimen dispersion on phase measurement
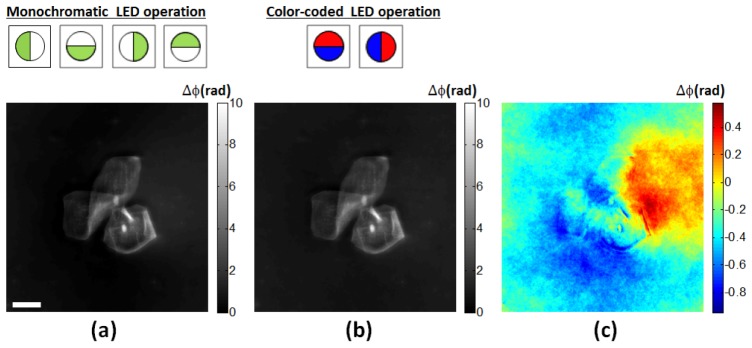
Phase measurement by our cLEDscope may be influenced by material dispersion of specimens. In order to examine the phase error due to the sample dispersion, we acquired the phase images of human epithelial cheek cells with monochromatic and color-coded LED illumination, and compared the measurement results. Note that only two shots are required in the color-coded illumination, while 4 shots are needed for monochromatic illumination. For monochromatic operation, four different source patterns with green LEDs were utilized to obtain the DPC images in the x and y directions. Figure 8(a)-8(b) shows the LED illumination patterns and the corresponding phase images. Presented in Fig. 8(c) is the difference between the two measurements. The difference was found to be smaller than 9.5% of the maximum phase value of the image. This discrepancy may be accounted for by the difference in optical focus between the two measurements.
Fig. 8.
Comparison of the phase measurements based on monochromatic and color-coded LED illumination. (a) and (b) shows the phase images obtained with monochromatic and color-coded LED illuminations, respectively. Shown in the top of each image is the LED illumination pattern utilized for image acquisition. Difference between the two measurements is presented in (c). The scalebar denotes 50 μm.
4. Discussion and conclusion
We presented a simple and cost-effective strategy for multi-contrast microscopy. This approach can easily be implemented on a conventional microscope using a color LED array as an illuminator and a color camera as an image sensor. Color-coded illumination and subsequent computation with images at each color channel enabled simultaneous bright-field, dark-field, and DPC imaging. Quantitative phase images of transparent specimens can also be obtained based on two images acquired with different LED patterns. The multi-contrast and quantitative phase imaging capabilities were demonstrated by presenting images of various biological specimens.
Multi-contrast optical imaging based on a programmable LED array has been previously demonstrated [8–11]. A low-cost liquid crystal display has also been utilized to actively control illumination [22]. While these methods are effective at producing multi-contrast images, they require at least three images to obtain BF, DF, and DPC images and four images to acquire quantitative phase images. In contrast, our method performs tri-modal imaging in a single shot, enabling real-time multi-contrast monitoring of the dynamic behaviors of biological systems. Color-coded illumination may also be utilized to improve throughput in other computational imaging techniques (e.g., phase tomography [23] and Fourier ptychography [24, 25]), which involve illumination of angle-varied plane waves.
Since our method obtains phase information of a specimen based on the phase gradient measurement, it is of importance to quantify the range of phase gradients that can be detected by our setup. As indicated in Fig. 3, the maximum measurable phase gradient is limited to , with the wave number . On the other hand, the noise-equivalent phase gradient is limited by the noise sources such as shot noise and camera readout noise. To quantify the noise-equivalent phase gradient in our setup, we acquired 100 DPC images of a flat microscope glass slide in the x and y directions, and obtained the standard deviation map of the DPC measurements as . Here, denotes the standard deviation map obtained with 100 DPC images in the direction . The averaged standard deviation over the field of view was measured to be ~0.01, which corresponds to 0.016 in normalized spatial frequency referring to Fig. 3. Minimum resolvable phase gradient was thus found to be . In our case (λ = 0.53 μm, = 0.45), it corresponds to 0.09 rad/μm. In addition to shot noise and camera readout noise, fluctuation of the LED light may also contribute to the noise performance.
One issue with color-coded illumination and detection is the leakage of LED light into a different color channel. This leakage may lead to a residual background of the captured image in the adjacent channel, degrading image contrast and leading to errors in phase estimation. In order to minimize this error, the full pupil of our cLEDscope was allocated to red and blue colors, which are spectrally apart. We experimentally quantified the color leakage of blue light to red channel or vice versa. The color leakage was found to be smaller than 9%, resulting in a phase estimation error smaller than 5%.
Phase reconstruction based on single- and multi-axis DPC images has recently been examined [10]. Phase reconstruction with single-axis DPC image is fundamentally limited by missing frequencies in the axis of asymmetry and beyond the passband. Therefore, phase recovery with multi-axis DPC images is highly desirable to improve phase estimation accuracy. In our case, we acquired two DPC images in the x and y directions, and utilized Spiral phase integration to recover the phase information, as successfully demonstrated in [17–19]. It should be noted, though, that as demonstrated by Tian et al. [10], the use of regularization technique may further improve the phase estimation accuracy.
Our method is particularly attractive in field-portable microscopy. Smartphones and wireless webcams are equipped with color CMOS image sensors. Our method can thus be readily implemented into portable multi-contrast microscopes using appropriate LED array illuminators. The developed microscopes could then be used as low-cost portable microscopes for educational purposes as well as in the microscopic examination of cells and biofluids in resource-limited settings.
As a final note, color-coded patterned illumination and detection can be implemented in various ways. For example, a color filter with the spectral transmission segments given in Fig. 1 can be inserted into the Fourier plane of the specimen in the illumination path. A white-light illumination source in conventional microscopes can be utilized in this case, and the filter serves as a patterned illuminator. Similarly, the filter can be implemented in the Fourier plane in the detection path. These configurations would allow single-shot multi-contrast imaging at a low cost.
Acknowledgments
This research was supported by the research programs of the National Research Foundation of Korea (NRF) ( NRF-2015R1A1A1A05001548 and NRF-2015R1A5A1037668) and Korea Ministry of Environment (KME) as “Geo-Advanced Innovative Action Project” ( 2015000540008).
References and links
- 1.Mertz J., Introduction to Optical Microscopy (Roberts, 2010). [Google Scholar]
- 2.Summers K., Kirschner M. W., “Characteristics of the polar assembly and disassembly of microtubules observed in vitro by darkfield light microscopy,” J. Cell Biol. 83(1), 205–217 (1979). 10.1083/jcb.83.1.205 [DOI] [PMC free article] [PubMed] [Google Scholar]
- 3.Kudo S., Magariyama Y., Aizawa S., “Abrupt changes in flagellar rotation observed by laser dark-field microscopy,” Nature 346(6285), 677–680 (1990). 10.1038/346677a0 [DOI] [PubMed] [Google Scholar]
- 4.Zernike F., “How I discovered phase contrast,” Science 121(3141), 345–349 (1955). 10.1126/science.121.3141.345 [DOI] [PubMed] [Google Scholar]
- 5.Burch C., Stock J., “Phase-contrast microscopy,” J. Sci. Instrum. 19(5), 71–75 (1942). 10.1088/0950-7671/19/5/302 [DOI] [Google Scholar]
- 6.Nomarski G., “Differential microinterferometer with polarized light,” Phys. Radium 16, 9–13 (1955). [Google Scholar]
- 7.Salmon E. D., Tran P., “High-resolution video-enhanced differential interference contrast light microscopy,” Methods Cell Biol. 72, 289–318 (2003). 10.1016/S0091-679X(03)72014-7 [DOI] [PubMed] [Google Scholar]
- 8.Zheng G., Kolner C., Yang C., “Microscopy refocusing and dark-field imaging by using a simple LED array,” Opt. Lett. 36(20), 3987–3989 (2011). 10.1364/OL.36.003987 [DOI] [PubMed] [Google Scholar]
- 9.Tian L., Wang J., Waller L., “3D differential phase-contrast microscopy with computational illumination using an LED array,” Opt. Lett. 39(5), 1326–1329 (2014). 10.1364/OL.39.001326 [DOI] [PubMed] [Google Scholar]
- 10.Tian L., Waller L., “Quantitative differential phase contrast imaging in an LED array microscope,” Opt. Express 23(9), 11394–11403 (2015). 10.1364/OE.23.011394 [DOI] [PubMed] [Google Scholar]
- 11.Liu Z., Tian L., Liu S., Waller L., “Real-time brightfield, darkfield, and phase contrast imaging in a light-emitting diode array microscope,” J. Biomed. Opt. 19(10), 106002 (2014). 10.1117/1.JBO.19.10.106002 [DOI] [PubMed] [Google Scholar]
- 12.Amos W. B., Reichelt S., Cattermole D. M., Laufer J., “Re-evaluation of differential phase contrast (DPC) in a scanning laser microscope using a split detector as an alternative to differential interference contrast (DIC) optics,” J. Microsc. 210(2), 166–175 (2003). 10.1046/j.1365-2818.2003.01189.x [DOI] [PubMed] [Google Scholar]
- 13.Hamilton D., Sheppard C., “Differential phase contrast in scanning optical microscopy,” J. Microsc. 133(1), 27–39 (1984). 10.1111/j.1365-2818.1984.tb00460.x [DOI] [Google Scholar]
- 14.Kawata Y., Juškaitis R., Tanaka T., Wilson T., Kawata S., “Differential phase-contrast microscope with a split detector for the readout system of a multilayered optical memory,” Appl. Opt. 35(14), 2466–2470 (1996). 10.1364/AO.35.002466 [DOI] [PubMed] [Google Scholar]
- 15.Ford T. N., Chu K. K., Mertz J., “Phase-gradient microscopy in thick tissue with oblique back-illumination,” Nat. Methods 9(12), 1195–1197 (2012). 10.1038/nmeth.2219 [DOI] [PMC free article] [PubMed] [Google Scholar]
- 16.Kachar B., “Asymmetric illumination contrast: a method of image formation for video light microscopy,” Science 227(4688), 766–768 (1985). 10.1126/science.3969565 [DOI] [PubMed] [Google Scholar]
- 17.Arnison M. R., Larkin K. G., Sheppard C. J., Smith N. I., Cogswell C. J., “Linear phase imaging using differential interference contrast microscopy,” J. Microsc. 214(1), 7–12 (2004). 10.1111/j.0022-2720.2004.01293.x [DOI] [PubMed] [Google Scholar]
- 18.Parthasarathy A. B., Chu K. K., Ford T. N., Mertz J., “Quantitative phase imaging using a partitioned detection aperture,” Opt. Lett. 37(19), 4062–4064 (2012). 10.1364/OL.37.004062 [DOI] [PubMed] [Google Scholar]
- 19.Barankov R., Mertz J., “Single-exposure surface profilometry using partitioned aperture wavefront imaging,” Opt. Lett. 38(19), 3961–3964 (2013). 10.1364/OL.38.003961 [DOI] [PubMed] [Google Scholar]
- 20.Hamilton D., Sheppard C. J., Wilson T., “Improved imaging of phase gradients in scanning optical microscopy,” J. Microsc. 135(3), 275–286 (1984). 10.1111/j.1365-2818.1984.tb02533.x [DOI] [Google Scholar]
- 21.Mehta S. B., Sheppard C. J., “Quantitative phase-gradient imaging at high resolution with asymmetric illumination-based differential phase contrast,” Opt. Lett. 34(13), 1924–1926 (2009). 10.1364/OL.34.001924 [DOI] [PubMed] [Google Scholar]
- 22.Guo K., Bian Z., Dong S., Nanda P., Wang Y. M., Zheng G., “Microscopy illumination engineering using a low-cost liquid crystal display,” Biomed. Opt. Express 6(2), 574–579 (2015). 10.1364/BOE.6.000574 [DOI] [PMC free article] [PubMed] [Google Scholar]
- 23.Tian L., Waller L., “3D intensity and phase imaging from light field measurements in an LED array microscope,” Optica 2(2), 104–111 (2015). 10.1364/OPTICA.2.000104 [DOI] [Google Scholar]
- 24.Zheng G., Horstmeyer R., Yang C., “Wide-field, high-resolution Fourier ptychographic microscopy,” Nat. Photonics 7(9), 739–745 (2013). 10.1038/nphoton.2013.187 [DOI] [PMC free article] [PubMed] [Google Scholar]
- 25.Tian L., Li X., Ramchandran K., Waller L., “Multiplexed coded illumination for Fourier Ptychography with an LED array microscope,” Biomed. Opt. Express 5(7), 2376–2389 (2014). 10.1364/BOE.5.002376 [DOI] [PMC free article] [PubMed] [Google Scholar]


