

Supplemental Digital Content is Available in the Text.
Key Words: HIV, ART monitoring, Democratic Republic of Congo, dried blood spots, viral load assay, programmatic context
Background:
As part of its policy to shift monitoring of antiretroviral therapy (ART) to primary health care (PHC) workers, the Ministry of Health of the Democratic Republic of Congo (DRC) tested the feasibility of using dried blood spots (DBS) for viral load (VL) quantification and genotypic drug resistance testing in off-site high-throughput laboratories.
Methods:
DBS samples from adults on ART were collected in 13 decentralized PHC facilities in the Nord-Kivu province and shipped during program quarterly supervision to a reference laboratory 2000 km away, where VL was quantified with a commercial assay (m2000rt, Abbott). A second DBS was sent to a World Health Organization (WHO)-accredited laboratory for repeat VL quantification on a subset of samples with a generic assay (Biocentric) and genotypic drug resistance testing when VL >1000 copies per milliliter.
Findings:
Constraints arose because of an interruption in national laboratory funding rather than to technical or logistic problems. All samples were assessed by both VL assays to allow ART adjustment. Median DBS turnaround time was 37 days (interquartile range: 9–59). Assays performed unequally with DBS, impacting clinical decisions, quality assurance, and overall cost-effectiveness. Based on m2000rt or generic assay, 31.3% of patients were on virological failure (VF) and 14.8% presented resistance mutations versus 50.3% and 15.4%, respectively.
Conclusion:
This study confirms that current technologies involving DBS make virological monitoring of ART possible at PHC level, including in challenging environments, provided organizational issues are addressed. Adequate core funding of HIV laboratories and adapted choice of VL assays require urgent attention to control resistance to ART as coverage expands.
INTRODUCTION
Between 2006 and 2012, the Ministry of Health of the Democratic Republic of the Congo (DRC) and the International Union Against Tuberculosis and Lung Disease (The Union) piloted the program “Integrated HIV Care for Tuberculosis Patients Living with HIV/AIDS” (IHC) in health facilities that successfully implement the national tuberculosis program, as a contribution to expanding HIV care coverage. IHC followed WHO recommendation for antiretroviral therapy (ART). The National Health Policy of DRC stresses the systemic challenge posed by the imbalance introduced by funding related to the sixth Millennium Development Goal in the national health account, making the search for efficiency a priority. In response to the shortage of human resources in the health sector, patient follow-up was delegated to primary health care nurses supported by quarterly medical supervision after The Union's approach.1 Shifting ART monitoring to nurses requires robust criteria for diagnosing treatment failure.2 As on-site CD4 counts posed serious logistic and maintenance challenges, we piloted the introduction of virological monitoring before the publication of the 2013 WHO recommendations for monitoring ART.3
The estimated HIV prevalence of 1%–1.2%4 and weak laboratory infrastructure in DRC may not justify an extensive decentralization of technology for viral load (VL) testing. Dried blood spots (DBS) have proven a suitable matrix for both VL quantification and genotypic drug resistance testing.5 DBS can be safely shipped6 to laboratory hubs where testing can be sustained, and test throughput and deployment of adequately qualified laboratory personnel optimized.7
We previously validated that DBS can be stored up to 4 weeks at ambient temperature (20°C) then kept frozen until RNA is quantified or genotypic drug resistance tested.8 We also previously optimized storage and RNA extraction methods.9 To test the operational feasibility of VL monitoring under program conditions, we conducted our study in the 3 district hospitals and 10 health centers that participated in IHC in the Nord-Kivu province, 2000 km east of Kinshasa (DRC). These units provide a close approximation of the profile of first level health facilities in the country likely to provide HIV care on a regular basis, and therefore to monitor ART effectiveness. On average, 13% of tuberculosis patients and 1% of antenatal clinic attendants in these health facilities were HIV-positive, and more than 90% of patients on ART were alive at 48 months follow-up (IHC statistics, 2012). To test our programmatic implementation, we collected DBS samples in those peripheral care facilities and shipped them to central laboratory hubs for VL and genotypic resistance testing.
METHODS
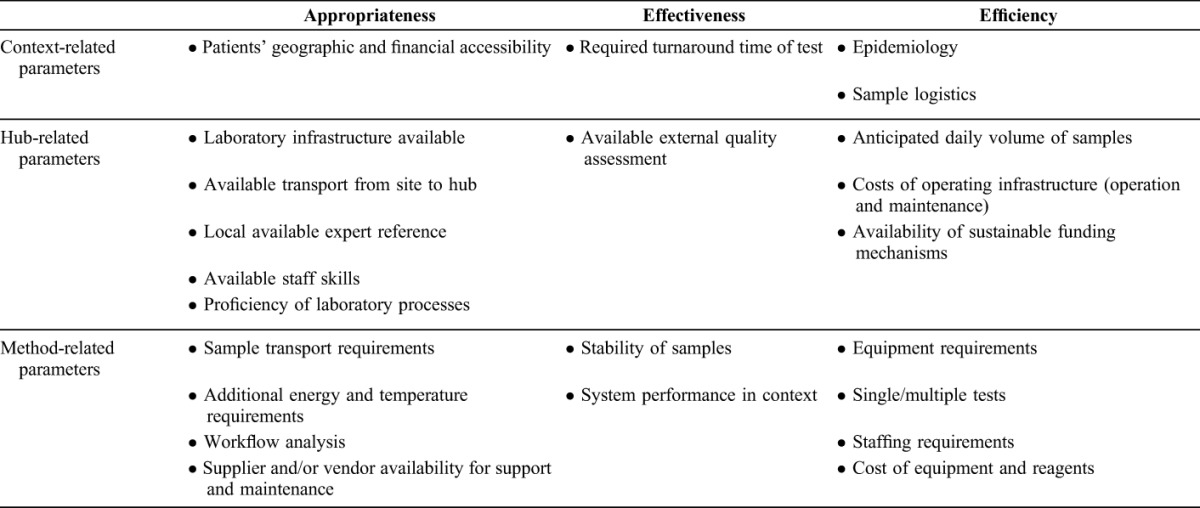
We applied WHO-recommended health technology assessment parameters,10 adapted the criteria specific to assessing HIV monitoring equipment in resource-constrained settings proposed by Stevens et al,11 and included the dimension of equity.12 Table 1 presents the set of criteria applied. The study was authorized by the ethics advisory boards of the School of Public Health, Kinshasa, and The Union and implemented as part of regular national program operation.
TABLE 1.
Qualitative Parameters for the Evaluation of the Tiered Laboratory Approach Using DBS to Centralize Samples in High-Throughput Laboratory Hubs
VL Hubs
A VL hub was established at the National AIDS Reference Laboratory in Kinshasa (LNRS), and a second hub for repeat VL quantification and genotyping at the Institut pour la Recherche et le Développement, Montpellier, France (UMI233), a WHO-accredited laboratory for HIV drug resistance testing on DBS. Before the study, UMI233 assessed the LNRS based on the qualitative parameters presented in Table 1. UMI233 also provided LNRS with technical support and external quality assurance. Routine operation of the LNRS was financed with a Global Fund grant to the National AIDS Program.
Study Sites and Patient Samples
Before patient enrollment, the regional TB-AIDS physician-supervisor trained laboratory technicians in handling DBS in 3 district hospitals and 10 health centers that participated at the IHC in the Nord-Kivu province. Between April 2011 and August 2012, 188 HIV-positive consenting adults treated with ART for at least 12 months in Nord-Kivu facilities were consecutively enrolled in the study. All patients reported no previous ART exposure; they were treated with the national first-line regime (stavudine/zidovudine, lamivudine, nevirapine/efavirenz). At patient enrollment, DBS (5 spots of 50 μL of whole blood) were prepared on Whatman Protein Saver 903 paper (GE-Healthcare, Pittsburgh, PA), dried at ambient temperature (20–28°C) for a minimum of 3 hours, placed in a zip-lock plastic bag with Minipax desiccant packs (Multisorb Technologies, Buffalo, NY) and a humidity indicator, and stored at −12°C in the freezer compartment of the facility fridge, after permission was obtained from the vaccination program that uses that space for its cool packs. Two DBS cards were prepared for each patient. DBS were collected at the next quarterly supervision round with anonymized test requests, shipped by courier to LNRS, then stored at −80°C until processed. One DBS card was subsequently shipped to UMI233 laboratory.
HIV VL Quantification
Both laboratories applied routine methods according to manufacturer's recommendations to quantify VL: UMI233 used the G2 generic real-time polymerase chain reaction assay (Biocentric, Bandol, France) to quality-assure LNRS results obtained with the m2000rt Real-Time HIV-1 assay (Abbott, Chicago, IL). The intrinsic characteristics and limits of detection of these assays were previously reviewed13 and found to be compatible with the thresholds we used in this study; they are not yet listed for use with DBS in DR Congo. Nucleic acids were recovered from DBS by incubation of 2 spots (total 100 μL) in 1.7 mL (m2000rt) or in 2 mL (G2 generic) of lysis buffer for 30 minutes under shaking. Paper particles were eliminated from recovered eluate by centrifugation. Clear supernatants were used for RNA extraction. For VL quantification with the G2 generic assay, the Qiagen extraction kit recommended for plasma samples was substituted by the NucliSens miniMag extraction system (BioMérieux, Craponne, France) because of Qiagen kit's low performance with DBS.9
VL results were returned by e-mail to the health facilities. Clinical decisions documented in patients' records were supervised at the next round. Constraints encountered during implementation were reported in supervision reports. Turnaround time was measured between DBS sampling and return of the result.
Genotyping Drug Resistance Testing
To ascertain the proportion of failures due to drug resistance, DBS from patients with VL ≥ 1000 copies per milliliter were tested at the UMI233 for drug resistance mutations (DRM). Nucleic acids were extracted using the Nuclisens miniMag method as described previously. Genotyping in the reverse transcriptase gene region followed the ANRS in-house protocol (www.hivfrenchresistance.org/ANRS-procedures.pdf). Polymerase chain reaction products were directly sequenced using the BigDye Terminator v3.1 Cycle Sequencing kit (Applied Biosystems, Carlsbad, CA). All sequences were checked for quality assurance using the calibration population resistance sequence quality analysis tool (http://cpr.stanford.edu) before further analyses. The ANRS interpretation algorithm (www.hivfrenchresistance.org/2014/Algo-2014.pdf) was used to identify DRM and to predict antiretroviral drug resistance to the drugs of the current first-line ART. The full list of mutations for all genotyped samples along with the VL results from each assay, HIV-1 subtypes, and drug treatment details (ART regimen and duration) is presented as Supplemental Digital Content 1, http://links.lww.com/QAI/A751.
Nucleotide Sequences Accession Numbers and List of Mutations
All newly HIV-1 sequences have been deposited in the Genbank Nucleotide Sequence database under accession numbers KT315948-KT316002.
Data Analysis
We represented VL results above 1000 copies per milliliter obtained with both m2000rt and the G2 generic assays with linearity plot (expressed in log10-transformed copies/mL). Correlation between assays was measured by a Pearson correlation test. Then, for bias and agreement measurements, we analyzed VL values using the Bland–Altman approach14 at both 1000 and 5000 copies per milliliter VL thresholds. The Bland–Altman graph plots the difference between individual VL values from both techniques against the mean.
RESULTS
Implementation and Patient Characteristics
Of 188 patients enrolled in the study, 11 (5.8%) did not fulfill all the inclusion criteria and were excluded. Of the remaining 177 patients, women predominated (N = 119, 67%). The median age was 40 years [interquartile range (IQR): 35–46]. The median duration on ART was 29 months (IQR: 19–44). No particular difficulty related to DBS preparation or shipping was reported. The median time between collection of the samples and reception at the LNRS was 37 days (IQR: 9–59). All samples were suitable for extraction.
Samples shipped to UMI233 in Montpellier were analyzed on reception. The LNRS in Kinshasa stopped VL analyses when the Global Fund temporarily suspended grant disbursements in 2011. Stored DBS samples could only be analyzed in February 2013 after the m2000rt system had been recalibrated.
VL Quantification
VLs below 1000 copies per milliliter were reported for 124/177 (70.1%) samples analyzed with the m2000rt assay and for 92/177 (51.4%) samples analyzed with the G2 generic assay. No HIV was detected with the G2 generic assay in 30 of these samples. As G2 generic technique also detects proviral DNA, this warranted complementary assessment of these patients' HIV status, and they were retested with INNO-LIA HIV-I/II Score (Fujirebio Europe, Gent, Belgium) for the presence of HIV antibodies. Eight (4.5%) patients were confirmed HIV-negative and were excluded from the study.
We found a positive correlation between paired VL results (expressed in log10 copies/mL) with a coefficient of determination r2 of 0.772 (Pearson test, P < 0.0001), taking into account only samples with VL reported as >1000 copies per milliliter with both assays (N = 48) (Fig. 1). Bland–Altman analyses (Fig. 2) indicated a better correlation and agreement at the 5000 copies per milliliter threshold and returned a mean difference between VL measures of 0.53 log.
FIGURE 1.
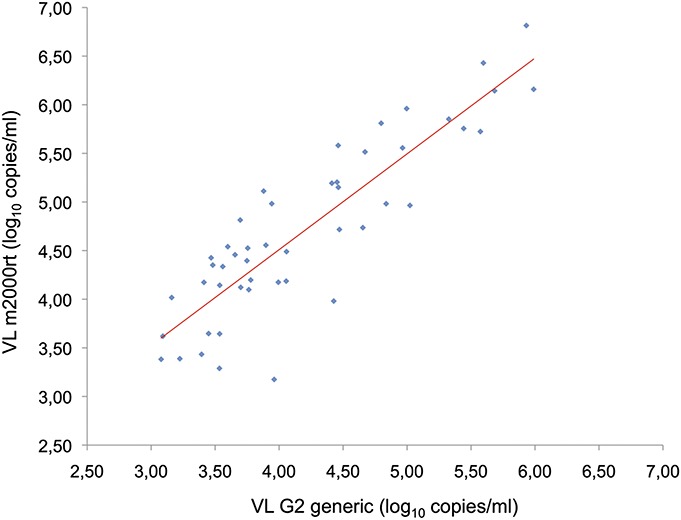
Correlation between paired VL measurements obtained with the m2000rt (Abbott, Chicago, IL) and G2 generic (Biocentric, Bandol, France) assays for samples with VL above 1000 copies per milliliter (N = 48). The solid line represents the fitted regression. Pearson coefficient of determination r2 = 0.772, P < 0.0001.
FIGURE 2.

Bland–Altman plots of agreement between VLs quantified using the m2000rt (Abbott, Chicago, IL) and G2 generic (Biocentric, Bandol, France) assays at a threshold of 1000 copies per milliliter (A) (N = 48) and 5000 copies per milliliter (B) (N = 31). The solid red line represents the mean bias on the difference. The gray lines represent the limits of agreement (Sup limit = mean difference + 2 standard deviations; Inf limit = mean difference − 2 SDs).
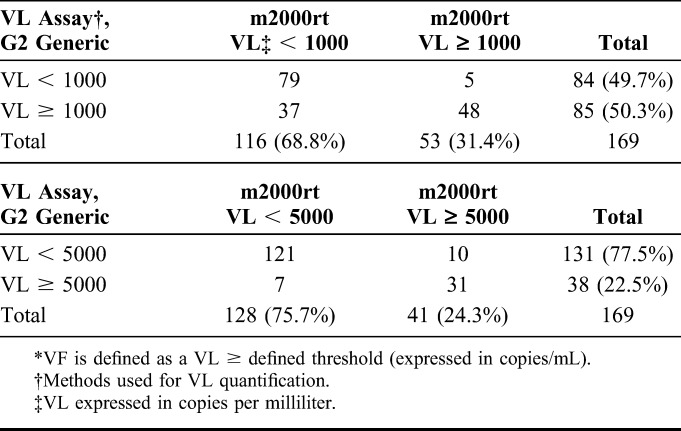
The concordance of detecting virological failure (VF) between the 2 systems was 75.1% (127/169, Kappa coefficient: 0.50) at the 1000 copies per milliliter threshold and 89.9% (152/169, Kappa coefficient: 0.72) at 5000 copies per milliliter (Table 2). The concordance between the 2 systems decreased to 69.2% (117/169, Kappa coefficient: 0.47) when VL samples were classified in <1000, 1000–4999, and ≥5000 copies per milliliter categories. This lowest concordance was essentially due to the 47 samples (27.8%) that were classified in the 1000–4999 copies per milliliter category by the G2 generic system compared with only 12 (7.1%) by the m2000rt assay.
TABLE 2.
VF* Based on VL at the 1000 and 5000 copies per milliliter Thresholds
Genotypic Drug Resistance Testing
At the VF threshold of 1000 copies per milliliter, genotyping was successful for 75.5% and 62.4% of samples analyzed with the m2000rt and the G2 generic systems, respectively (Table 3). When the m2000rt assay was used, DRM were identified in 25 samples, resulting in a minimum (as we could not genotype all samples) of 47.2% of patients with VF harboring resistance mutations, and 14.8% of drug resistance prevalence in patients on ART. With the G2 generic system, 26 samples with DRM were identified, resulting in a minimum of 30.6% of patients with VF harboring resistance mutations, and 15.4% of drug resistance prevalence in patients on ART. At the VF threshold of 5000 copies per milliliter, genotyping was successful for 82.9% and 78.9% of analyzed samples, and drug resistance was found in 24 (14.2%) and 18 (10.6%) samples with the m2000rt and G2 generic systems, respectively.
TABLE 3.
VF* and Genotypic Resistance to Antiretroviral Treatment Prevalence
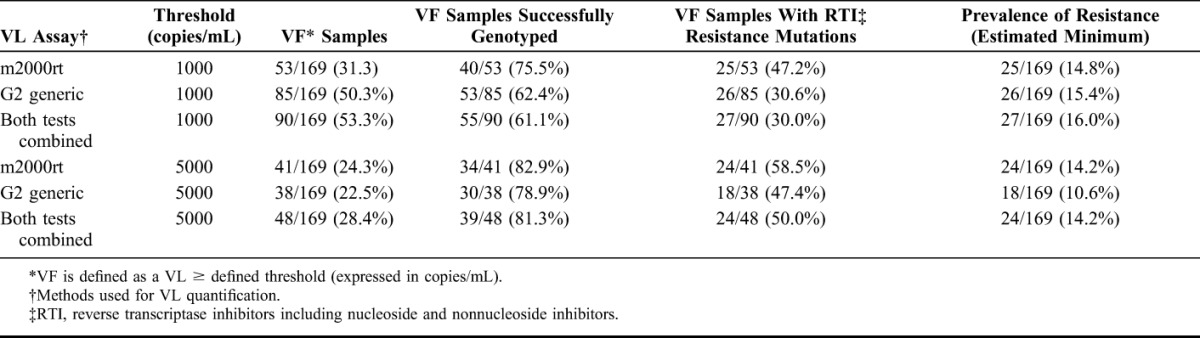
Using the criterion of a VF threshold at 1000 copies per milliliter for both VL quantification assays, a total of 90 DBS were tested for DRM by genotyping (Table 3). Among those patients, 55 were successfully genotyped and mutations associated with drug resistance were observed in 27 of them. Resistance mutations were found in 2 patients (patient ID VIR29 and MAN02) with VL below 1000 copies per milliliter with the m2000rt system but above 1000 copies per milliliter with the G2 generic system, and in 1 patient (patient ID MAB06) with VL below 1000 copies per milliliter with the G2 generic system but above 5000 copies per milliliter with the m2000rt system (Table, Supplemental Digital Content 1, http://links.lww.com/QAI/A751). At a threshold of 1000 copies per milliliter, the m2000rt and the G2 generic assays detected very similar percentage of resistance mutations [92.6% (25/27) and 96.3% (26/27), respectively], but the G2 generic assay involved a higher numbers of VF samples selected for genotyping resistance, 85/169 (48%) compared with 53/169 (31.3%) with the m2000rt assay. At a threshold of 5000 copies per milliliter, the m2000rt system detected 24/27 (88.9%) of resistant strains and the G2 generic system 18/27 (66.7%).
Drug Resistance Analysis
Details of the 55 characterized patients are given as supplemental data content (Table, Supplemental Data Content 1, http://links.lww.com/QAI/A751 which presents our findings on DRM). Among resistance mutations for nucleoside reverse transcriptase inhibitors, M184V was most common and was found in 21/27 resistant patients (78%). Among resistance mutations for nonnucleoside reverse transcriptase inhibitors, K103N was most frequent and was detected in 18/27 resistant patients (67%). All others mutations were found in 9 or less patients.
On-Site Patient Follow-up
VL results were returned to the TB-AIDS supervisor with the recommendation to review adherence of all patients with VL ≥ 1000 copies per milliliter. As the G2 generic results were available first, this effort was required for 32 more patients (160%) than would have been required on the basis of results obtained with the m2000rt system. As genotypic resistance results became available, the 27 patients with VF due to drug resistance were prescribed second line ART, after possible adherence issues were addressed.
The 8 HIV-negative patients were informed of the new finding and ART was discontinued, albeit with difficulty to explain that the initial AIDS diagnostic was actually erroneous and the months of ART unnecessary.
DISCUSSION
Equitable access to health technology is critical for universal health coverage.15 Despite renewed interest in health system issues and growing attention by global funding mechanisms,16 health technology assessments remain little used in the global health context. The concept of using DBS for centralizing VL samples at reference laboratories in resource-constrained environments has been proven for some years,5,7–9,17 but our review of the PubMed and Google Scholar databases found no report of its successful roll-out under programmatic conditions. Its application to the DRC context and appropriation by the management of the National AIDS Control Program demonstrated its feasibility under particularly challenging programmatic conditions. By doing so, it balanced technology challenges with systemic challenges of equal importance.
The approach based on currently available technology permits to decentralize VL measurement to all types of peripheral health facilities where ART is prescribed. By centralizing technology where it can be sustained, and standardizing monitoring procedures, it also reduces the technical complexity of ART monitoring.18 It requires minimal additional resources at care level and is supported by the integrated delivery of tuberculosis and HIV care in a primary health care setting. Quarterly supervision is essential for the logistical component of this approach but would in any case be a condition for ART task-shifting. Centralizing VL measurements in laboratory hubs significantly reduces the cost and complexity of the laboratory supply chain and the requirements for highly trained laboratory personnel. The effectiveness of such hubs will rest not only on a capacity to operate and sustain the test but also on the conjunction of this capacity with the supervision circuit. A similar nodal approach guided the development of the Basic Management Unit to which the so-called Directly Observed Treatment Short course strategy for tuberculosis control of the WHO owes part of its success1 (several peripheral health facilities share laboratory equipment in the facility where proficiency can be secured).
The interruption of services at the LNRS in Kinshasa during the study was due to a financing bottleneck rather than to technology constraints, recalling attention to a critical weakness in the financing of laboratory systems in Africa.19 When the financing constraints of laboratory hubs are effectively addressed, reliable information on the VL of patients on ART can be returned to peripheral clinics within an acceptable period. A 37-day median turnaround time may seem long, but in the context of chronic care with monthly consultations, and a decision-making process that involves a comprehensive adherence review that spans over weeks, it remains compatible with sound clinical practice.
Our results highlight the intrinsic variability between different types of VL assays20 and confirm that they are not equally suitable for testing DBS samples.21 Trained laboratory technicians can operate the m2000rt and the G2 generic systems equally well, but the G2 generic system requires more supervision and more experienced technicians. Savings from generic technology are also discounted by the current need for a different extraction kit for DBS. Furthermore, using the G2 generic assay at the 1000 copies per milliliter VF threshold (after the new 2013 WHO recommendations for monitoring ART3) would have imposed unnecessary efforts of reviewing adherence for 19% of our cohort and their care providers and an increased cost related to additional genotypic drug resistance testing, whereas at the 5000 copies per milliliter threshold, 25% of resistant strains would have been missed. Finally, our results also suggest that external quality assurance of VL quantification should be implemented using the same technology as used for initial quantification.17
The 4.5% false-positive diagnoses for HIV infection in our cohort are consistent with the 5%–10% range reported in Central Africa.22–24 This raises concerns about iatrogenesis and costs of treatment programs, and stresses a need to strengthen the quality assurance of HIV diagnosis. Beyond monitoring ART effectiveness, DBS provide a wider base for efficiencies that cost-effectiveness analyses should consider: Extended DBS sampling permits early infant diagnosis of HIV infection7 and facilitates quality assurance for patients diagnosed with HIV.25 Banked DBS provide a highly representative sampling base for monitoring HIV resistance not only in terms of geographic origin or care facility level but also as they allow comparison between VL suppression—a WHO Early Warning Indicator,26 and resistance, in the same patients. This would avoid costly ad hoc surveys and greatly facilitate the implementation of WHO recommendations on resistance surveillance.27
Current warnings about the high cost and low cost-effectiveness of VL monitoring28,29 may therefore be premature. Similar concerns about the introduction of ART a decade ago30,31 reminds us that decision to introduce a costly strategy with controversial cost-effectiveness primarily rests on political motivation. When the high laboratory costs of VL monitoring are offset by savings generated by increased efficiencies of laboratory systems, we may be closer than expected toward the hypothesis of the modeling study by Keebler et al32 “If the cost of VL monitoring falls, it might become a cost-effective strategy in the future, particularly in settings with high ART coverage.” The announcement by UNAIDS of a price per VL test below 10 US$ indicates that the future mentioned by Keebler is happening.33
CONCLUSION
We confirmed under regular program operation that the combination of DBS sampling and laboratory hubs for VL quantification provides the technology that currently allows for equitable and efficient monitoring of ART delivered at the primary care level in a resource-constrained environment. Although further studies are required to assess the impact of this approach on the roll-out of VL monitoring, it is critical that efforts in improving technologies be balanced with the search of solutions to sustain the funding of HIV laboratories. The high level of ART resistance observed among the study population draws attention to the urgent need to better understand the effectiveness of current ART regimes, as the services to deliver them are expanded and decentralized.
Supplementary Material
ACKNOWLEDGMENTS
The authors dedicate this publication to the memory of their colleague Dr Augustin Okenge Nyuma, MD, director of the National AIDS program of DR Congo who contributed to the design of the study and was instrumental in its endorsement by the Ministry of Health, and died during data collection and could not see his efforts materialize. The authors thank Mr. Samuel Edidi of LNRS for organizing the processing of the samples.
Footnotes
Supported by the European Commission under the grant SANTE 2007/141–838.
Presented in part as a poster at the 43rd Union World Conference on Lung Health, Kuala Lumpur, Malaysia, November 2012, and as an oral presentation at the seventh International Francophone Conference of AFRAVIH, Montpellier, France, April 2014.
The authors have no conflicts of interest to disclose.
Supplemental digital content is available for this article. Direct URL citations appear in the printed text and are provided in the HTML and PDF versions of this article on the journal's Web site (www.jaids.com).
REFERENCES
- 1.The Union. Management of Tuberculosis. A Guide to the Essentials of Good Practice. 6th ed Paris, France: IUATLD; 2010. Available at: http://www.theunion.org/what-we-do/publications/technical/management-of-tuberculosis-a-guide-to-the-essentials-of-good-clinical-practice. Accessed February 24, 2015. [Google Scholar]
- 2.World Health Organization. Task Shifting: Rational Redistribution of Tasks Among Health Workforce Teams. Geneva, Switzerland: 2008. Available at: http://www.who.int/healthsystems/TTR-TaskShifting.pdf. Accessed February 24, 2015. [Google Scholar]
- 3.World Health Organization. Consolidated Guidelines on the Use of Antiretroviral Drugs for Treating and Preventing HIV Infection. Recommendations for a Public Health Approach. Geneva, Switzerland: 2013. Available at: http://www.who.int/hiv/pub/guidelines/arv2013/download/en/. Accessed February 24, 2015. [PubMed] [Google Scholar]
- 4.UNAIDS. HIV and AIDS estimates (2013). Available at: http://www.unaids.org/en/regionscountries/countries/democraticrepublicofthecongo. Accessed February 20, 2015.
- 5.Johannessen A. Dried blood spots in HIV monitoring: applications in resource-limited settings. Bioanalysis. 2010;2:1893–1908. [DOI] [PubMed] [Google Scholar]
- 6.World Health Organization. Guidance on Regulations for the Transport of Infectious Substances 2013–2014. Geneva, Switzerland: 2012. Available at: http://www.who.int/ihr/publications/who_hse_ihr_2012.12/en/. Accessed February 20, 2015. [Google Scholar]
- 7.Lofgren SM, Morrissey AB, Chevallier CC, et al. Evaluation of a dried blood spot HIV-1 RNA program for early infant diagnosis and viral load monitoring at rural and remote healthcare facilities. AIDS. 2009;23:2459–2466. [DOI] [PMC free article] [PubMed] [Google Scholar]
- 8.Monleau M, Butel C, Delaporte E, et al. Effect of storage conditions of dried plasma and blood spots on HIV-1 RNA quantification and PCR amplification for drug resistance genotyping. J Antimicrob Chemother. 2010;65:1562–1566. [DOI] [PubMed] [Google Scholar]
- 9.Monleau M, Montavon C, Laurent C, et al. Evaluation of different RNA extraction methods and storage conditions of dried plasma or blood spots for human immunodeficiency virus type 1 RNA quantification and PCR amplification for drug resistance testing. J Clin Microbiol. 2009;47:1107–1118. [DOI] [PMC free article] [PubMed] [Google Scholar]
- 10.World Health Organization. Health Technology Assessment of Medical Devices (WHO Medical Device Technical Series). Geneva, Switzerland: 2011. Available at: http://whqlibdoc.who.int/publications/2011/9789241501361_eng.pdf. Accessed February 24, 2015. [Google Scholar]
- 11.Stevens W, Gelman R, Glencross DK, et al. Evaluating new CD4 enumeration technologies for resource-constrained countries. Nat Rev Microbiol. 2008;6:S29–S38. [DOI] [PubMed] [Google Scholar]
- 12.Tugwell P, de Savigny D, Hawker G, et al. Applying clinical epidemiological methods to health equity: the equity effectiveness loop. BMJ. 2006;332:358–361. [DOI] [PMC free article] [PubMed] [Google Scholar]
- 13.Parkin NT. Measurement of HIV-1 viral load for drug resistance surveillance using dried blood spots: literature review and modeling of contribution of DNA and RNA. AIDS Rev. 2014;16:160–171. [PubMed] [Google Scholar]
- 14.Bland JM, Altman DG. Statistical methods for assessing agreement between two methods of clinical measurement. Lancet. 1986;1:307–310. [PubMed] [Google Scholar]
- 15.Chalkidou K, Marten R, Cutler D, et al. Health technology assessment in universal health coverage. Lancet. 2013;382:e48–e49. [DOI] [PubMed] [Google Scholar]
- 16.The Global Fund. Report of the technical review panel and the secretariat on round 10 proposals, 2010. Available at: http://www.theglobalfund.org/en/trp/reports/. Accessed February 24, 2015.
- 17.Greig J, du Cros P, Klarkowsi D, et al. Viral load testing in a resource-limited setting: quality control is critical. J Int AIDS Soc. 2011;14:23. [DOI] [PMC free article] [PubMed] [Google Scholar]
- 18.Gericke CA, Kurowski C, Ranson MK, et al. Intervention complexity—a conceptual framework to inform priority-setting in health. Bull World Health Organ. 2005;83:285–293. [PMC free article] [PubMed] [Google Scholar]
- 19.Petti CA, Polage CR, Quinn TC, et al. Laboratory medicine in Africa: a barrier to effective health care. Clin Infect Dis. 2006;42:377–382. [DOI] [PubMed] [Google Scholar]
- 20.Alvarez M, Chueca N, Guillot V, et al. Improving clinical laboratory efficiency: introduction of systems for the diagnosis and monitoring of HIV infection. Open Virol J. 2012;6:135–143. [DOI] [PMC free article] [PubMed] [Google Scholar]
- 21.Monleau M, Aghokeng A, Eymard-Duvernay S, et al. Field evaluation of dried blood spots for routine HIV-1 viral load and drug resistance monitoring in patients receiving antiretroviral therapy in Africa and Asia. J Clin Microbiol. 2014;52:578–586. [DOI] [PMC free article] [PubMed] [Google Scholar]
- 22.Klarkowski DB, Wazome JM, Lokuge KM, et al. The evaluation of a rapid in situ HIV confirmation test in a programme with a high failure rate of the WHO HIV two-test diagnostic algorithm. PLoS One. 2009;4:e4351. [DOI] [PMC free article] [PubMed] [Google Scholar]
- 23.Aghokeng AF, Mpoudi-Ngole E, Dimodi H, et al. Inaccurate diagnosis of HIV-1 Group M and O is a key challenge for ongoing universal access to antiretroviral treatment and HIV prevention in Cameroon. PLoS One. 2009;4:e7702. [DOI] [PMC free article] [PubMed] [Google Scholar]
- 24.Shanks L, Klarkowski D, O'Brien DP. False positive HIV diagnoses in resource limited settings: operational lessons learned for HIV programmes. PLoS One. 2013;8:e59906. [DOI] [PMC free article] [PubMed] [Google Scholar]
- 25.Thapa B, Koirala S, Upadhaya B, et al. National external quality assurance scheme for HIV testing using dried blood spot: a feasibility study. SAARC journal of tuberculosis, lung diseases and HIV/AIDS. 2011;8:23–27. [Google Scholar]
- 26.Bennett DE, Jordan MR, Bertagnolio S, et al. HIV drug resistance early warning indicators in cohorts of individuals starting antiretroviral therapy between 2004 and 2009: World Health Organization global report from 50 countries. Clin Infect Dis. 2012, 54(suppl 4):S280–S289. [DOI] [PMC free article] [PubMed] [Google Scholar]
- 27.World Health Organization. Surveillance of HIV Drug Resistance in Adults Receiving ART (Acquired HIV Drug Resistance). Geneva, Switzerland: 2014. Available at: http://apps.who.int/iris/bitstream/10665/112801/1/9789241507073_eng.pdf?ua=1. Accessed February 24, 2015. [Google Scholar]
- 28.Kahn JG, Marseille E, Moore D, et al. CD4 cell count and viral load monitoring in patients undergoing antiretroviral therapy in Uganda: cost effectiveness study. BMJ. 2011;343:d6884. [DOI] [PMC free article] [PubMed] [Google Scholar]
- 29.Boyer S, March L, Kouanfack C, et al. Monitoring of HIV viral load, CD4 cell count, and clinical assessment versus clinical monitoring alone for antiretroviral therapy in low-resource settings (Stratall ANRS 12110/ESTHER): a cost-effectiveness analysis. Lancet Infect Dis. 2013;13:577–586. [DOI] [PubMed] [Google Scholar]
- 30.Ainsworth M, Teokul W. Breaking the silence: setting realistic priorities for AIDS control in less-developed countries. Lancet. 2000;356:55–60. [DOI] [PubMed] [Google Scholar]
- 31.Marseille E, Hofmann P, Kahn J. HIV prevention before HAART in sub-Saharan Africa. Lancet. 2002;359:1851–1856. [DOI] [PubMed] [Google Scholar]
- 32.Keebler D, Revill P, Braithwaite S, et al. Cost-effectiveness of different strategies to monitor adults on antiretroviral treatment: a combined analysis of three mathematical models. Lancet Glob Health. 2014;2:e35–e43. [DOI] [PMC free article] [PubMed] [Google Scholar]
- 33.UNAIDS. Landmark HIV diagnostic access program will save $150m and help achieve new global goals on HIV. 2014. Available at: http://www.unaids.org/en/resources/presscentre/pressreleaseandstatementarchive/2014/september/20140925prviralload. Accessed February 24, 2015.
Associated Data
This section collects any data citations, data availability statements, or supplementary materials included in this article.