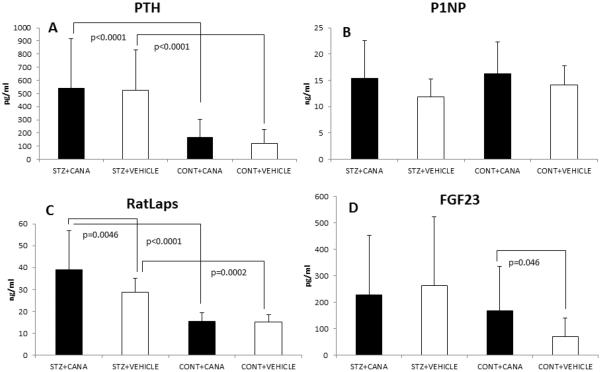
Figure 2. Bone biomarker analyses.
A comparison of serum bone biomarker concentrations (mean ± SD) across the four groups is shown; STZ+CANA, STZ+VEHICLE, CONTROL+CANA, CONTROL+VEHICLE. Pertinent, statistically significant between-group differences (and p-values) are delineated. Abbreviations: (A) PTH, parathyroid hormone; (B) P1NP, procollagen type 1 N-terminal propeptide; (C) RatLAPS, C-terminal telopeptides of type I collagen; (D) FGF23, fibroblast growth factor-23.

