

Abstract
Prevention and slowing of skeletal muscle atrophy with nutritional approaches offers the potential to provide far reaching improvements in the quality of life for our increasingly aging population. Here we show polyphenol flavonoid Epigallocatechin 3-gallate (EGCG), found in the popular beverage green tea (Camellia sinensis), demonstrates similar effects as the endogenous hormones IGF-1 and insulin in the ability to suppress action of the atrophy-promoting transcription factor Foxo1 through a net translocation of Foxo1 out of the nucleus as monitored by nucleo-cytoplasmic movement of Foxo1-GFP in live skeletal muscle fibers. Foxo1-GFP nuclear efflux is rapid in IGF-1 or insulin, but delayed by an additional 30 min for EGCG. Once activated, kinetic analysis with a simple mathematical model shows EGCG, IGF-1 and insulin all produce similar apparent rate constants for Foxo1-GFP unidirectional nuclear influx and efflux. Interestingly, EGCG appears to have its effect at least partially via parallel signaling pathways that are independent of IGF-1’s (and insulin’s) downstream PI3K/Akt/Foxo1 signaling axis. Using the live fiber model system, we also determine the dose-response curve for both IGF-1 and insulin on Foxo1 nucleo-cytoplasmic distribution. The continued understanding of the activation mechanisms of EGCG could allow for nutritional promotion of Green Tea’s anti-atrophy skeletal muscle benefits and have implications in development of a clinically significant parallel pathway for new drugs to target muscle wasting and the reduced insulin receptor sensitivity which causes Type II Diabetes Mellitus.
Keywords: Green Tea, EGCG, Foxo1, IGF-I, Insulin, Skeletal muscle
Graphical Abstract
1.0 Introduction
Preventing, slowing and reversing skeletal muscle atrophy offers the potential to substantially improve the quality of life for our increasingly aging population. Despite our best research efforts, we are still unable to reverse the annual decline in skeletal muscle mass that begins to occur in our third decade of life, with a disproportionately larger decline of lower limb muscles of about twice that of upper limb [11,16], leading to impaired mobility and increased risk of falls and fractures. In addition to the primary function of force generation for movement, skeletal muscle plays an equally important role in maintenance of homeostasis through regulation of metabolically critical compounds such as amino acids, growth hormones, fatty acids, and glucose [3]. Considering that skeletal muscle constitutes 40–50% of the overall body mass in humans [20], its role as a homeostatic regulator of the internal environment within the body is critical. Disruption of homeostasis by diseases such as cancer, renal failure, sepsis, or diabetes leads to significant skeletal muscle atrophy (sarcopenia or cachexia) [3]. Disease induced loss of muscle mass further compounds the disease condition, creating a negative cascade, as less muscle mass is available to maintain normal metabolism.
The DNA binding forkhead domain transcription factor known as forkhead box class O (Foxo) family is involved with cellular signaling of energy metabolism (fatty acid oxidation/glycolytic flux), mitochondrial transcription, and cellular survival (atrophy, apoptosis) [20]. Four isoforms of Foxo (Foxo1, Foxo3A, Foxo4, and Foxo6) are found in skeletal muscle, with Foxo1 & Foxo3A implicated in muscle atrophy due to their promoting transcription of proteasome related E3 ubiquitin ligases, MAFbx/atrogin-1 and MuRF1 [20,21].
Our study utilizes Foxo1 tagged with a green fluorescent protein (GFP) to provide a visual indication of where within the muscle fiber (nucleus or cytoplasm) Foxo1 is located, thereby providing an indication of its intra nuclear localization for transcriptional action. Within the cytoplasm, phosphorylation of Foxo1 by activated Akt results in phosphorylation of three conserved residues [28] which causes the nuclear localization signal (NLS) to be secluded on Foxo1, preventing translocation into the nucleus and activity as a transcription factor. Within the nucleus, phosphorylation of Foxo1 by activated Akt results in Foxo1 unbinding from DNA, exposing the nuclear export signal (NES) for translocation out of the nucleus [5,24]. A predominate pathway implicated for the deactivation of Foxo1 transcriptional effects is the IGF receptor / phosphatidylinositol 3-kinase (PI3K) / Akt (PKB) pathway, which causes phosphorylation of Foxo1 in both cytoplasm and nuclei [26], and a reduction in nuclear localization [9,28]. When Foxo1 is activated and localized inside the nucleus it induces gene transcription by binding to DNA sites with its conserved 100 residue DNA binding domain known as the forkhead domain [20,22]. The nuclear versus cytoplasmic balance of Foxo1, is critical to controlling protein breakdown and in effect prevention of skeletal muscle death and atrophy [9].
The polypeptide growth factors/hormones IGF-1 and insulin continue to be well researched for their critical regulation of development, energy metabolism, and cellular growth [2] in addition to their well documented role in glucose, protein, and lipid metabolism [2]. Circulating IGF-1 is produced primarily in the liver stimulated and from growth hormone (GH) released by the anterior pituitary gland [18]. However IGF-1 is also produced by multiple non-hepatic tissues including skeletal muscle, where it functions as an autocrine/paracrine growth factor, independent of GH [18]. In contrast to IGFs, insulin is produced solely by beta cells located in the pancreas. Interestingly, IGF and insulin signaling both converge and activate the same PI3K/Akt signaling pathway which helps determine the balance of protein synthesis (through mTOR & GSK3 signaling) and protein degradation (Foxo, focus of this study). IGF1 and insulin share about 50% homology and have been shown to elicit similar hypoglycemic responses [4], although each has specific biological responses which are thought to be a result of differences in receptor expression and tissue-specific downstream targets [23,25]. Since the topic of IGF-1 and insulin-specific responses is an active and ongoing researched field, we generated data in live adult mouse skeletal muscle fibers, to determine the relative efficacies (dose-response EC50) of adding IGF-1 or insulin on Foxo1 nuclear exit.
Complementary/nutritional medical approaches are studied due to their potential to provide far reaching improvements in quality of life in a cost-effective manner. Green tea (Camellia sinensis) is a popular beverage that previous studies have shown can have benefits in fibroblast (3T3-L1) [13], cancer [27], and endothelial cell lines [14], as well as skeletal muscle [1,12,17]. Within green tea, the compound Epigallocatechin-3-gallate (EGCG) makes up about 41% of the total catechins (flavonoid polyphenols) soluble in hot water [8]. Here we demonstrate EGCG’s ability to cause a similar Foxo1 deactivation response (translocation of Foxo1 from nuclear to cytoplasm) as both of the well studied endogenous growth-promoting hormones, IGF-1 and insulin, in adult skeletal muscle fibers. The signaling pathways of IGF-1, insulin, and EGCG each converge on activation of the kinase Akt, causing Foxo1 phosphorylation and the net effect of Foxo1 removal from the muscle fiber nuclei. Interestingly, Akt inhibitors were not able to fully prevent EGCG from mediating Foxo1 translocation, thereby indicating that EGCG may not rely entirely on the Akt signaling axis to mediate Foxo1 translocation. In addition, when ROS signaling was increased with H2O2 the ability of EGCG to mediate Foxo1 translocation was not affected. However when the ROS inhibitor, NAC was used, it did show a minor effect in reducing EGCG’s ability to mediate Foxo1 translocation. Fully understanding the mechanisms of EGCG signaling both upstream of Akt, as well as by any previously unknown parallel signaling pathways, could have implications in slowing muscle atrophy and in providing a clinically significant parallel pathway for the reduced insulin receptor sensitivity which causes Type II Diabetes Mellitus.
2.0 Materials and Methods
2.1 Materials
Adeno virus adFoxo1-GFP (gift from Dr. Joseph Hill, UT Southwestern Medical Center, TX). Insulin (Bovine, Sigma Aldrich I1882, St. Louis, MO), IGF-1 (Mouse, Sigma Aldrich I8779, St. Louis, MO) and (−)-Epigallocatechin gallate (EGCG) ≥95% (Sigma Aldrich E4143, St. Louis, MO). Akt inhibitor Akt-I-1,2 (Calibochem 124017, Billerica, MA) and PI3K inhibitor LY294002 (Cell Signaling 9901, Danvers, MA). N-acetyl-L-cysteine (NAC) ≥99% (Sigma Aldrich A7250, St. Louis, MO).
2.2 FDB Fiber Preparation and Adenoviral Infection
All experimental procedures use individual muscle fibers dissociated from flexor digitorum brevis (FDB) skeletal muscle isolated from adult (4 – 8 wk old) female CD1 mice, in protocols approved by the University of Maryland Institutional Animal Care and Use Committee, and as previously described [15,22,26]. Figure 1 summarizes the experimental procedures used for culture and Foxo1-GFP expression (left side) and the general imaging protocol at day 3 (right side) used to acquire data shown below. Briefly, dissected FDB muscle was digested in serum-free MEM media containing collagenase type I (Sigma Aldrich C0130) for 2 h at 37° C. MEM w/10% FBS was introduced to neutralize the collagenase activity. Using a round tip pipette the fibers were gently dissociated and individual muscle fibers (~40/chamber) were plated on a four chamber glass bottom dish (InVitroScientific D35C4-20-1-N) with laminin coating (Invitrogen 23017-015). The four chamber dishes allow all fibers to experience the same growth conditions (temperature; CO2; etc) yet remain isolated to allow four unique experimental solution protocols. To remove any residual growth hormones introduced during the collagenase neutralization step, the fibers were washed three times and cultured in serum-free MEM with HEPES (Invitrogen 12360-038) and 2mM L-glutamine (Sigma Aldrich G5763). Following the washes, 2 uL of purified adenovirus adFoxo1-GFP was introduced to infect the fibers and express Foxo1-GFP. The fibers were incubated for 48 – 72 h following virus addition before imaging.
Figure 1. Summary of experimental protocol.

Culture and Foxo1-GFP expression protocol (left side) and the general imaging protocol at Day 3 (right side) used to acquire data shown in Figs. 2, 3, and 5 – 7.
2.3 Confocal fluorescence imaging Foxo1-GFP in living FDB muscle fibers
For studies of time course, 30–40 min before imaging, the dish of cultured fibers was removed from the incubator and medium was removed and replaced three times with 37° C, L-15 (Invitrogen). For IGF1/insulin dose response data, the dish of cultured fibers was removed from the incubator and medium was replaced at the start of the imaging (30 – 40 min after removal from the incubator) with the same serum free MEM with HEPES (Invitrogen 12360-038) with 2 mM L-Glutamine (Sigma Aldrich G5763, St. Louis, MO).
The culture dish containing 4 compartments of Foxo1-GFP expressing fibers was placed on an Olympus IX70 inverted microscope with Olympus FLUOVIEW 500 laser scanning confocal imaging system previously described [22,26]. The excitation wavelength was 488 nm, which with a 505 nm long pass emission filter monitored the GFP fluorescence. We acquired a time series of high spatial resolution fluorescence confocal images at 15 min intervals (600× optical magnification & 3× digital zoom) before and after pharmacological perturbations of 3 day old culture fibers expressing exogenous Foxo1-GFP.
2.4 Fluorescence Image Analysis
Using Image J software (NIH, Bethesda, MD), the confocal fluorescent microscope images were analyzed to calculate the mean nuclear pixel fluorescence (N), which is proportional to the mean nuclear concentration of Foxo1-GFP in selected nuclei as a function of time (Fig. 2A). All time course graphs presented here show the ratio (N/C) of the values of mean pixel fluorescence in Nuclear (N) to Cytoplasmic (C) regions determined as a function of time (Fig. 2B). Presenting the data as the ratio of N/C corrects for differences in the expression level of Foxo1-GFP from fiber to fiber. In addition, it allows for adjustments of laser intensity when the nuclear fluorescence signal becomes saturated. Previous studies have shown that under the conditions of the present work the level of Foxo1-GFP cytoplasmic fluorescence remains constant over the course of our experiments [22,26]. To compensate for variations in starting N/C ratios, the data were normalized to the average of the first three time points (recorded under “control” conditions) or the first two time points (recorded under “control” conditions). Figure 2B shows the regions of interest used for the quantification of the Nucleus (N) and Cytoplasm (C). The background (B) intensity was subtracted from both the Cytoplasm (C) and Nuclear (N) fluorescence intensity prior to calculating the N/C ratio at that particular recorded time point. In each experiment, 4–7 unique fibers were selected, with 1–2 nuclei selected from each fiber.
Figure 2. Time course fluorescent images of Foxo1-GFP translocation in live skeletal muscle fibers.

A: Fluorescent images of a representative mouse skeletal muscle fiber from each experimental group, showing Foxo1-GFP at 30 min. intervals and the visible reduction in nuclear intensities following addition of each of the experimental perturbation sets (10uM EGCG, 35uM insulin, or 13nM IGF-1) at time point 30 min. (indicated with *). B: Magnified image showing the representative areas of interest used in ImageJ for the quantification of the nuclear to cytoplasmic ratio (N/C) of Foxo1-GFP fluorescent intensities within the fiber. The absolute Background (B) intensity was subtracted from both the Nuclear (N) and Cytoplasm (C) fluorescent intensities.
3.0 Results
3.1 IGF-1, Insulin and EGCG cause a decrease in Foxo1 nuclear content
Throughout this study, skeletal muscle fibers cultured for three days after transduction with adenovirally expressive Foxo1-GFP, were manipulated as summarized in figure 1. In cultured skeletal muscle fibers, our laboratory has previously shown that the addition of IGF-1 to fibers washed with serum and growth factor-free solution (Fig 1) substantially decreases the nuclear content of GFP-tagged Foxo1 (Foxo1-GFP) via increased phosphorylation, resulting from activation of the upstream signaling kinase Akt [22]. Figure 2A shows a representative muscle fiber from each experimental group imaged at 30 min intervals. In the absence of added reagents, the nuclear fluorescence increases with time (Fig 2A, top row; 61) due to wash out of IGF-1 or IGF-1-like substance secreted by the fibers during the previous 2–3 days in culture [26]. Addition of IGF-1 (13nM) or insulin (35uM) at 30 min causes a rapid decrease in nuclear content of Foxo1-GFP, as shown by presence of dark nuclei at 60 and 90 min for IGF1 or insulin (Fig. 2A). In contrast, although EGCG (10uM) also causes a loss of nuclear fluorescence, its effect requires a longer time to develop (Fig 2A, bottom row). The Foxo1-GFP intensities for the Nucleus (N) and Cytoplasmic (C) areas (Fig. 2B) are used to calculate the N/C ratio for 4–7 muscle fibers, 1–2 nuclei per fiber, and the mean values of N/C for each condition are plotted as a function of time (Fig. 3A)(see methods). The N/C time course for control conditions show that the nuclear content of Foxo1-GFP increases steadily following removal from the incubator and medium change (Fig. 3A Black circles). The N/C time course shows that addition of either IGF-1 or insulin causes a rapid reduction in N/C (Fig. 3A, blue squares and red triangles) as compared to control (black circles). Introduction of EGCG also caused a reduction in Foxo1-GFP nuclear content, but the response was delayed (28 – 32 min) as compared to IGF-1 or insulin (Fig. 3A,B). To quantify the response delay between the rapid IGF-1/insulin responses and the slower EGCG induced response, we calculated the Decay Half Times for IGF-1 (11.5 min.), insulin (14 min.), and EGCG (42 min.) (Fig. 3B). The apparent Influx and Efflux rate constants were quantified (Fig. 3C and D) using computation modeling tools described previously [26]. As expected, the apparent Influx rate constant was reduced for all three experimental groups as compared to control and the apparent Efflux rate constant increased for all three experimental groups as compared to control (Fig. 3C and D).
Figure 3. EGCG, IGF-1, Insulin effects on Foxo1-GFP translocation, nuclear influx, and efflux rate constants.

A: Time courses of Foxo1-GFP N/C with the presence of various compounds. Four chamber skeletal muscle fiber culture dish removed from incubator and replaced with L-15 medium 30–40 min. before start of imaging (0 min). Fluorescent imaging of Foxo1-GFP recorded in 15 min. intervals, no compound added control (black circles, n=8), and experimental compounds added at 30min.; EGCG (10uM, green diamonds, n=8), IGF-1 (13nM, blue squares, n=9), or insulin (35uM, red triangles, n=9). B: Decay half times for IGF-1, insulin, and EGCG based on time course Foxo1-GFP N/C data shown in 3A. Calculated by taking the means of values obtained from the decay halftime (50% of Peak–Minimum recorded N/C) from individual records averaged and displayed in 3A. C: Calculation of apparent Influx rate constant (min−1) for Control, IGF-1, insulin, and EGCG based on time course Foxo1-GFP N/C data shown in 3A. D: Calculation of apparent Efflux rate constants (min−1) for Control, IGF-1, insulin, and EGCG based on time course Foxo1-GFP N/C data shown in 3A. Apparent Influx and Eflux values calculated in 3C and 3D use mathematical modeling techniques previously described by our group, Ref. 26. In short, these are means of values obtained from fits to the individual records averaged and displayed in 3A.
3.2 IGF-1 & Insulin Dose-Response on Foxo1 Nuclear Translocation
The dose-response EC50 for both IGF-1 (Fig. 4B) and insulin (Fig. 4D) on Foxo1 Nuclear content, were determined by adding varying concentrations of IGF-1 (Fig. 4A) or insulin (Fig. 4C), and recording the Foxo1-GFP N/C ratios before (black bars) and 120 min after (blue or red bars) the compound was added. The medium used in the experiment was MEM with pH buffers for both low and high ambient carbon dioxide levels, which allowed the dishes to be removed from the incubator and remain on the microscope stage for the two hour duration of this experiment without changing the culture medium [26]. As shown in previous control conditions, when the culture medium is changed without addition of IGF-1 or of insulin, the N/C ratio increases approximately 2.5 to 3 fold (Figs. 4A and C, columns with “0 pM added”). As the IGF-1 or insulin concentration is increased, the N/C fold increase is reduced (Figs. 4A and C). Three independent experiments were run with average values reported (Figs. 4A and C). The starting N/C ratios were normalized to 1.0, and the normalized fold increase is plotted against the log of the concentration (Figs. 4B and D). A sigmoidal single binding site curve was fit to the data, with the median point representing the Dose-Response EC50 of 31pM for IGF-1 upon Foxo1 (Fig. 4B) and dose-response EC50 of 227pM for insulin upon Foxo1 (Fig. 4D), indicating an approximately 7 fold higher affinity for IGF-1 compared to insulin.
Figure 4. IGF-1 & Insulin dose response curve for inhibition of Foxo1-GFP nuclear localization.

A: Response of Foxo1-GFP N/C ratio following two hour treatment with various concentrations of IGF-1. Four chamber skeletal muscle fiber culture dish removed from incubator and replaced with serum free MEM with HEPES and 2mM L-Glutamine just before adding varying concentrations of IGF-1. B: Single binding sigmoidal curve fit for determination of EC50 dose response of IGF-1 (31pM) Foxo1 activation. C: Response of Foxo1-GFP N/C ratio following two hour treatment with various concentrations of insulin. Similar protocol as in figure A. D: Sigmoidal curve fit for determination of EC50 dose response of insulin (227pM) Foxo1 activation.
3.3 Effect of EGCG Concentration on Suppression of Foxo1 Activity
The effect of EGCG concentration on suppression of Foxo1 activity (i.e., translocation out of the nucleus) was determined by addition of various concentrations (5uM, 10uM, 20uM, 50um, 100uM) of EGCG at 30 min after the start of image recording (Figs. 5A and B). An added EGCG concentration of 10uM was used throughout this study since it demonstrated a pronounced effect upon Foxo1 translocation without any observed damage to the fibers (Fig. 5A). Although 20uM ECGC displayed a marginally greater response and lower final steady state of Foxo1 N/C ratio, this concentration was not used because higher EGCG concentrations (50uM & 100uM) showed a deleterious effect, eliminating the ability to suppress Foxo1 activity (Fig. 5B) and appearing to cause damage to the muscle fibers, as suggested by the formation of vesicles (Fig. 5C, arrows in magnified 50uM insert). No vesicle formation was observed at 10 uM EGCG (Fig. 5C) or with IGF-1 or insulin (Fig. 5D) at any concentration used here.
Figure 5. Concentration dependence of EGCG effects on Foxo1-GFP and vesicle formation in live muscle fibers.

A: Time courses of Foxo1-GFP N/C with the presence of various concentrations of EGCG. Four chamber skeletal muscle fiber culture dish removed from incubator and replaced with L-15 medium 30–40 min. before start of imaging (0 min). Fluorescent imaging of Foxo1-GFP recorded in 15 min. intervals, no compound added control (black circles, n=5), and various concentrations of EGCG added at 30min., 5uM (blue squares, n=8), 10uM (green diamonds, n=8), or 20uM (red triangles, n=8). B: Time courses of Foxo1-GFP N/C with the presence of various concentrations of EGCG. Four chamber skeletal muscle fiber culture dish removed from incubator and replaced with L-15 medium 30–40 min. before start of imaging (0 min). Fluorescent imaging of Foxo1-GFP recorded in 15 min. intervals, no compound added control (same as A, black circles, n=5), and various concentrations of EGCG added at 30min., 10uM (green diamonds, n=5), 50uM (purple triangles, n=5), or 100uM (orange squares, n=4). C: Transmitted light images of a representative muscle fiber from lower (10uM) and higher (50uM) EGCG concentration groups, at the time point just before and 30 min. following treatment with the EGCG compound. Magnified insert shows the presence of vesicle structures that occur at the higher 50uM EGCG concentration (100uM not shown). No vesicle structures are observed from addition of IGF-1 (13nM) nor insulin (35uM). Results in A and B are averages from single experiments, similar results were seen in additional experiments.
3.4 Effects of Inhibiting the Akt Pathway on EGCG Mediated Foxo1 Translocation
The application of IGF-1 rapidly reduces Foxo1 nuclear concentration, as demonstrated in Fig. 3A and from our group’s previous work [22]. In addition from our group’s previous work [22] and within Figure 6, we have demonstrated the ability of the selective inhibitor of Akt 1 and Akt 2 (Fig. 6, orange squares) to fully inhibit the ability of IGF-1 to reduce Foxo1 nuclear concentration, suggesting that the Akt pathway is critical for IGF-1 suppression of Foxo1 nuclear activation. The same selective inhibitor of Akt 1 and Akt 2 appears to have a partial effect on mediating EGCG ability to reduce Foxo1 nuclear concentration (Fig. 6, red triangles) as compared to using EGCG only (green diamonds), suggesting the Akt pathway is at least partially used by EGCG for Foxo1 regulation and the possible presence of a parallel pathway which does not require Akt activity. Parallel positive controls were run in the same dish with Akt inhibitors only (Fig. 6, blue squares) demonstrating the inhibitors ability to cause a steady increase in Foxo1 activation above control (black circles). Additional independent experimental runs support this data but were not used in averages due to differences in the time the inhibitors were added.
Figure 6. Effects of inhibiting PI3K/Akt pathway on EGCG mediated Foxo1 translocation.

Time courses of Foxo1-GFP N/C, with the presence of a selective inhibitor of Akt1/2 (Akt-I). Two parallel four chamber skeletal muscle fiber culture dishes removed from incubator and replaced with L-15 medium 30–40 min. before start of imaging (0 min). Fluorescent imaging of Foxo1-GFP recorded in 15 min. intervals, no compound added control (black circles, n=6), EGCG added at 30min. (10uM, green diamonds, n=9), Akt-I only added at 15min. (1uM, blue squares, n=5), Akt-I (1uM) added at 15min. and EGCG (10uM) added at 30min. (red triangles, n=6), Akt-I (1uM) added at 15min. and IGF-1 (13nM) added at 30min. (orange squares, n=4). Results are averages from single experiment, similar results were seen in additional experiments. Akt-I is present in the 3 upper data sets: Akt-I plus IGF1, Akt-I alone, Akt-I plus EGCG.
3.5 Reactive Oxidative Species Scavenger or ROS Producer effects upon EGCG ability to suppress Foxo1 Activity
The reactive oxidative species (ROS) producer, hydrogen peroxide (H202), was added to Ad-Foxo1-GFP infected muscle fiber cultures at concentrations of 4uM, 40uM, and 400uM, 30min. after start of imaging (Fig. 7A). At these concentrations, H202 caused no significant change in Foxo1-GFP nucleo-cytoplasmic distribution as compared to control. To determine whether the increase in the ROS environment affected EGCG’s ability to mediate Foxo1 activation, we monitored the effect of adding 40uM H202 at time point 15 min., followed by 10uM EGCG at time point 30min. (Fig. 7B, red triangles). As compared to EGCG addition under control conditions (Fig. 7B, green circles) there was no significant change in the ability of EGCG to reduce the Foxo1 N/C ratio when added in the presence of H202 (Fig. 7B, red triangles). To further test if the increased ROS environment created by 40uM H202 affected the IGF-1/PI3K/Akt signaling pathway, 40uM H202 was added at time point 15min., followed by IGF-1 at time point 30min. (Fig. 7B, blue squares), which had no effect on the ability of IGF-1 to cause the characteristically strong reduction in Foxo1 N/C ratio. A control adding only H202 at time point 15min. was also performed (Fig. 7B, black circles).
Figure 7. EGCG ability to mediate Foxo1-GFP translocation in reduced and increased ROS environments.

A: Time courses of Foxo1-GFP N/C with the presence of various concentrations of the strong cellular reactive oxygen species (ROS) generator Hydrogen Peroxide (H2O2). Four chamber skeletal muscle fiber culture dish removed from incubator and replaced with L-15 medium 30–40 min. before start of imaging (0 min). Fluorescent imaging of Foxo1-GFP recorded in 15 min. intervals, no compound added control (black circle, n=7), and concentrations of H2O2 added at 30min.; 4uM (pink triangles, n=7), 40uM (orange squares, n=7), 400uM (blue diamonds, n=9). B: Time courses of Foxo1-GFP N/C with the presence of a ROS generator, Hydrogen Peroxide (H2O2), with and without EGCG. Four chamber skeletal muscle fiber culture dish removed from incubator and replaced with L-15 medium 30–40 min. before start of imaging (0 min). Fluorescent imaging of Foxo1-GFP recorded in 15 min. intervals, H2O2 (40uM) added at 15min. (black circle, n=6), EGCG (10uM) added at 30min. (green diamonds, n=9), H2O2 (40uM) added at 15min. and IGF-1 (13nM) added at 30min. (blue squares, n=5), H2O2 (40uM) added at 15min. and EGCG (10uM) added at 30min. (red triangles, n=10). C: Time courses of Foxo1-GFP N/C with the presence of a ROS inhibitor, N-acetyl-L-cysteine (NAC) with and without EGCG. Values are averages from two independent experiments. Four chamber skeletal muscle fiber culture dish removed from incubator and replaced with L-15 medium 30–40 min. before start of imaging (0 min). Fluorescent imaging of Foxo1-GFP recorded in 15 min. intervals, no compound added control (black circle, n=11), EGCG (10uM) added at 30min. (green diamonds, n=9), NAC (1mM) added at 0min.(blue squares, n=15), NAC (1mM) added at 0min. and EGCG (10uM) added at 30min. (red triangles, n=12).
To test if a reduced ROS environment would affect EGCG’s ability to mediate Foxo1 activation, we performed an experiment adding the anti-oxidant N-acetyl-L-cysteine (NAC; 1mM) at 0 min. followed by 10uM EGCG at 30min. (Fig. 7C, red triangles). As compared to EGCG added to control fibers (Fig. 7C, green circles) there was a minor reduction in the ability of EGCG to reduce the Foxo1 N/C ratio, thus not entirely ruling out the possibility that a ROS generating signaling mechanism could be involved in EGCG/Akt/Foxo1 signaling. Controls with 1mM NAC (blue squares) and no added compounds (black circles) were also performed.
4.0 Discussion
4.1 IGF-1, Insulin and EGCG each cause a decrease in Foxo1 nuclear content
Foxo1 is a transcription factor that regulates the expression of the atrophy related genes, Atrogin1 and MuRF1, both of which are E3 ubiquitin ligases controlling muscle atrophy [20,21]. In the present study, we have made use of confocal fluorescent imaging of live, cultured, adult mouse skeletal muscle fibers to study nuclear-cytoplasmic translocation of GFP-tagged Foxo1. Here we demonstrate that insulin and EGCG cause a similar translocation of Foxo1-GFP from muscle fiber nuclei to the cytoplasm as that produced by IGF-1 [22,26; Fig. 3A]. However, in contrast to IGF-1 or insulin’s ability to rapidly induce a decline in the Foxo1 nuclear content (lower N/C ratio), EGCG’s actions on nuclear Foxo1-GFP are delayed by an additional 28 to 32 min as compared to IGF-1 or insulin, respectively (Fig. 3B). These results suggest that EGCG’s signaling pathway involves additional steps which add time to EGCG’s effect on Foxo1 translocation, compared to the pathway activated by IGF-1 and insulin binding to their plasma membrane receptors on the cell surface (Fig. 8, pathway indicated with “#”).
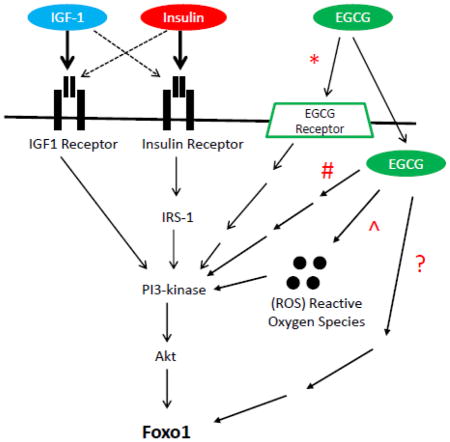
Figure 8. IGF & EGCG PI3K/Akt/Foxo signaling pathway.

Schematic representation of PI3K/Akt/Foxo signaling pathway as it relates to activation via IGF-1, insulin, and/or EGCG. IGF-1 and insulin activate the pathway through interaction directly with their respective cellular membrane receptor in addition to possible cross-reactivity (dashed line) of the respective ligand with the other’s receptor. From data presented in this study ECGC appears to act partially via the PI3K/Akt/Foxo axis (*, # and ^ in Fig ) as well as partially via an additional possible parallel pathway (? in Fig).
We have previously developed a mathematical modeling approach to extract the unidirectional apparent rate constants for Foxo1-GFP nuclear influx (kI′) and nuclear efflux (kE′) from the time course of Foxo1-GFP N/C ratio, both under control conditions and in the presence of IGF1 [26]. Using the same approach and model, the present results establish that during maximal activation following the initial delay, IGF-1, insulin and EGCG each produces similar apparent rate constants for Foxo1-GFP nuclear influx (Fig 3C) and efflux (Fig 3D).
4.2 Concentration dependence of IGF-1 & Insulin Effects on Foxo1 Nucleo-cytoplasmic distribution
Our laboratory and others have previously demonstrated the ability of IGF-1 to activate the IGF/PI3K/Akt axis, which phosphorylates Foxo1 through Akt’s kinase activity, and causes a net loss of nuclear Foxo1 due to reduced nuclear influx and increased nuclear efflux [3,22]. Similarly, insulin’s ability to activate the same IGF/PI3K/Akt signaling axis as IGF-1, and thus effect Foxo1 activity, is well established [23]. This similar convergence upon the same PI3K/Akt signaling pathway helps determine the balance of protein synthesis, via mTor and GSK3 pathways, and protein degradation via Foxo [10]. The specificity observed between responses to IGF-1 and insulin is thought to be a result of differences in receptor expression and tissue specific downstream targets [23]. However, there is considerable cross reaction of insulin with the IGF-1 receptor (IGF1R) and IGF-1 with the insulin receptor (IR), and there are also hybrid receptors with one IR subunit linked to one IGF1R subunit [2]. To compare the relative effectiveness of IGF-1 and insulin on Foxo1 translocation in adult skeletal muscle fibers, dose-response curves were generated for the steady state levels of Foxo1-GFP at the varying concentrations of IGF-1 or insulin (Figs. 4B and D). This yielded an EC50 of 31pM for IGF-1 (Fig. 4B) and 227pM for insulin (Fig. 4D). These values are within normal physiological levels [6,7]. It is well established that IGF-1 and insulin are able to interact with one another’s respective surface receptor [2] and subsequently initiate a response through the PI3K/Akt signaling axis (Fig. 8). Generation of new dose-response curves for both IGF-1 and insulin in the presence of blocking antibodies to the IGF-1 receptor could help establish the degree of cross talk which occurs between IGF-1 and insulin acting via the IGF-1 receptor. One interesting point regarding the dose response curves for both insulin and IGF1 is that neither exhibits any signs of biphasic binding response. Thus if either insulin or IGF-1 is binding to the other ligand’s receptor in addition to its own, then the affinity of both IGF-1 and insulin must be similar for both IGF-1R and IR.
4.3 Effect of EGCG Concentration on Suppression of Foxo1 Activity
We established the concentration dependence of EGCG effects on Foxo1-GFP, and show that 10uM of EGCG (Fig. 5A,B) was the optimal dose giving a robust Foxo1 response without causing cell damage. Interestingly, 10uM EGCG is the circulating level of EGCG in the plasma in animal studies in which pure EGCG is consumed orally [14]. Although in our studies, 20uM ECGC demonstrated a marginally increased response and lower final steady state of Foxo1 N/C ratio, it was not selected as our standard concentration level since EGCG concentrations higher then 20uM showed deleterious effects on fibers and prevent the efflux of nuclear Foxo1 (Fig. 5B). The deleterious effects of high concentrations of EGCG prevented us from determining an EC50 for the drug’s effects on nuclear Foxo1 as we previously performed with IGF-1 and insulin.
4.4 Effects of Inhibiting the PI3K/Akt Pathway on EGCG Mediated Foxo1 Translocation
The ability of EGCG to phosphorylate Foxo1 through activation of Akt, has been previously demonstrated in endothelial cells by western blot data with specific antibodies to Akt, phosphorylated Akt and phosphorylated Foxo1 [19]. In a recent study in rat muscle subjected to hind limb suspension to induce atrophy, a reduction of muscle weight of approximately 31% in fast plantaris (type II) muscle and approximately 34% in slow soleus (type I) muscle was observed [1]. When comparing EGCG treated fibers to non-treated controls, both fast and slow fiber types had increased phospho-Akt (fast fibers 125% increase, slow fibers 103% increase) following 14 days of muscle disuse atrophy [1]. However despite these similar increases of phospho-Akt, EGCG treatment was more effective for muscle mass recovery in fast (type II) plantaris muscle fibers versus no statistically significant effects of EGCG on muscle mass recovery in slow (type I) soleus muscle [1]. The difference in response, despite both fiber types having increased Akt activity suggests that in skeletal muscle, EGCG regulates Foxo1 activation independent of Akt. To test this hypothesis, we monitored the effects of using specific inhibitors of Akt1 and Akt2 on EGCG-mediated Foxo1-GFP translocation (Fig. 6). Our laboratory has previously demonstrated the addition of Akt1/2 kinase inhibitor [22] causes a net increase in the nuclear concentration of Foxo1-GFP and reduction in the level of phosphorylated Akt in adult skeletal muscle fibers. Here, we show that fibers receiving the Akt1/2 kinase inhibitor followed by EGCG treatment (Fig. 6, red triangles) exhibit a suppression of the rapid decrease in Foxo1 N/C ratio as compared to EGCG only positive control (green diamonds). However, EGCG still does reduce N/C when added in the presence of Akt-I (blue squares vs red triangles). These data support the idea that EGCG acts upon the Akt pathway in addition to through a parallel pathway independent of Akt kinase activation (Fig. 8, highlighted with “&” symbol).
4.5 Reactive Oxidative Species Scavenger or ROS Producer effects upon EGCG ability to suppress Foxo1 Activity
Polyphenols such as EGCG may be either anti-oxidants or pro-oxidants based on the structure and cellular redox state at the site where the polyphenol resides [14]. Due to this dual nature of polyphenols, EGCG has been reported to be both an anti-oxidant in fibroblasts and a pro-oxidant in cancer cell lines [14]. We used the ROS scavenger, NAC, and the ROS producer H2O2, to change the redox state of muscle fibers (Figs. 7B and C) to learn if EGCG would still be able to mediate the reduction in nuclear Foxo1 levels. Use of H2O2 to increase the ROS level appeared to have no effect upon the ability of EGCG to reduce Foxo1 in nuclei (Fig. 7B, red triangles), compared to EGCG treatment alone (green diamonds). Interestingly, the reduction of ROS with NAC (Fig. 7C, red triangles) appears to cause a minor inhibition in EGCG’s ability to mediate the reduction of Foxo1 in nuclei, suggesting some possible involvement of ROS in regulating the effects of EGCG in muscle (Fig. 8, highlighted with “^” symbol).
4.6 Comparison with our previous results for Foxo1-GFP nuclear fluxes
Our group has previously monitored [22] and mathematically modeled [26] Foxo1-GFP nucleo-cytoplasmic movements in adult muscle fibers under control conditions and in the presence of IGF1 to determine the values of the apparent rate constants kE′ for Foxo1-GFP unidirectional nuclear efflux and kI′ for unidirectional nuclear influx under each condition. The present values of kE′ in the presence of IGF-1 (Fig 3D) agree very closely with the values we previously reported for kE′ in the presence of IGF-1 [26]. Note that due to the much larger cytoplasmic than nuclear volume, the value of kE′ is equal to the rate constant of the observed change of the nuclear to cytoplasmic mean pixel fluorescence ratios (N/C) for Foxo1-GFP [26]. However, the fractional increase in kE′ in IGF-1 (or insulin or EGCG) compared to control conditions found here is only about one-third of the fractional increase of kE′ that we reported previously for IGF1 application. This is because the value for kE′ under control conditions in the present study was about 3 times larger than the control value of kE′ in our previous study [26].
We previously showed that the time course of Foxo1-GFP net nuclear influx under control conditions (following wash out of previous culture medium), required wash out of IGF1 or similar molecule apparently secreted into the medium by the cultured fibers. One possible explanation for the difference in control kE′ values in the present versus our previous study might be variable excretion of IGF1 into the medium prior to the experiment, and/or variable extent of wash out of the previously excreted IGF1 in the two sets of experiments. This would influence the rate of nuclear net accumulation of IGF1 during the control period. However, once excess IGF1 is added to the medium (Fig 3A), the nuclear efflux would correspond to that under maximal activation of efflux, which agrees between the present and previous results.
In contrast to kE′, which was about three-fold larger under control conditions in the present compared to the previous experiments, in our present study we find kI′ under control conditions (Fig 3C) to be about 60 % larger than in our previous report [26]. In principal, since Foxo1 nuclear influx (kI′) and efflux (kE′) are reciprocally determined by phosphorylation/dephosphorylation status in the cytoplasm and nuclei, we would anticipate reciprocal changes in kI′ and kE′ when comparing flux data results. The fact that this is not the case here may indicate that different enzymes are controlling the phosphorylation status of Foxo1 in the nuclei (and thus determining kE′) compared to those controlling Foxo1 phosphorylation in the cytoplasm (and thus determining kI′). This may be related to our previous conclusion from Akt or PI3K inhibitor studies under control conditions that the PI3K/Akt pathway may not be the primary controller of Foxo1 phosphorylation status under control conditions [26].
5.0 Conclusion
Using confocal fluorescent imaging of Foxo1-GFP in live adult skeletal muscle fibers, we were able to monitor the effects of the green tea compound, EGCG, in mediating the reduction (in nuclear levels) of the atrophy-related transcription factor, Foxo1. The effect of EGCG on Foxo1 is similar to the effects mediated by both of the critical, endogenous growth hormones, IGF-1 and insulin. Interestingly, EGCG appears to activate a parallel signaling pathway that is independent of IGF-1 and insulin’s PI3K/Akt signaling axis.
Further understanding of EGCG’s parallel signaling pathways could have implications both in slowing muscle atrophy as it relates to Foxo1 or, more broadly, in providing a clinically significant parallel pathway to IGF-1 or insulin signaling which may help provide an alternative clinical therapy for the reduced insulin receptor sensitivity associated with Type II Diabetes Mellitus.
Acknowledgments
Funding Sources: This work was supported by National Institute of Arthritis and Musculoskeletal and Skin Diseases (NIAMS) Grant R01-AR-056477. First author (RJW) was partially supported by NIAMS Training Grant T32 AR-007592 to the Interdisciplinary Program in Muscle Biology National Institute of General Medical Sciences Training Grant T32 GM-008181 to the Training Program in Integrative Membrane Biology, University of Maryland School of Medicine.
We thank Dr. Joseph Hill (University of Texas Southwestern Medical Center) for kindly providing the adenovirus coding for Foxo1-GFP. This work was supported by National Institute of Arthritis and Musculoskeletal and Skin Diseases (NIAMS) Grant R01-AR-056477. R.J.W. was partially supported by NIAMS Training Grant T32 AR-007592 to the Interdisciplinary Program in Muscle Biology National Institute of General Medical Sciences Training Grant T32 GM-008181 to the Training Program in Integrative Membrane Biology, University of Maryland School of Medicine.
Abbreviations
- EGCG
Epigallocatechin-3-gallate
- FDB
Flexor Digitorum Brevis
- Foxo
Forkhead box class O
- GFP
green fluorescent protein
- GSK3
Glycogen Synthase Kinase 3
- IGF-1
Insulin-like Growth Factor 1
- IGF1R
IGF-1 Receptor
- IR
Insulin Receptor
- MAFbx
muscle atrophy F-box
- mTOR
mechanistic Target of Rapamycin
- MuRF1
muscle-specific RING finger protein
- NAC
N-acetyl-L-cysteine
- PI3K
Phosphatidylinositol-3 kinase
Footnotes
Competing interests
The authors declare that they have no competing interests’
Authors’ contributions
M.F.S. and R.J.W. conceived the project; R.J.W. and S.J.R. carried out the experiments; R.J.W., S.J.R., and M.F.S. analyzed data, R.J.W., S.J.R., and M.F.S. drafted and edited the paper; all authors approved the final version of the manuscript. All experiments were performed in the laboratory of M.F.S. at the University of Maryland, Baltimore
Publisher's Disclaimer: This is a PDF file of an unedited manuscript that has been accepted for publication. As a service to our customers we are providing this early version of the manuscript. The manuscript will undergo copyediting, typesetting, and review of the resulting proof before it is published in its final citable form. Please note that during the production process errors may be discovered which could affect the content, and all legal disclaimers that apply to the journal pertain.
Contributor Information
Robert J Wimmer, Email: robwimmer@hotmail.com.
Sarah J Russell, Email: sarah.russell@umaryland.edu.
Martin F Schneider, Email: mschneid@umaryland.edu.
References
- 1.Alway SE, Bennett BT, Wilson JC, Edens NK, Pereira SL. Epigallocatechin-3-gallate improves plantaris muscle recovery after disuse in aged rats. Experimental Gerontology. 2014;50:82–94. doi: 10.1016/j.exger.2013.11.011. [DOI] [PMC free article] [PubMed] [Google Scholar]
- 2.Arnaldez FI, Helman LJ. Targeting the insulin growth factor receptor 1. Hematol Oncol Clin North Am. 2012;26(3):527–542. doi: 10.1016/j.hoc.2012.01.004. [DOI] [PMC free article] [PubMed] [Google Scholar]
- 3.Bonaldo P, Sandri M. Cellular and molecular mechanisms of muscle atrophy. Disease Models & Mechanisms. 2013;6:25–39. doi: 10.1242/dmm.010389. [DOI] [PMC free article] [PubMed] [Google Scholar]
- 4.Boulware SD, Tamborlane WV, Rennert NJ, Gesundhelt N, Sherwin RS. Comparison of the Metabolic Effects of Recombinant Human Insulin-like Growth FactorI and Insulin. J Clin Invest. 1994;93:113–1139. doi: 10.1172/JCI117065. [DOI] [PMC free article] [PubMed] [Google Scholar]
- 5.Brent MM, Anand R, Marmorstein R. Structural basis for DNA recognition by FoxO1 and its regulation by posttranslational modification. Structure. 2008;16:1407–1416. doi: 10.1016/j.str.2008.06.013. [DOI] [PMC free article] [PubMed] [Google Scholar]
- 6.Bunderen CCV, Oosterwerff MM, Schoor NMV, Deeg DJH, Lips P, Drent ML. Serum IGF1, metabolic syndrome, and incident cardiovascular disease in older people: a population-based study. European J of Endocrin. 2013;16:393–401. doi: 10.1530/EJE-12-0784. [DOI] [PubMed] [Google Scholar]
- 7.Correia M, Neves-Petersen MT, Jeppesen PB, Gregersen S, Petersen SB. UV-light exposure of insulin: pharmaceutical implications upon covalent insulin dityrosine dimerization and disulphide bond photolysis. PLoS ONE. 2012;7(12):e50733. doi: 10.1371/journal.pone.0050733. [DOI] [PMC free article] [PubMed] [Google Scholar]
- 8.Evans NP, Call JA, Bassaganya-Riera J, Robertson JL, Grange RW. Green tea extract decreases muscle pathology and NF-kB immunostaining in regenerating muscle fibers of mdx mice. Clin Nutr. 2010;29(3):391–398. doi: 10.1016/j.clnu.2009.10.001. [DOI] [PMC free article] [PubMed] [Google Scholar]
- 9.Fanzani A, Conraads VM, Penna F, Martinet W. Molecular and cellular mechanisms of skeletal muscle atrophy: an update. J Cachexia Sarcopenia Muscle. 2012;3:163–179. doi: 10.1007/s13539-012-0074-6. [DOI] [PMC free article] [PubMed] [Google Scholar]
- 10.Fernandes T, Soci UPR, Melo SFS, Alves CR, Oliveira EM. In: Signaling Pathways that Mediate Skeletal Muscle Hypertrophy: Effects of Exercise Training, Skeletal Muscle - From Myogenesis to Clinical Relations. Cseri Julianna., editor. 2012. [Google Scholar]
- 11.Janssen I, Heymsfield SB, Wang Z, Ross R. Skeletal muscle mass and distribution in 468 men and women aged 18–88 yr. J Appl Physiol. 2000;89:81–88. doi: 10.1152/jappl.2000.89.1.81. [DOI] [PubMed] [Google Scholar]
- 12.Jowko E, Sacharuk J, Balasinska B, Ostaszewski P, Charmas M, Charmas R. Green tea extract supplementation gives protection against exercise-induced oxidative damage in health men. Nutrition Research. 2011;31:831–821. doi: 10.1016/j.nutres.2011.09.020. [DOI] [PubMed] [Google Scholar]
- 13.Kim H, Hiraishi A, Tsuchiya K, Sakamoto K. (-)Epigallocatechin gallate suppresses the differentiation of 3T3-L1 preadipocytes through transcription factors FoxO1 and SREBP1c. Cytotechnology. 2010;62:245–255. doi: 10.1007/s10616-010-9285-x. [DOI] [PMC free article] [PubMed] [Google Scholar]
- 14.Kim H, Quon MJ, Kim J. New insights into the mechanisms of polyphenols beyond antioxidant properties; lessons from the green tea polyphenol, epigallocatechin 3-gallate. Redox Biology. 2014;2:187–195. doi: 10.1016/j.redox.2013.12.022. [DOI] [PMC free article] [PubMed] [Google Scholar]
- 15.Liu Y, Cseresnyés Z, Randall WR, Schneider MF. Activity-dependent nuclear translocation and intranuclear distribution of NFATc in adult skeletal muscle fibers. J Cell Biol. 2001;155:27–39. doi: 10.1083/jcb.200103020. [DOI] [PMC free article] [PubMed] [Google Scholar]
- 16.Mitchell WK, Williams J, Atherton P, Larvin M, Lund J, Narici M. Sarcopenia, dynapenia, and the impact of advancing age on human skeletal muscle size and strength; a quantitative review. Front in Physiology. 2012;3:260, 1–18. doi: 10.3389/fphys.2012.00260. [DOI] [PMC free article] [PubMed] [Google Scholar]
- 17.Nakae Y, Dorchies OM, Stoward PJ, Zimmermann BF, Ritter C, Ruegg UT. Quantitative evaluation of the beneficial effects in the mdx mouse of epigallocatechin gallate, an antioxidant polyphenol from green tea. Histochem Cell Biol. 2012;137:811–827. doi: 10.1007/s00418-012-0926-3. [DOI] [PMC free article] [PubMed] [Google Scholar]
- 18.Perrini S, Laviola L, Carreira MC, Cignarelli A, Natalicchio A, Giorgino F. The GH/IGF1 axis and signaling pathways in the muscle and bone: mechanisms underlying age-related skeletal muscle wasting and osteoporosis. J Endocinology. 2010;205:201–210. doi: 10.1677/JOE-09-0431. [DOI] [PubMed] [Google Scholar]
- 19.Reiter CE, Kim J, Quon MJ. Green tea polyphenol epigallocatechin gallate reduces endotehelin-1 expression and secretion in vascular endothelial cells: roles for AMP-activated protein kinase, Akt, and FOXO1. Endocrinology. 2010;151:130–114. doi: 10.1210/en.2009-0997. [DOI] [PMC free article] [PubMed] [Google Scholar]
- 20.Sanchez AM, Candau RB, Bernardi H. FoxO transcription factors: their roles in the maintenance of skeletal muscle homeostasis. Cell Mol Life Sci. 2013 Nov 15; doi: 10.1007/s00018-013-1513-z. Epub ahead of print. [DOI] [PMC free article] [PubMed] [Google Scholar]
- 21.Sandri M, Sandri C, Gilbert A, Skurk C, Calabria E, Picard A, Walsh K, Schiaffino S, Lecker SH, Goldberg AL. Foxo transcription factors induce the atrophy-related ubiquitin ligase atrogin-1 and cause skeletal muscle atrophy. Cell. 2004;117:399–412. doi: 10.1016/s0092-8674(04)00400-3. [DOI] [PMC free article] [PubMed] [Google Scholar]
- 22.Schachter TN, Shen T, Liu Y, Schneider MF. Kinetics of nuclear-cytoplasmic translocation of Foxo1 and Foxo3A in adult skeletal muscle fibers. Am J Physiol Cell Physiol. 2012;303:C977–C990. doi: 10.1152/ajpcell.00027.2012. [DOI] [PMC free article] [PubMed] [Google Scholar]
- 23.Siddle K. Signalling by insulin and IGF receptors: supporting acts and new players. J of Mol Endocrinology. 2011;47:R1–R10. doi: 10.1530/JME-11-0022. [DOI] [PubMed] [Google Scholar]
- 24.Tzivion G, Dobson M, Ramakrishnan G. FoxO transcription factors; Regulation by AKT and 14-3-3 proteins. Biochim Biophys Acta. 2011;1813:1938–1945. doi: 10.1016/j.bbamcr.2011.06.002. [DOI] [PubMed] [Google Scholar]
- 25.Versteyhe S, Klaproth B, Borup R, Palsgaard J, Jensen M, Gray SG, De Meyts P. IGF-I, IGF-II, and insulin stimulate different gene expression responses through binding to the IGF-I receptor. Front Endocrinol. 2013;4:98, 1–13. doi: 10.3389/fendo.2013.00098. [DOI] [PMC free article] [PubMed] [Google Scholar]
- 26.Wimmer RJ, Liu Y, Schachter TN, Stonko DP, Peercy BE, Schneider MF. Mathematical modeling reveals modulation of both nuclear influx and efflux of Foxo1 by the IGF-I/PI3K/Akt pathway in skeletal muscle fibers. Am J Physiol Cell Physiol. 2014;306:C570–C584. doi: 10.1152/ajpcell.00338.2013. [DOI] [PMC free article] [PubMed] [Google Scholar]
- 27.Zeng L, Holly JMP, Perks CM. Effects of physiological levels of the green tea extract epigallocatechin-3-gallate on breast cancer cell. Front Endocrin. 2014;5(61):1–10. doi: 10.3389/fendo.2014.00061. [DOI] [PMC free article] [PubMed] [Google Scholar]
- 28.Zhao X, Gan L, Pan H, Kan D, Majeski M, Adam SA, Unterman TG. Multiple elements regulate nuclear/cytoplasmic shuttling of FOXO1: characterization of phosphorylation- and 14-3-3-dependent and -independent mechanisms. Biochem J. 2004;378(Pt 3):839–849. doi: 10.1042/BJ20031450. [DOI] [PMC free article] [PubMed] [Google Scholar]