Abstract:
Gaseous emboli may be introduced into the bypass circuit both from the surgical field and during perfusionist interventions. While circuits provide good protection against massive air embolism, they do not remove gaseous microemboli (GME) from the bypass circuit. The purpose of this preliminary study is to assess the incidence of GME during bypass surgery and determine if increased GME counts were associated with specific events during bypass surgery. In 30 cases divided between 15 coronary artery bypass grafts and 15 valve repairs, GME were counted and sized at the three locations on the bypass circuit using the EDAC® Quantifier (Luna Innovations, Roanoke, VA). A mean of 45,276 GME were detected after the arterial line filter during these 30 cases, with significantly more detected (p = .04) post filter during valve cases (mean = 72,137 ± 22,113) than coronary artery bypass graft cases (mean = 18,416 ± 7831). GME detected post filter were significantly correlated in time with counts detected in the venous line (p < .001). Specific events associated with high counts included the initiation of cardiopulmonary bypass, heart manipulations, insertion and removal of clamps, and the administration of drugs. Global factors associated with increased counts post filter included higher venous line counts and higher post reservoir/bubble trap counts. The mean number of microemboli detected during bypass surgery was much higher than reported in other studies of emboli incidence, most likely due to the increased sensitivity of the EDAC® Quantifier compared to other detection modalities. The results furthermore suggest the need for further study of the clinical significance of these microemboli and what practices may be used to reduce GME incidence. Increased in vitro testing of the air handling capability of different circuit designs, along with more clinical studies assessing best clinical practices for reducing GME activity, is recommended.
Keywords: gaseous microemboli, cerebral protection, ultrasound, cardiopulmonary bypass
Embolism is a well-known cause of cardiopulmonary bypass (CPB) mortality and morbidity, as emboli in arterial vessels cause symptoms of end-artery obstruction, tissue ischemia, and necrosis (1). The brain is particularly susceptible to embolic damage, leading to many reports of poor neurological outcomes following CPB.
During the 1980s and 1990s, concern over air embolism led to increased use of membrane oxygenators and arterial line filters in CPB circuits, and today the incidence of massive air embolism during CPB surgery is relatively rare (2). Despite these improvements, repeated studies have shown that membrane oxygenators and arterial line filters do not provide complete protection against air emboli, as gaseous microemboli (GME) have been detected after the arterial line filter in numerous studies (3–11).
To date, the vast majority of published literature relating to embolus detection concerns transcranial Doppler (TCD) ultrasound in which a 1–2 MHz probe is placed over the temporal lobe of the head to insonate the middle cerebral artery. A number of TCD systems are available for clinical use, each with slightly varying methods for discriminating high intensity transient signals (HITS), which signify an embolus in TCD systems, from the background signal. As a result, the number of HITS reported during bypass surgery has varied considerably, but with total number of HITS detected in a case rarely exceeding 100 (12–14).
The recent introduction of the EDAC® Quantifier (Luna Innovations, Roanoke, VA) enables more sensitive and more quantitative measurements of GME activity at multiple locations within the CPB circuit, thus providing a more sensitive measure of microembolic activity during the bypass surgery, and providing a new opportunity for assessing which surgical practices result in increased GME activity and identifying how those practices might be adjusted to minimize GME delivered to the patient during CPB. This paper highlights an observational study conducted at Carilion Clinic (Roanoke, VA) in which the EDAC was used to monitor GME activity on the CPB circuit. The purpose of this study is to assess the incidence of GME during bypass surgery and determine if increased GME counts were associated with specific events during bypass surgery.
MATERIALS AND METHODS
A total of 30 patients were included in this Institutional Review Board-approved observational study. Table 1 summarizes the breakdown in the procedures, including the type of bypass circuit used, the age and gender of the subject, and details on the procedure performed and the time on bypass.
Table 1.
Summary of procedures monitored with the EDAC® Quantifier.
| Circuit | Age | Sex | Pump Time | Clamp Time | Procedure(s) | Redo? |
|---|---|---|---|---|---|---|
| Traditional | 71 | F | 75 | 53 | Mitral valve repair | N |
| Traditional | 66 | M | 87 | 63 | CABG (×3) and maze | N |
| Traditional | 63 | M | 168 | 135 | Aortic valve repair and CABG (×2) | N |
| Traditional | 44 | M | 193 | 151 | Aortic valve repair and septal aneurysm repair | N |
| Traditional | 71 | M | 202 | 123 | Aortic valve repair | Y |
| Traditional | 76 | M | 186 | 166 | Mitral valve repair and CABG (×3) | N |
| Traditional | 68 | M | 123 | 96 | CABG (×2) | Y |
| Traditional | 56 | M | 66 | 35 | Mitral valve repair | N |
| Traditional | 81 | M | 151 | 108 | Mitral valve repair, maze, CABG (×3) | N |
| Traditional | 52 | F | 102 | 82 | CABG (×3) | Y |
| Traditional | 51 | F | 182 | 119 | Aortic valve repair | N |
| Traditional | 45 | M | 136 | 0 | Mitral valve repair | Y |
| Traditional | 59 | M | 163 | 108 | Aortic valve repair | N |
| Traditional | 71 | M | 235 | 186 | Aortic valve repair, CABG (×2) | N |
| Traditional | 59 | F | 88 | 65 | CABG (×3) | N |
| MECC | 75 | M | 74 | 61 | CABG (×3) | N |
| MECC | 46 | M | 65 | 52 | CABG (×3) | N |
| MECC | 65 | M | 104 | 85 | CABG (×3) | N |
| MECC | 68 | M | 182 | 139 | CABG (×6) | N |
| MECC | 54 | F | 82 | 67 | CABG (×3) | N |
| MECC | 72 | M | 119 | 95 | CABG (×4) | N |
| MECC | 54 | M | 125 | 93 | CABG (×4) | N |
| MECC | 63 | M | 114 | 90 | CABG (×4) | N |
| MECC | 54 | M | 131 | 115 | CABG (×5) | N |
| MECC | 52 | M | 99 | 62 | CABG (×3) | N |
| MECC | 71 | M | 55 | 44 | CABG (×2) | N |
| MECC | 51 | M | 57 | 41 | CABG (×2) | N |
| MECC | 65 | M | 124 | 96 | CABG (×4) | N |
| MECC | 71 | M | 80 | 65 | CABG (×4) | N |
| MECC | 65 | M | 140 | 101 | CABG (×3) | N |
The standard practice at Carilion Roanoke Memorial Hospital is to use a miniaturized extracorporeal circuit (MECC) for coronary artery bypass graft (CABG)-only procedures, and a more traditional circuit for complex cases such as a valve repair, maze, or redo. The MECC was manufactured by the Sorin Group (Arvada, CO) and used the Synergy oxygenators with an integral bubble trap (120 micron screen filter), an integral arterial filter (40 microns), and a Cobe/Sorin VVR 4000i Filtered Hardshell Venous Reservoir. In this circuit, the arterial filter was purged to the venous line. The more traditional circuit included an Affinity CB511 Oxygenator (Medtronic, Minneapolis, MN), an Affinity 321 venous reservoir bag with a separate cardiotomy reservoir (Medtronic EL404), and a Medtronic 38-micron arterial filter. Kinetic assisted venous drainage was used with some venous cannula configurations such as single femoral venous cannulation. In this circuit, the arterial filter was purged to the cardiotomy reservoir.
Sterile cuvettes used for connecting EDAC sensors to the circuit were inserted at three locations on each circuit:
On the venous line prior to the venous reservoir,
On the venous line post reservoir when the traditional circuit was used or post bubble trap on the MECC circuit, and
On the arterial line after the arterial filter.
GME data from these sensors were recorded during the surgery, with inter-operative events logged on the EDAC software using an event annotation feature. The conduct of CPB at the Carilion Clinic (Roanoke, VA) was performed in their normal method according to written policy and procedures. The perfusionists, aware of previous research describing the impact of interventions on GME production, were meticulous in following established guidelines. These guidelines include care when obtaining blood samples through an arterial to venous manifold (air not allowed to enter the manifold), care during drug administration (slowly without air entrainment into the venous line or cardiotomy) and no manipulation of the venous reservoir. Fluid administration was through the cardiotomy. Other significant techniques used include filling the heart if venous air is observed until surgical intervention is undertaken to eliminate the source of air. The EDAC screen was blinded to the surgical staff during the surgery and no modifications or adjustments to the normal conduct of CPB were made based on information obtained by EDAC.
For each procedure, the EDAC recorded GME counts and an estimated volume, or embolic load, of the detected bubbles based the amplitude of the return echo (15). An embolic load of 5 × 10⁻⁴ mL is equivalent to the volume of one 1000 micron bubble; an embolic load of 5 × 10⁻⁷ mL is equivalent to the volume of one 100 micron bubble; and an embolic load of 5 × 10⁻¹⁰ mL is equivalent to the volume of one 10 micron bubble.
For each procedure, the total number of counts and total embolic load each minute was exported into a comma-separated values file. In addition, the average flow rate and average hematocrit during the procedure was recorded for each patient. An analysis of variance was then performed to assess whether there was a significant difference between GME counts and load with the CABG and valve repair groups. The relationship between GME incidence and other numerical factors (flow rate, hematocrit, time on bypass, and cross-clamp time) were assessed using linear regression.
RESULTS
Table 2 summarizes the mean, maximum, and minimum number of GME detected in the venous line, after the bubble trap/venous reservoir and after the arterial filter for the 30 cases, while Table 3 provides the same data for embolic load. A mean of 45,276 ± 71,125 GME was detected post arterial filter, producing a mean embolic load of .001 mL ± .002 mL. The size distribution of the bubbles detected is provided in Figure 1, which shows a decreasing percentage of large bubbles detected post filter and post reservoir than in the venous line. Table 4 shows that valve procedures produced a statistically significant increase in the number of GME detected at all three monitoring sites over CABG procedures. Table 5 shows that the increase was only statistically significant for embolic loads at the post trap/venous reservoir site.
Table 2.
GME count summary for 30 monitored cases.
| Max | Mean ± SD | Min | |
|---|---|---|---|
| Venous | 904,650 | 158,284 ± 201,018 | 22,507 |
| Post trap/venous reservoir | 1,342,983 | 346,063 ± 397,433 | 15,273 |
| Post arterial line filter | 311,822 | 45,276 ± 71,125 | 3,028 |
Table 3.
Embolic load summary for 30 monitored cases.
| Max mL | Mean mL ± SD | Min mL | |
|---|---|---|---|
| Venous | 649 | 25 ± 118 | .04 |
| Post trap/venous reservoir | .59 | .07 ± .14 | .0009 |
| Post arterial line filter | .01 | .001 ± .002 | .00003 |
Figure 1.
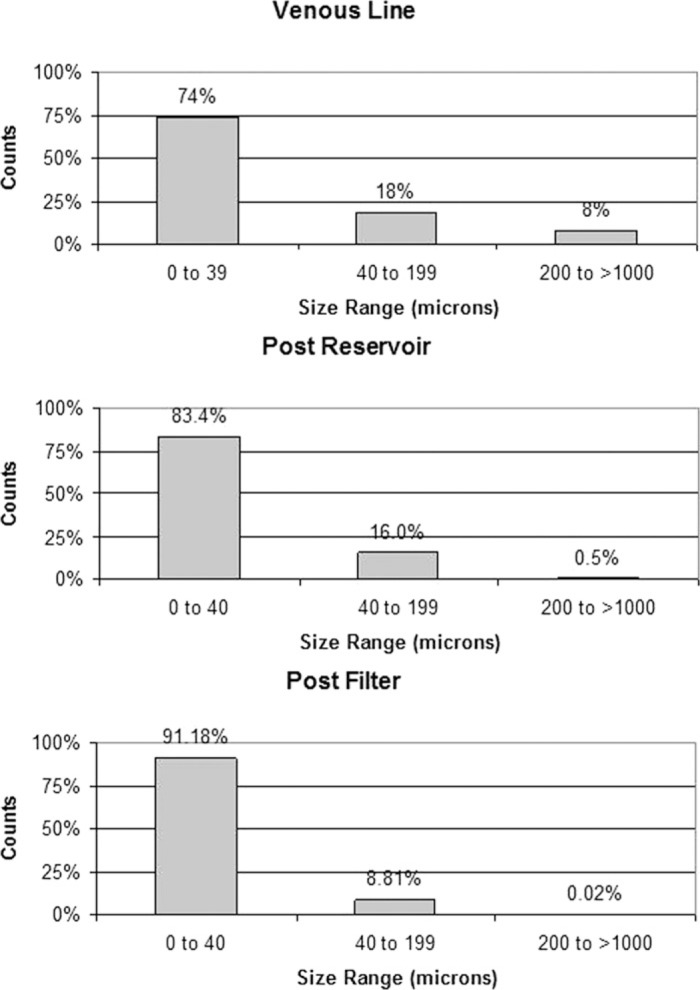
Percentage of GME detected in three size ranges at all three monitoring sites for the 30 cases.
Table 4.
Comparison of GME counts in valve repairs versus CABGs.
| Site | Valve | CABG | p-value |
|---|---|---|---|
| Venous | 251,229 ± 64,785 | 65,339 ± 12,205 | .01 |
| Post trap/venous reservoir | 621,775 ± 103,182 | 70,351 ± 17,506 | <.001 |
| Post arterial line filter | 72,136 ± 23,113 | 18,416 ± 7,831 | .04 |
Table 5.
Comparison of total embolic load in valve repairs versus CABGs.
| Site | Valve mL | CABG mL | p-value |
|---|---|---|---|
| Venous | 48 ± 43 | 2.6 ± 1.7 | .30 |
| Post trap/ venous reservoir | .13 ± .048 | .020 ± .012 | .04 |
| Post arterial line filter | .0018 ± .0008 | .0005 ± .0002 | .11 |
Table 6 provides a different comparison of the valve and CABG cases, this time looking at what percentage of the air detected at the venous line and the post trap/venous reservoir site was transmitted to the post filter site. In this case, there was no significant difference in the venous line transmission between the valve and CABG cases for both GME counts and load. However, the percentage of GME transmitted from the post-trap/venous reservoir site to the post filter site was significantly higher in CABG cases than valve cases. This difference is true for both GME counts and load. Finally, Table 7 shows that, after performing linear regression, the R-squared value showed no correlation between GME counts or load and average flow rate, average hematocrit, CPB time, or cross-clamping time.
Table 6.
Comparison of percentage of GME transmitted post filter from the venous line and from the post trap/reservoir monitoring site. The comparison is provided for both GME counts and embolic load.
| GME Transmitted | Valve (%) | CABG (%) | p-value |
|---|---|---|---|
| VL to filter (counts) | 28 ± 4.6 | 22 ± 4.0 | .39 |
| VL to filter (load) | .14 ± .08 | .08 ± .026 | .47 |
| Post trap/venous reservoir to filter (counts) | 10 ± 1.6 | 22 ± 2.5 | <.001 |
| Post trap/venous reservoir to filter (load) | 1.3 ± .24 | 3.6 ± .75 | .007 |
Table 7.
Linear regression of average flow rate, hematocrit, CPB time, and cross-clamping time shows no correlation between these values and GME counts or load.
| Flow Rate | Hematocrit | CPB Time | Cross-Clamp Time | |
|---|---|---|---|---|
| Counts R2 | <.01 | <.01 | <.01 | <.01 |
| Load R2 | .02 | <.01 | <.01 | <.01 |
In addition to this global analysis, a median sort of surgical events and counts was performed to determine which surgical events contributed the most to increased GME activity. Figure 2 shows the results of this sort for venous line, post-reservoir, and post-filter counts respectively. These events are illustrated for specific cases in Figures 3–7.
Figure 2.
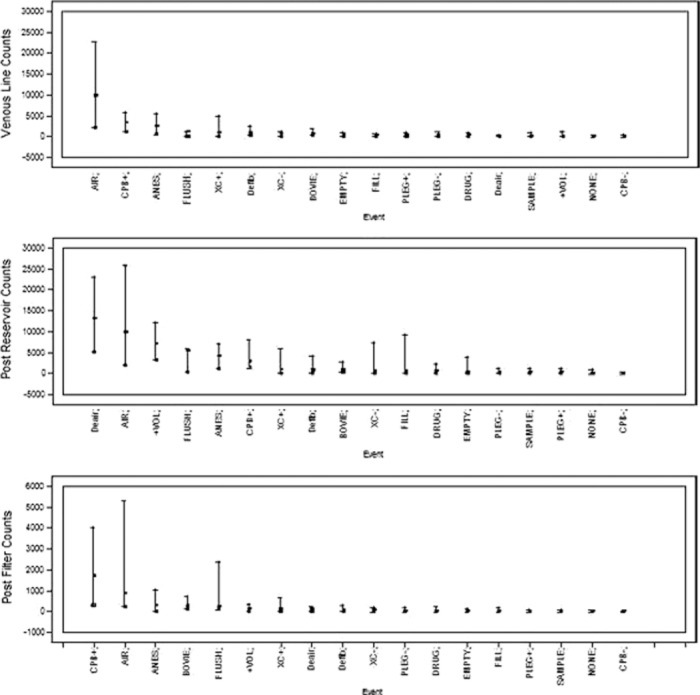
Median sort of events correlated in time with the highest GME counts in the venous line (top), after the reservoir (middle), and after the arterial filter (bottom).
Figure 3.
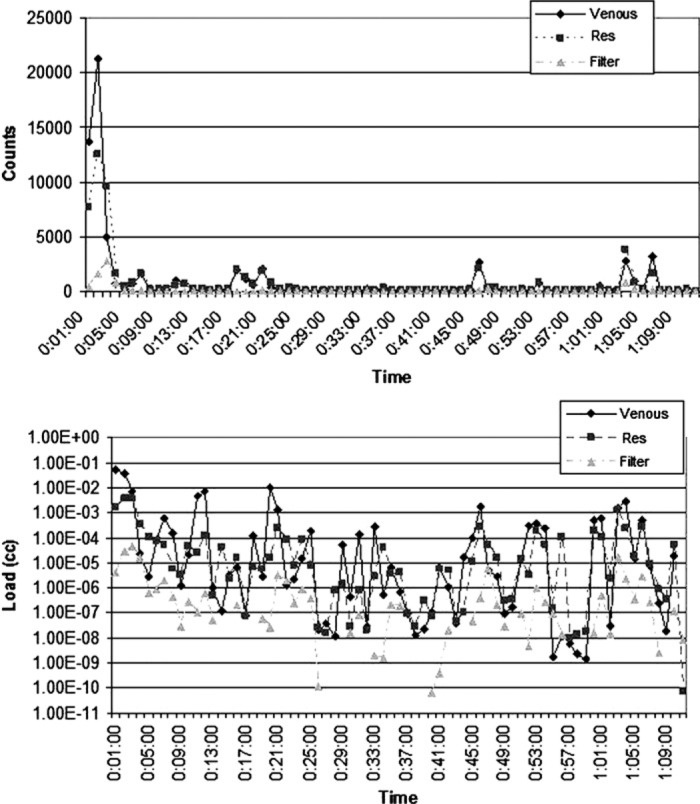
Count and load histories for Case 15 (valve repair). These graphs illustrate a typical spike in GME activity detected during the initiation of CPB (at 1 minute).
Figure 4.
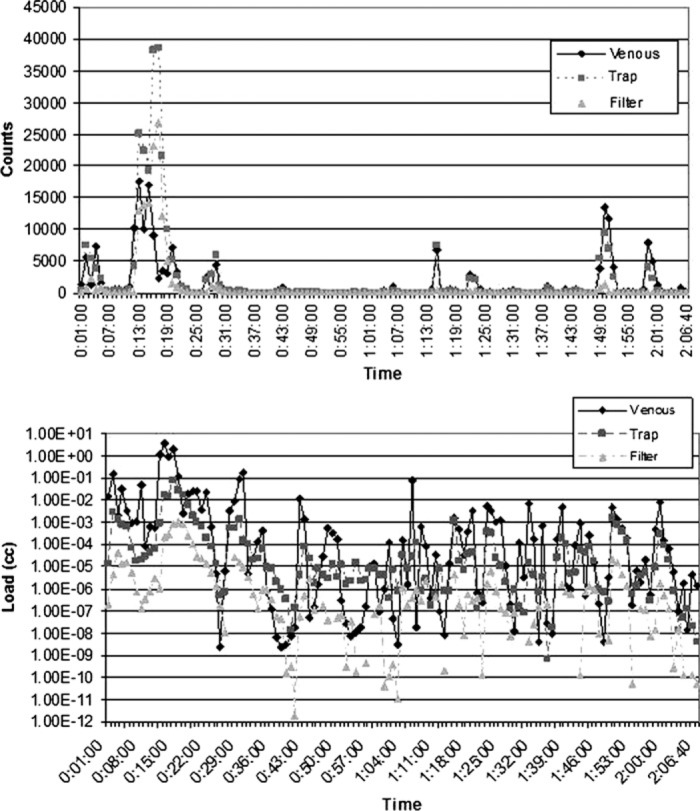
Count and load histories for Case 4 (CABG). Here, the largest spike in counts and load starts at 11 minutes, when the cross clamp is applied. The spike continues for several minutes as the heart is manipulated and drugs are administered at 11, 12, 13, and 21 minutes.
Figure 5.
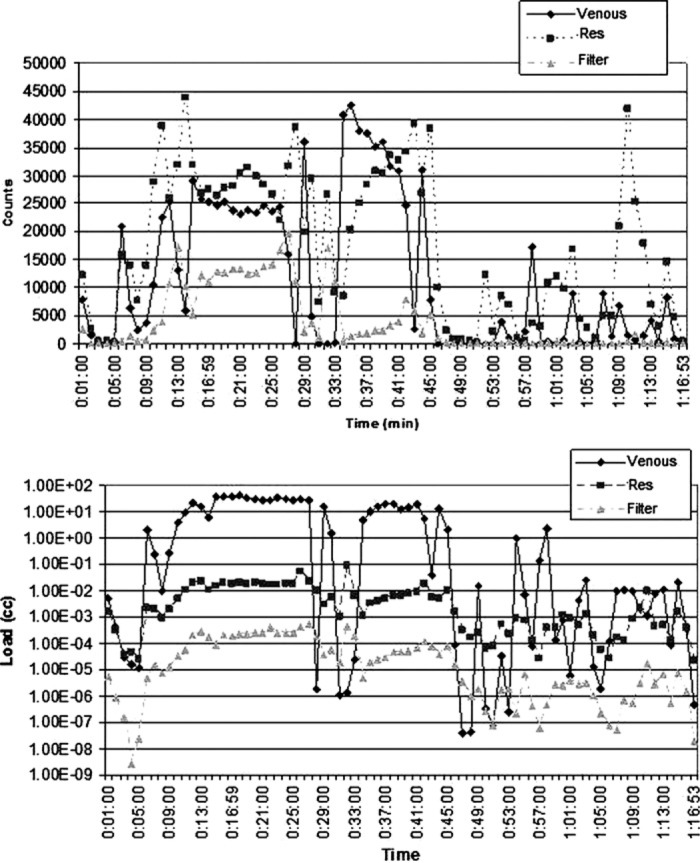
Count and load histories for Case 18 (valve repair). The increase in counts and load detected at 11 minutes occurs as the heart is manipulated, filled, and then emptied. Shortly thereafter, air is seen in the venous line. The spike in counts and load at 34 minutes coincided with the start of kinetic assisted venous drainage and cardioplegia.
Figure 6.
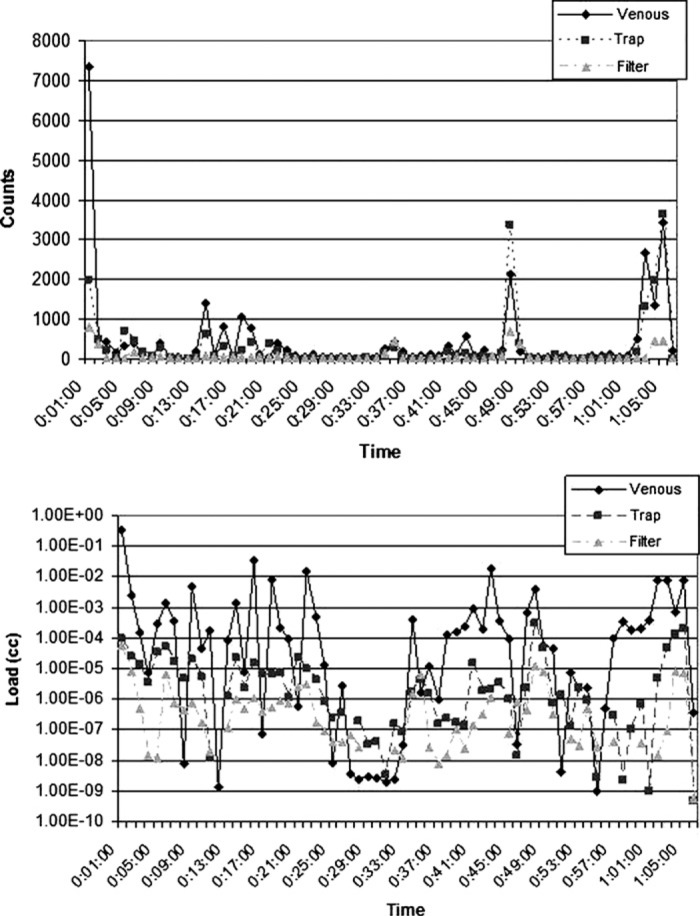
Count and load histories for Case 9 (CABG). The spike in counts and load at 49 minutes coincided with drug administration by the anesthesiologist.
Figure 7.
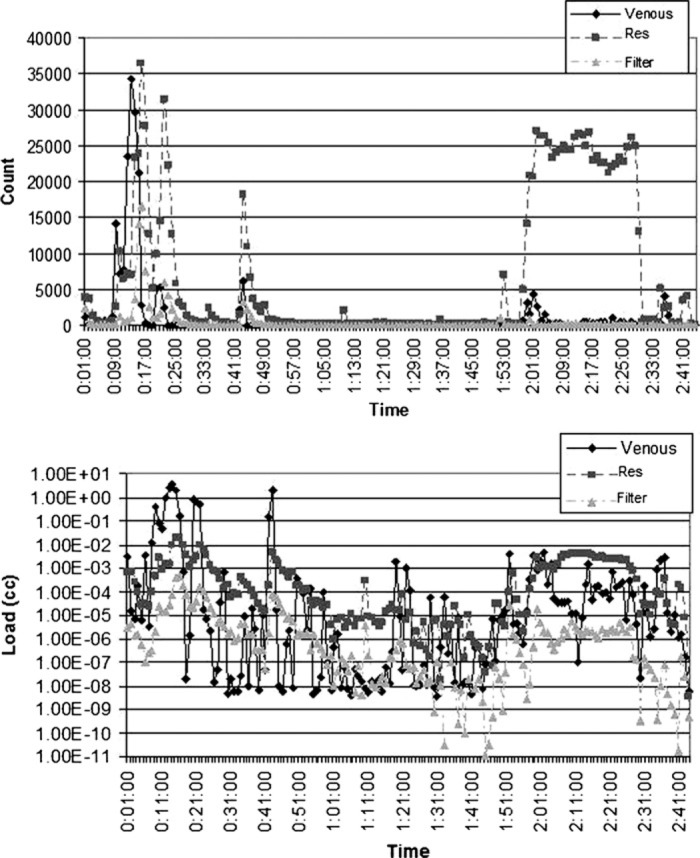
Count and load histories for Case 13 (valve repair). The spike in counts and load post trap coincided with the removal of the cross-clamp at 1 hour, 57 minutes. The sustained increase in counts occurred during defibrillation at 2 hours, 1 minute, and de-airing of the heart at 2 hours, 10 minutes. The counts and load increased post reservoir due to an open vent line shunted into cardiotomy.
DISCUSSION
The size distribution of detected GME for all 30 cases (Figure 1) shows that CPB circuits reduce not just the total number of GME detected, but that they remove large bubbles more efficiently than microair. Nonetheless, the .02% of GME 200 microns and up detected post filter represents a total of 195 large bubbles through the 30 cases, and that GME in this largest size range were detected in 20 of the 30 cases. Given the greater potential for ischemic damage from large bubbles, these 195 bubbles are of particular concern (16). Careful examination of the EDAC data files indicated that there was no single event more strongly associated with the detection of larger bubbles than small bubbles. Thus, greater vigilance in eliminating sources of small GME may be the best way to prevent larger microbubbles from reaching the patient.
Although valve cases had much higher GME counts post filter than CABG cases, this appears to be almost entirely due to the higher incidence of GME detected in the venous line for valve cases, as there was no significant difference between the percentage of GME transmitted from the venous line past the arterial filter. It is interesting to note, however, that CABG cases transmitted significantly more of the GME detected post trap/reservoir than the valve cases. This could mean that the bubble trap in the MECC circuit contributes more to air removal than the oxygenator/filter combination and the bag reservoir used in the CABG.
Alternatively, this difference in transmission rates may be due to a difference in the nature of GME entering the venous reservoir in valve cases. First, Figure 2 shows that visible air in the venous line, the initiation of CPB, and drug administration by the anesthesiologist are the three events most strongly associated with GME counts both in the venous line and after the arterial filter. For the post trap/venous reservoir monitoring site, de-airing of the heart during defibrillation was more strongly associated with an increase in GME counts.
This increase in post reservoir counts is illustrated in the case history shown in Figure 7. Because the increased counts are seen after the venous reservoir but not in the venous line, we believe the source of air was an open vent line to the cardiotomy reservoir used during these events. In addition, although high numbers of GME are detected post reservoir, the increase post filter is quite small relative to other events. The steady stream of very small GME detected post reservoir appear to be more easily removed by the oxygenator and filter than the bursts of GME produced during improper blood sampling or drug injections with a syringe.
The recent Sauren et al. (17) study also found that sampling with a syringe produced a higher incidence of microembolic signals than the use of an open purge line. Our work suggests that open purge lines still produce some GME in the bypass circuit, but these GME are more likely to be filtered out of the circuit before they reach the patient.
Adding volume to the reservoir resulted in a similar increase in GME activity (Figure 8) after the reservoir/ trap but not in the venous line. The counts from these volume additions to the reservoir, although significant, did not result in the same large increases in counts detected post filter as when large amounts of venous line air were detected. Once again, slow changes in reservoir volume tend to produce a steady stream of smaller GME. These steady infusions of microair appear to be easier to filter than larger injections of air via the venous line or sudden pressure changes caused by syringe injection or sampling.
Figure 8.
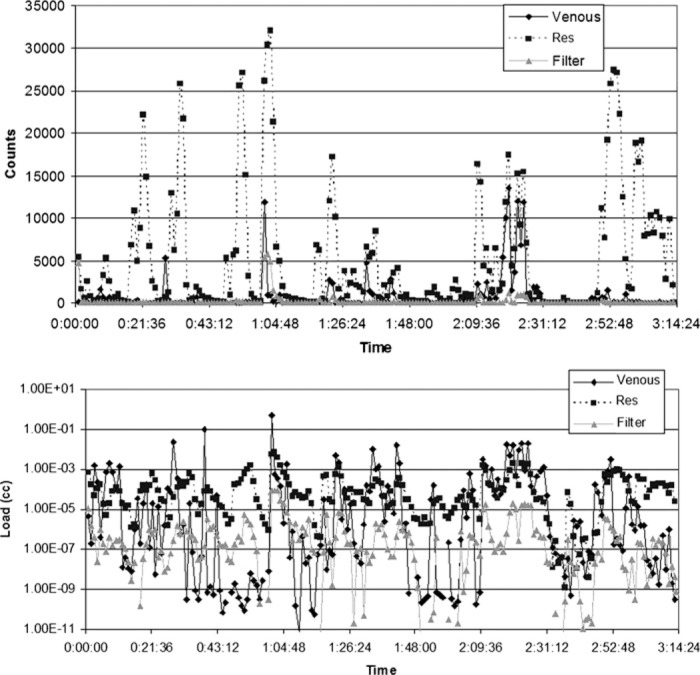
Count and load histories for Case 23 (valve repair). Spikes in counts and load post trap at 50 minutes; 1 hour, 17 minutes; 1 hour, 40 minutes, and 2 hours, 9 minutes coincide with the addition or removal of volume from the reservoir. Note that at each of these times there is a large increase in counts post trap with little or no increase in counts in the venous line.
The primary weakness of this study was its observational nature. As a result, it was not possible to determine the effect of different cannulation techniques or other surgical practices from this work. Given the strong association between increased venous line GME activity and increased GME activity post filter, such a study would provide more definitive information about how surgical practices might be modified to reduce GME delivered to the patient.
A second weakness is that, because the MECC was used exclusively on CABG cases and the traditional circuit was used exclusively on valve repairs, it is difficult to determine statistically whether differences in GME counts between the two circuits are due to differences in the type of procedure performed or due to differences in the air handling characteristics of the circuit used. Nonetheless, differences in the percentage of GME transmitted from the post trap/reservoir site past the filter suggest the need for more testing of the air handling capabilities of different circuit configurations. Much of this testing can be performed in vitro, using methodology similar to that published by Riley (16) for ranking the performance of arterial line filters. However, given the strong association between post-filter GME counts and venous line GME counts, this methodology should be extended to other circuit components such as the reservoir and the oxygenator. Perfusionist interventions, such as methods for adding volume to the reservoir and proper blood sampling techniques, can also be effectively tested in vitro. In contrast, modifications to surgical techniques, such as cannulation, clamping, and de-airing, may be more effectively tested clinically. Despite the difficulties associated with conducting these clinical studies, the payoff in terms of reduced GME may be significant, given the strong association between post filter counts and venous line counts.
An additional weakness of the study is the absence of longitudinal patient outcome data. The size and frequency of GME counts observed in this study could not be correlated to adverse clinic events. Therefore, no conclusion can be drawn as to their clinical significance. Further studies are needed in this area.
CONCLUSION
For the 30 cases observed, a mean 45,276 GME were detected post arterial filter with the EDAC® Quantifier, with significantly more GME detected post filter in the valve repair cases than the CABG cases. These bubble counts were much higher than those reported in other studies of emboli incidence, most likely due to the increased sensitivity of the EDAC compared to other detection modalities. In addition to visible air in the venous line, increased GME counts were observed at the initiation of CPB, administration of drugs by the anesthesiologist, an open vent line to the cardiotomy reservoir, and rapid infusion of volume to the reservoir.
This observational study highlights the need for additional research to determine the clinical significance of these microemboli, and the results provided here may be useful in powering an outcomes study of this nature. Complimentary studies to determine how to reduce GME counts delivered to the patient, including increased in vitro testing of the air handling capability of different circuit designs, and more clinical studies assessing best clinical practices for reducing GME activity are also recommended.
ACKNOWLEDGMENT
This work was supported by Luna Innovations Incorporated.
REFERENCES
- 1.Mitchell S, Gorman D.. The pathophysiology of cerebral arterial gas embolism. J Extra Corpor Technol. 2002;34:18–23. [PubMed] [Google Scholar]
- 2.Kurusz M, Butler BD.. Bubbles and bypass: An update. Perfusion. 2004;19:S49–55. [DOI] [PubMed] [Google Scholar]
- 3.Courtney PH, Han YQ, Warren ET, Heath BJ.. Gross air handling characteristics of membrane oxygenators: An in vitro study. J Extra Corpor Technol. 1994;26:6–12. [Google Scholar]
- 4.Norman MJ, Sistino SS, Acsell JR.. The effectiveness of low-prime cardiopulmonary bypass circuits at removing gaseous emboli. J Extra Corpor Technol. 2004;36:336–42. [PubMed] [Google Scholar]
- 5.Jones TJ, Deal DD, Vemon JC, Blackburn N, Stump DA.. Does vacuum-assisted venous drainage increase gaseous microemboli during cardiopulmonary bypass? Ann Thorac Surg. 2002;74:2132–7. [DOI] [PubMed] [Google Scholar]
- 6.Dickinson TA, Riley JB, Crowley JC, Zabetakis PM.. In vitro evaluation of the air separation ability of four cardiovascular manufacturer extracorporeal circuit designs. J Extra Corpor Technol. 2006;38:206–13. [PMC free article] [PubMed] [Google Scholar]
- 7.Mueller XM, Tevaerai HT, Jegger D, Augstburger M, Burki M, von Segesser LK.. Ex vivo testing of the Quart ® arterial line filter. Perfusion. 1999;14:481–7. [DOI] [PubMed] [Google Scholar]
- 8.Taylor KM.. Brain damage during cardiopulmonary bypass. Ann Thorac Surg. 1998;65:S20–6. [DOI] [PubMed] [Google Scholar]
- 9.Wilcox TW, Mitchell SJ, Gorman DF.. Venous air in the bypass circuit: A source of arterial line emboli exacerbated by vacuum-assisted drainage. Ann Thorac Surg. 1999;68:1285–9. [DOI] [PubMed] [Google Scholar]
- 10.Massimino RJ, Gough JD, Stearns GT, Martin J Jr.. Gaseous emboli removal efficiency in arterial screen filters: A comparative study. J Extra Corpor Technol. 1983;15:25–34. [Google Scholar]
- 11.Borger MA, Peniston CM, Weisel RD, Vasiliou M, Green REA, Feindel CM.. Neuropsychologic impairment after coronary bypass surgery: Effect of gaseous microemboli during perfusionist interventions. J Thorac Cardiovasc Surg. 2001;121:743–9. [DOI] [PubMed] [Google Scholar]
- 12.Lynch JE, Riley JB.. Microemboli detection on extracorporeal bypass circuits. Perfusion. 2008;23:23–32. Review. [DOI] [PubMed] [Google Scholar]
- 13.Barbut D, Lo YW, Gold JP, et al. . Impact of embolization during coronary artery bypass grafting on outcome and length of stay. Ann Thorac Surg. 1997;63:998–1002. [DOI] [PubMed] [Google Scholar]
- 14.Clark RE, Brillman J, Davis DA, Lovell MR, Price TRP, Macgovern GL.. Microemboli during coronary artery bypass grafting. J Thorac Cardiovasc Surg. 1995;109:249–58. [DOI] [PubMed] [Google Scholar]
- 15.Lynch JE, Pouch A, Sanders R, Hinders M, Rudd K, Sevick J.. Gaseous microemboli sizing in extracorporeal circuits using ultrasound back-scatter. Ultrasound Med Biol. 2007;33:1661–75. [DOI] [PubMed] [Google Scholar]
- 16.Riley JB.. Arterial line filters ranked for gaseous micro-emboli separation performance: An in-vitro study. J Extra Corpor Technol. 2008;40:21–6. [PMC free article] [PubMed] [Google Scholar]
- 17.Sauren LD, Mooren EJ, Severdija EE, Weerwind PW, Maessen JG.. Emboli occurrence during coronary artery bypass surgery: The influence of a new method of perfusionist blood sampling. Perfusion. 2008;23:261–5. [DOI] [PubMed] [Google Scholar]


