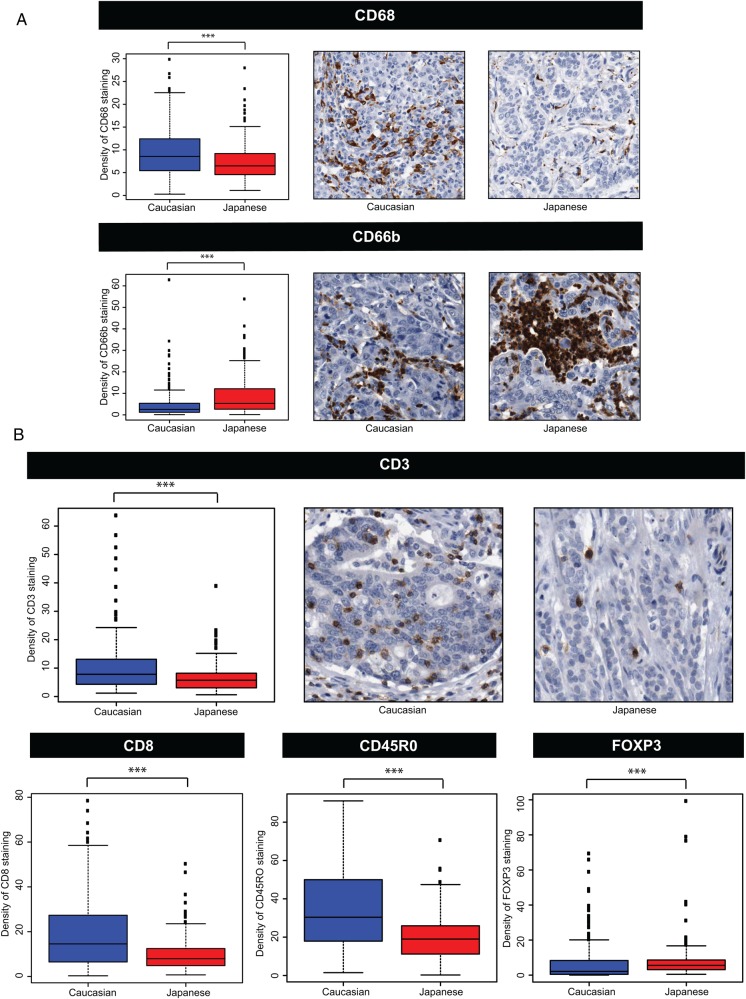
Figure 4.
Immunohistochemical (IHC) assessments of immune and inflammatory cell populations in Caucasian and Japanese gastric cancer (GC) cohorts. Panel (A) depicts IHC assessment of tumour infiltration by macrophages (CD68) and neutrophils (CD66b) in Caucasian (blue) versus Japanese (red) cohorts. There is significantly more CD68 staining (top diagram) in Caucasian compared with Japanese GCs, and significantly more CD66b staining (bottom diagram) in Japanese compared with Caucasian GCs. These results suggest the presence of inflammation in both cohorts, but different cellular recruitment. Panel (B) illustrates results after quantitative IHC for T-cell-related immune markers, that is, CD3 (general T-cell marker; top diagram), CD8 (cytotoxic T-cell marker; bottom left diagram), CD45R0 (marker for memory T-cells; bottom middle diagram) and FOXP3 (marker for regulatory T-cells; bottom right diagram), in Caucasian (blue) and Japanese (red) cohorts. With the exception of FOXP3, all markers are significantly enriched in Caucasian GCs. For FOXP3, there is significantly more staining in the Japanese GC. For all cases, *** indicates a significant (Wilcoxon Mann–Whitney test p<0.05) difference in the extent of staining. Panels also show corresponding IHC images from Caucasian and Japanese cohorts.

