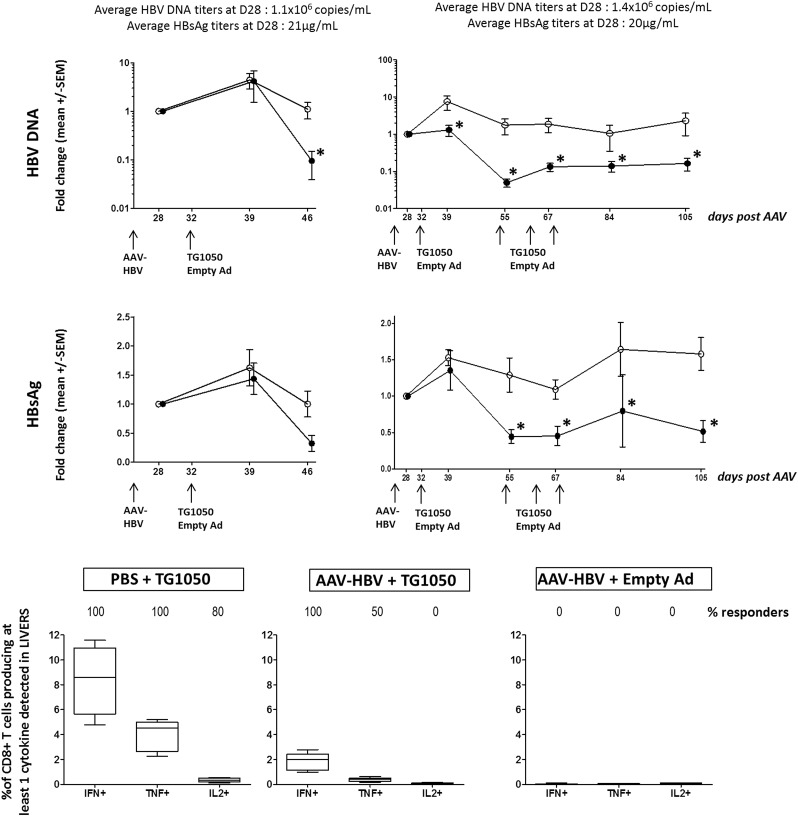
Figure 6.
Monitoring of viral and immunological parameters in C57BL/6J AAV-HBV-persistent mice. C57BL/6J naïve mice were intravenously injected with PBS or AAV-HBV (day 0) and immunised 1 month later (day 32) with either TG1050 or empty adenovirus. (A) HBV DNA and (B) HBsAg data are represented as mean fold changes (DNA and HBsAg) compared with their respective mean level before TG1050 (plain circle curve) or empty Ad (empty circle curve) immunisation. Statistical analyses were performed using mixed models and ANOVA for repeated measures. The analysis was done on changes from baseline in percentage. For DNA, the analysis was performed on ranks in order to fulfil the mixed model hypothesis. *p<0.05. Induced HBV-specific immune responses were assessed 2 weeks after TG1050 or empty Ad immunisation (day 47) with interferon γ (IFNγ)/tumour necrosis factor α (TNFα)/interleukin 2 (IL-2) intracellular cytokine staining assays using liver-infiltrating lymphocytes (C), using the H-2b restricted peptide VSA (polymerase) for in vitro stimulation. The results are presented as the percentage of CD8+ T cells producing at least IFNγ or TNFα or IL-2. The percentage of mice displaying a positive response is indicated at the top of the graph.

