Abstract
Objective: To investigate the roles of TNF-α, GSK-3β and RANKL in the occurrence and development of diabetic osteoporosis. Methods: Diabetic rat model was established; tissue section technology was used to observe the situation of osteoporosis in diabetic rats; rat serum levels of OC, RANKL, GSK-3β, P38mapk, TNF-α and INS were detected by Elisa assay; osteoblasts and osteoclasts were primarily cultured and identified by immunohistochemistry and tartrate-resistant acid phosphatase (TRAP) staining respectively. The effects of GSK-3β inhibitors, lithium chloride, TNF-α antagonists and RANKL antagonists on the proliferation of osteoblasts and osteoclasts were evaluated; quantitative PCR was used to assess the effects of GSK-3β inhibitors, lithium chloride, on TNF-α and RANKL gene expression in osteoblasts and osteoclasts, and the effects of TNF-α and RANKL antagonists on GSK-3β gene expression in osteoblasts and osteoclasts. Results: Diabetic rat model was successfully established; osteoblasts and osteoclasts were successfully isolated and cultured. Elisa experiments showed that in diabetic model group, the levels of RANKL, GSK-3β, P38mapk and TNF-α were significantly increased, while the levels of osteocalcin (OC) and insulin (INS) were significantly reduced; MTT results showed that osteoclast proliferation in GSK-3β inhibitor and lithium chloride groups were weaker than the untreated group, while osteoclast proliferation in TNF-α antagonist group and RANKL antagonist Group was very close to the untreated group. Osteoblast proliferation in GSK-3β inhibitor and lithium chloride groups were weaker than the untreated group, while osteoblast proliferation in TNF-α antagonist group and RANKL antagonist group was higher than the untreated group. In all of the corresponding groups, cell proliferation in the diabetic group was stronger than the untreated group. In GSK-3β inhibitor and lithium oxide groups, TNF-α and RANKL gene expression levels were elevated, but TNF-α and RANKL gene expression levels in the diabetic group were slightly lower than the control group. GSK-3β gene expression level in TNF-α antagonist group and RANKL antagonist group was reduced; GSK-3β gene expression level in diabetic group was lower than the control group. Conclusion: In diabetic rats, TNF-α, GSK-3β and RANKL levels were elevated; GSK-3β could promote the proliferation of osteoblasts and osteoclasts, and inhibit the expression of TNF-α and RANKL; TNF-α and RANKL can suppress the proliferation of osteoblasts while had little effect on osteoclast proliferation; they also can promote the GSK-3β gene expression; interactions between the three broke the balance between osteoblasts and osteoclasts, leading to osteoporosis.
Keywords: TNF-α, GSK-3β, RANKL, diabetes, osteoporosis
Introduction
Diabetes is a group of metabolic diseases characterized by high blood sugar due to the defects in insulin secretion and (or) insulin function disorder. Sustained hyperglycemia and long-term metabolic disorders can lead to the damage, dysfunction and failure in body tissues and organs, particularly in eye, kidney, cardiovascular and nervous system. Osteoarthritis is a kind of systemic bone metabolic disease characterized by low bone mass and bone tissue microarray structural damage, leading to increased bone fragility and susceptibility to fracture. The disease is common in the elderly, but recent studies suggest that osteoporosis has a great relationship with diabetes. Diabetic osteoporosis has gradually attracted people’s attention due to insidious onset, high incidence, and the risks of disability. Danielson KK et al [1] found that the incidence of fractures in pre-menopausal women with type I diabetes was significantly higher than that in the control population, and accompanied by the significantly decreased bone density in heel and forearm. Oei L et al [2] found that fracture risk in type II diabetes patients with poor glycemic control increased by 47%-62% compared with non-diabetic patients and those with good glycemic control. Osteoblasts and osteoclasts are the two major cells to maintain bone mass in bone remodeling. Osteoblasts mainly secret bone matrix, and osteoclasts are directly involved in bone resorption. Osteoblasts and osteoclasts maintain a certain mutual restraint under normal circumstances; the bone formation and resorption mediated by them are in balance. Once this balance is abnormal, it will affect bone formation and resorption. Mazess et al [3] suggest that osteoblast degeneration could cause defects in osteogenic conditions and changes in structural and mechanical characteristics of bone tissue, further leading to osteoporosis. Riggs et al [4], by measuring bone formation and resorption surface, believe that osteogenesis process of osteoporosis is normal, while osteoclast activity is significantly active. Either case has indicated that bone formation and resorption balance is broken in the process of osteoporosis, and bone resorption far exceeds bone formation.
Tumor necrosis factor-α (TNF-α) can change the catalytic activity of the insulin receptor tyrosine kinase, resulting in decreased self-phosphorylation of insulin receptor and insulin receptor substrate 1, causing insulin resistance, along with the whole process of the progression of diabetes [5]. In addition, TNF-α is closely related to bone metabolism [6]. Receptor activator of nuclear factor-kB ligand (RANKL) is a member of the TNF receptor ligand superfamily, playing an important role in bone metabolism; its metabolic imbalance is associated with bone destructive diseases. The level of RANKL mRNA is high in bone tissue and lymph tissue, which is a key factor mediated signaling transduction between the bone/stromal cells and osteoclasts. Through surface expression of RANKL, osteoblast cells contact with osteoclast precursor cells in cell-cell dependent manners to promote osteoclast formation [7]. Glycogen synthase kinase-3 (GSK-3) is one of the rate-limiting enzymes of glycogen synthesis; in recent years, more and more studies confirm the abnormal expression of GSK-3 in diabetic patients and animal tissues [8-10]. Through the analysis of a variety of animal models of diabetes, it has gradually confirmed that GSK-3 plays an important role in the occurrence of diabetes, especially in insulin resistance [9]. In addition, GSK-3 also plays a role in bone metabolism. Liu Na et al [11] found that in chronic inflammatory microenvironment, GSK-3 phosphorylation can affect the Wnt signaling pathway and inhibit osteogenic differentiation of periodontal ligament stem cells. However, it is not very clear that how TNF-α, GSK-3β and RANKL work in diabetic patients with osteoporosis. This study used diabetic animal models and cell models to investigate how TNF-α, GSK-3β and RANKL affect osteoblasts and osteoclasts in diabetic osteoporosis, providing new experimental data for revealing the pathogenesis of diabetic osteoporosis.
Materials and methods
Establishment of diabetic rat model and sample collection
Fresh 0.01 mol/L citrate buffer was prepared (with citric acid and trisodium citrate in certain proportion), cryopreserved at 4°C. Before use, it was mixed with streptozotocin (STZ) to formulate 2% STZ solution; for model group, 50 mg/kg single intraperitoneal injection was performed; the control group was injected a with the considerable amount of citrate buffer. In the modeling process, rat peritoneal skins were routinely disinfected with iodine. After STZ modeling, rat eating and drinking, the amount, color and taste of urine, rat mental state, body shape and coat color were observed in each group. Weight was measured once a week; in 7 d after modeling, the rat food intake was controlled, 38 g feed for each model rat and 30 g feed for each normal rat every single day. Six adult male rats with equivalent age and body weight were selected; after fasted for 12 hours, tails was cut to collect blood to measure fasting blood glucose, and then STZ 50 mg/kg was injected by intraperitoneal; 24 h later, blood glucose level was rechecked; > 16.6 mM indicated successful modeling of diabetic rats. Rats were sacrificed by excess intraperitoneal injection (2 times the normal dose of anesthesia) of 7% chloral hydrate; the sacrificed rats were fixed in prone position, with alcohol swab to wipe the skin of drawn parts, with ophthalmic scissors and tweezers and other ophthalmic devices to carefully remove L6 vertebrae and left femur tissues, which were fixed and preserved in 10% formaldehyde or 4% paraformaldehyde.
Rat bone morphology observation and HE staining
The fixed L6 vertebrae and left femur tissues were washed with tap water, dehydrated by gradient alcohol, transparent by xylene, immersed in Paraffin, Paraffin-embedded and repaired to prepare into slices; under a microscope the bone tissue morphology of control rats and diabetic rats was observed.
ELISA assay to detect serum OC, RANKL, GSK-3, P38mapk, TNF-α and INS levels
The study used ELISA kits and double antibody sandwich assay to detect the serum levels of osteocalcin (OC), receptor activator of nuclear factor kb ligand (RANKL), glycogen synthase kinase-3β (GSK-3β), P38 mitogen-activated protein (P38mapk), tumor necrosis factor (TNF-α) and insulin (INS) in rats. Microplates were coated respectively with purified OC, RANKL, GSK-3β, P38mapk, TNF-α and INS antibodies, then combined with HRP-labeled OC, RANKL, GSK-3β, P38mapk, TNF-α and INS antibodies to form antibody-antigen-enzyme-antibody complex; after washing Completely, TMB substrate was added for color. TMB conversed into the blue in HRP enzyme catalysis, and finally conversed into the yellow in the role of acid. The depth of color was positively correlated with the contents of OC, RANKL, GSK-3β, P38mapk, TNF-α and INS. Then the absorbance (OD) at 450 nm was determined by a microplate reader; the concentrations of OC, RANKL, GSK-3β, P38mapk, TNF-α and INS were calculated by standard curve.
Primary culture and identification of osteoblasts
The successful SD model rats and SD control rats were sacrificed and soaked in 75% ethanol for 5 min. Femurs were collected under sterile conditions; after removing the residual blood and fat tissue, the femurs were placed into another dish filled with DMEM/F12 complete medium to wash again. The backbone was cut into 2~5 mm2 fragments; the washed bone fragments were pre-digested with 2 ml 0.25% trypsin for 15 min to remove fibrous tissue cells; the supernatant was discarded (which mainly contained fibroblasts). Then cells were digested with 10 ml 0.1% collagenase II for 20 minutes at 37°C, and then digested for another 20 minutes with magnetic stirring at room temperature. After standing for a few minutes, digested solution was collected and centrifuged at 1200 rpm at room temperature for 10 minutes. The supernatant was removed; cells was suspended with 4 ml DMEM/F12 medium containing 20% FBS and inoculated into 75 ml flasks; 8 ml culture medium was added to make the liquid volume reach 12 ml; after standing, the precipitate can be re-digested with collagenase for 20 minutes and for 15 minutes with magnetic stirring, and centrifuged for 10 minutes; the 3 bottles of cells were placed in the carbon dioxide incubator, and cultured at 5% CO2, 95% air, and 37°C. After 24 hours, the cells showed adherent growth and cell cytoplasm began stretching; medium was replaced with fresh medium; later the medium was changed every 48 hours (Note: digestion was performed according to the specific case; it could be performed one more time). when passaging, one bottle of well-growing and moderately elastic adherent osteoblasts was collected; the culture medium was discarded; cells were firstly rinsed with PBS for two times, and then digested with 1 ml 0.25% trypsin at room temperature for 3 to 5 minutes; the trypsin solution was discarded, and DMEM/F12 medium was added to fully pipette for 8-10 minutes. The digested cells were collected, gathered, and counted; the cell concentration was adjusted to an appropriate concentration with F12 complete medium. The osteoblasts of 2nd-5th generations were used for the experiment. Osteoblasts were identified by immunohistochemistry.
Primary culture and identification of osteoclasts
The successful SD model rats and SD control rats were sacrificed and soaked with 75% ethanol for 5 min. Under sterile conditions, bilateral femur and tibia were collected, and the fat tissue and blood were removed; after rinsing, the bone tissues were placed into a dish filled with DMEM/F12 complete medium. Femoral shaft was cut longitudinally; the medial femur was gently scraped with a scalpel, meanwhile flushing the inner surface of femur with the culture medium to collect cells. The cell suspension was centrifuged and resuspended with DMEM/F12 medium containing 15% fetal bovine serum, 1,25-(OH)2D3, penicillin and streptomycin.
Then cells were incubated in the plates with thin piece of bone or cover glass. The culture medium was changed every three days; on the 5th day, the medium was replaced with serum-free medium. Osteoclasts were identified by tartrate-resistant acid phosphatase (TRAP) staining.
MTT assay to detect cell proliferation
Cells in the exponential growth phase were collected; the cell suspension was adjusted to a concentration of 1 × 10⁵ cells/ml with DMEM medium containing 10% fetal bovine serum; cells were seeded in 96-well plates, 100 μl of cell suspension in each well, placed in a 37°C incubator with 5% CO2; on the next day, after synchronized by serum-free medium for 24 h, the culture medium was replaced with complete medium and administration was performed according to the grouping (negative control group, GSK-3β inhibitor group, lithium chloride group , TNF-α antagonist group, RANKL antagonist group), cultured for 12 h; and then medium was replaced with fresh medium and cells were cultured for 24 h, 48 h and 72 h; MTT (5 mg/ml) was added, 10 μl/well; cell were cultured for 4 h in a 37°C, 5% CO2 incubator; After culture, supernatant liquid was discarded and duplicate wells was added 100 μl DMSO solution, shocking 10 min on a shaker to dissolve the crystal; A absorbance values of each well at 490 nm were detected using a microplate reader. According to the mean, cell proliferation rate was calculated; the experiment was repeated three times.
QRT-PCR to detect the effect of GSK-3β inhibitor and lithium chloride on TNF-α and RANKL gene expression in osteoblasts and osteoclasts, and the effect of TNF-α and RANKL antagonists on GSK-3β gene expression in osteoblasts and osteoclasts
Design QRT-PCR primers for TNF-α, RANKL, GSK-3β and internal control gene β-actin; primers were as follows: TNF-α F: GCCACCACGCTCTTCTGTC, TNF-α R: GCTACGGGCTTGTCACTCG; RANKL F: TGATGGAAGGTTCGTGGCTC, RANKL R: CTTGGCCCAGCCTCGATC; GSK-3β F: CCATCCTTATCCCTCCTCACG, GSK-3β R: GGTAGAGTTGGAGGCTGATGC; β-actin F: CCCATCTATGAGGGTTACGC, β-actin R: TTTAATGTCACGCACGATTTG. RNA samples were extracted in each group; the total volume of the reverse transcription system was 20 μl (2 × RT buffer 10 μl, 6 N random primer (100 pmol/μl) 1 μl, RT-mix 1 μl, template (RNA) 5 μl, DEPC water 3 μl); the reaction conditions were as follows: 25°C for 10 min, 42°C for 50 min, 85°C for 5 minutes; the total volume of fluorescence quantitative PCR reaction system was 50 μl (2 × PCR buffer 25 μl, Primers (25 pmol/μl) 1 μl × 2, Sybr green I (20*) 0.5 μl, template (cDNA) 2 μl, DEPC water 20.5 μl), the reaction conditions were: 94°C 4 min; 94°C 20 s, 60°C 30 s; 72°C 30 s, a total of 35 cycles, 72°C detecting signal.
Results
Bone tissue morphology of diabetic rat model
As shown in Figure 1, the trabecular bone of the left femur and L6 vertebrae in normal rats was abundant, continuous and dense; marrow cavity was enriched; in the left femur and L6 vertebrae of diabetic rats, marrow cavity became larger, and the number of trabecular bone significantly decreased, with smaller diameters and wider gaps. Trabecular bone disappeared in some regions. Overall bone mass reduced; intramedullary contents reduced and leaked, in line with the typical characteristics of osteoporosis.
Figure 1.
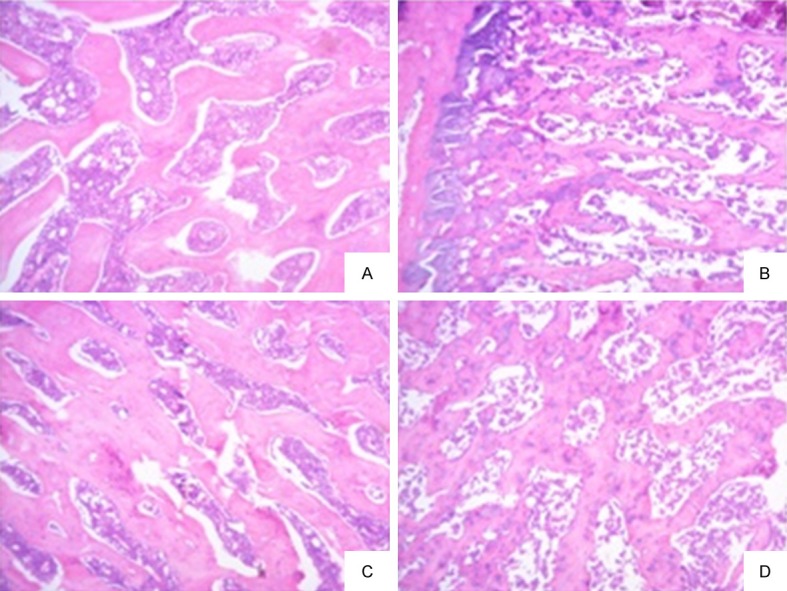
Bone tissue observation in diabetic rats and normal rats. A. The left femur of control group; B. The left femur of diabetic model group; C. L6 vertebrae of control group; D. L6 vertebrae of diabetic model group.
Serum levels of OC, RANKL, GSK-3β, P38mapk, TNF-α and INS
As can be seen from Figure 2, compared with the normal group, RANKL, GSK-3β, P38mapk and TNF-α levels were significantly higher in diabetic model group, while osteocalcin (OC) and serum insulin (INS) levels were significantly lower, indicating successful diabetes and osteoporosis modeling.
Figure 2.
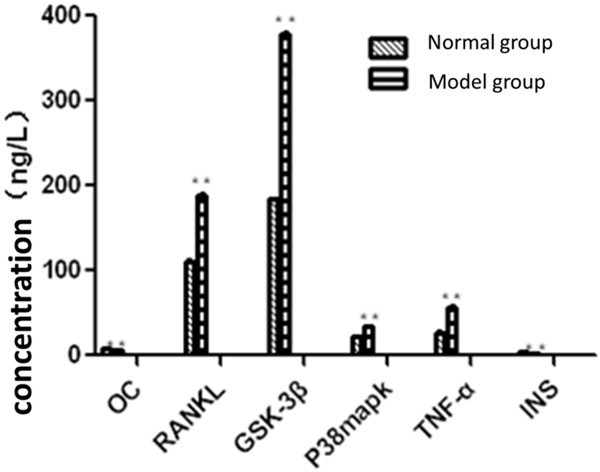
Comparison of the serum concentration of testing items.
Primary culture and identification of osteoblasts and osteoclasts
Figure 3 showed that, the majority of osteogenic cells were scaly-shaped and larger, with many pseudopodia and abundant cytoplasm; osteoclasts had abundant cytoplasm and smaller volume; there was little difference in osteoblasts and osteoclasts between normal and model groups. In Figure 4, immunohistochemical staining showed that in normal and model groups, cytoplasm was brown and nucleus was blue, indicating successful isolation and culture of osteoblasts. In Figure 5, TRAP staining of the normal group and model group showed that osteoclast cytoplasm was positive, red wine, but nuclear was negative, indicating successful isolation and culture of osteoclasts.
Figure 3.
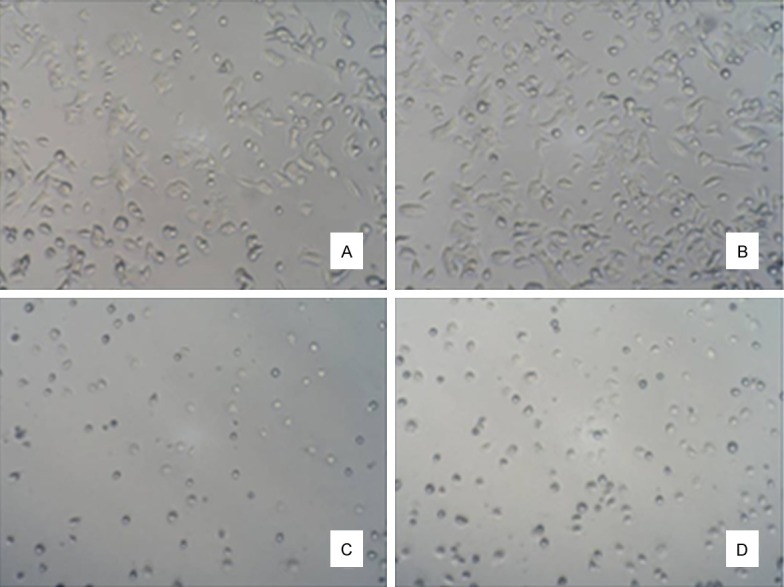
Primarily cultured osteoblasts and osteoclasts. A. Normal osteoblasts (100 ×); B. Diabetic osteoblasts (100 ×); C. Normal osteoclasts (100 ×); D. Diabetic osteoclasts (100 ×).
Figure 4.
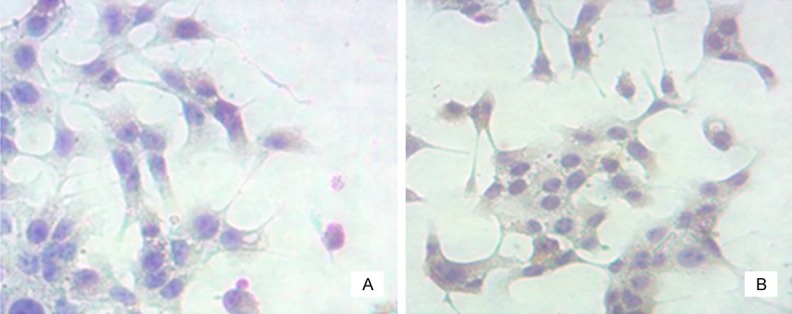
Identification of osteoblasts. A. Normal osteoblasts (200 ×); B. Diabetic osteoblasts (200 ×).
Figure 5.
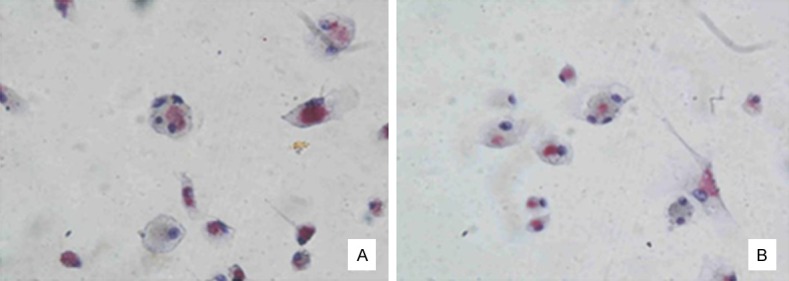
Identification of osteoclasts. A. Normal osteoclasts (400 ×); B. Diabetic osteoclasts (400 ×).
Cell proliferation detection
It is seen from Figure 6 that osteoclast proliferation in GSK-3β inhibitor and lithium chloride groups were weaker than the untreated group, while osteoclast proliferation in TNF-α antagonist group and RANKL antagonist group was close to the untreated group. Figure 7 showed that, osteoblast proliferation in GSK-3β inhibitor and lithium chloride groups were weaker than the untreated group, while osteoblast proliferation in TNF-α antagonist group and RANKL antagonist group was higher than untreated group. In all of the corresponding groups, cell proliferation in the diabetic group was stronger than the untreated group.
Figure 6.
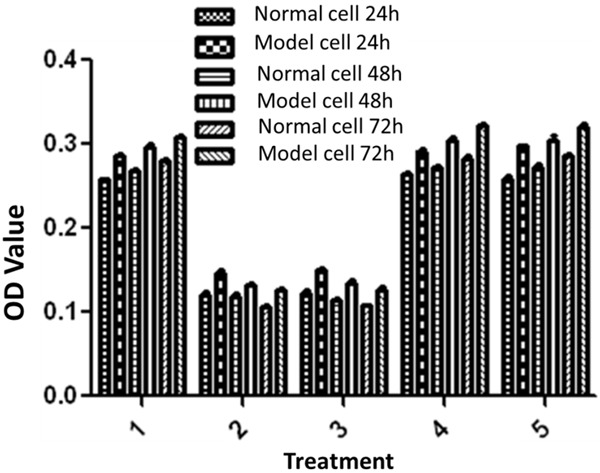
MTT results of osteoclasts: 1. Negative control group; 2. GSK-3β inhibitor group (Final concentration was 5 mM); 3. Lithium chloride group; (Final concentration was 5 mM); 4. TNF-α antagonist group; (Final concentration was 10 μg/ml); 5. RANKL antagonist group (Final concentration was 10 ug/ml).
Figure 7.
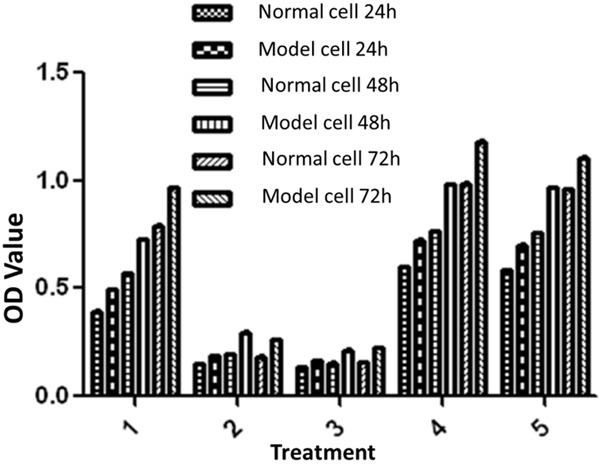
MTT results of osteoblasts: 1. Negative control group; 2. GSK-3β inhibitor group (Final concentration was 5 mM); 3. Lithium chloride group (Final concentration was 5 mM); 4. TNF-α antagonist group (Final concentration was 10 ug/ml); 5. RANKL antagonist group (Final concentration was 10 ug/ml).
Effect of GSK-3β inhibitors and lithium chloride on TNF-α and RANKL gene expression in osteoblasts and osteoclasts, respectively; the impact of TNF-α and RANKL antagonists on GSK-3β gene expression in osteoblasts and osteoclasts.
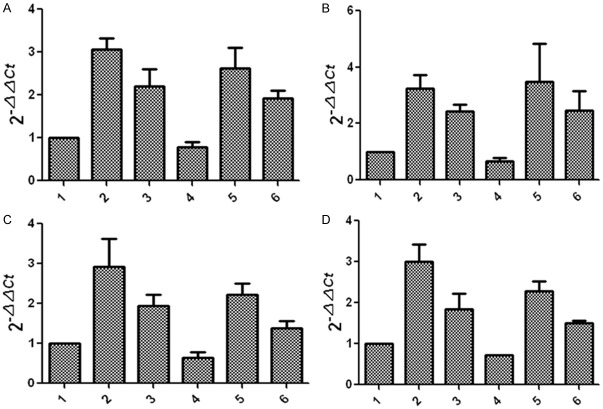
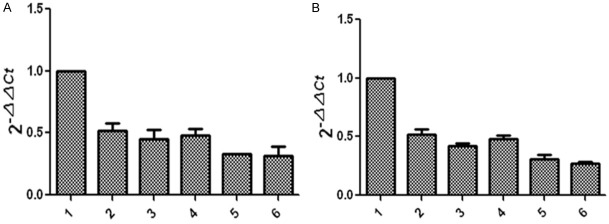
Figure 8 showed that, compared with the untreated control group, TNF-α and RANKL gene expression levels were elevated in GSK-3β inhibitor and lithium oxide groups, but TNF-α and RANKL gene expression levels in diabetic group were slightly lower than those in the control group. Figure 9 showed that, compared with the untreated control group, GSK-3β gene expression levels in TNF-α and RANKL antagonist treatment groups reduced; GSK-3β gene expression level in diabetic group was lower than that in the control group.
Figure 8.
Effects of GSK-3β inhibitor and lithium chloride on TNF-α (A) and RANKL (B) gene expression in osteoblasts and TNF-α (C) and RANKL (D) gene expression in osteoclasts: 1, the control group (control rats); 2, GSK-3β inhibitor group (control rats); 3, lithium chloride group (control rats); 4, the control group (diabetic rats); 5, GSK-3β inhibitor group (diabetic rats); 6, lithium chloride group (diabetic rats).
Figure 9.
Effect of TNF-α and RANKL antagonists on gene expression of GSK-3β in osteoblasts (A) and osteoclasts (B): 1, the control group (control rats); 2, TNF-α antagonist group (control rats); 3, RANKL antagonist group (control rats); 4, the control group (diabetic rats); 5, TNF-α antagonist group (diabetic rats); 6, RANKL antagonist group (diabetic rats).
Discussion
TNF-α is a cytokine with numerous biological functions, which is a key regulator in inflammatory reaction and immune response [12]. Experiments have proved that it is highly expressed in insulin-resistant and diabetes animal models; population-based study also found that plasma TNF-α levels were related with diabetes and the occurrence of macro vascular disease [13-16]. In this study, serum TNF-α was detected by Elisa in diabetic rats, and the results showed that serum TNF-α in diabetic rats was significantly higher than that in the normal group, which was similar to the results of previous studies. An Guifeng et al [17] have found that in a mouse model of osteoporosis, TNF-α expression increased, and enhanced osteoclast activity together with IL-6 and IL-1β; so bone resorption was greater than bone formation, resulting in bone osteoporosis. The study found that TNF-α can inhibit the proliferation of osteoblasts but had little effect on osteoclast proliferation; the combined effect broke the balance between osteoblasts and osteoclasts, leading to osteoporosis.
GSK-3β is involved in a number of cellular signaling pathways. Cohen P et al believe that GSK-3β inhibitors can alleviate insulin resistance, which could be used for the treatment of type 2 diabetes [18]. This study found that serum levels of GSK-3β in diabetic rat model increased, and GSK-3β could promote the proliferation of osteoblasts and osteoclasts, but the combined effect of GSK-3β was to cause osteoporosis. Lithium chloride (LiCl), as an inhibitor of GSK3β, could significantly increase the bone formation rate and bone quantity in C57BL/6 mice in 4 weeks. Experimental data in this study suggest that, serum RANKL levels increased in diabetic rats, indicating that it may play a role in diabetes process. Kiechl S et al in Medical University of Innsbruck, Austria [19] analyzed an epidemiological study and laboratory study and found that blocking RANKL (receptor activation factor of NF-κB ligand) signaling transduction can improve liver insulin resistance and prevent the progression of diabetes. This study also found that RANKL can inhibit the proliferation of osteoblasts but had little effect on osteoclast proliferation; While Liu Jizhong et al [20] found that RANKL knockout mouse had developmental disorders in osteoclasts and osteoclast formation reduced, resulting in severe bone sclerosis; and after injection of exogenous RANKL, osteoclast formation and reduction in bone deformities had been observed, suggesting that the effect of RANKL on osteoblasts and osteoclasts had a deeper mechanism, which needs further study.
This paper also studied the relationship among TNF-α, GSK-3β and RANKL and found that GSK-3β can inhibit the expression of TNF-α and RANKL; TNF-α and RANKL can promote GSK-3β gene expression; and the three play an important role in diabetes and osteoporosis process. They may influence each other through a complex network of signaling pathways to participate in the pathogenesis of diabetic osteoporosis.
Disclosure of conflict of interest
None.
References
- 1.Danielson KK, Elliott ME, Le Caire T, Binkley N, Palta M. Poor glycemic control is associated with low BMD detected in premenopausal women with type 1 diabetes. Osteoporos Int. 2009;20:923–933. doi: 10.1007/s00198-008-0763-3. [DOI] [PMC free article] [PubMed] [Google Scholar]
- 2.Oei L, Zillikens MC, Dehghan A, Buitendijk GH, Castaño-Betancourt MC, Estrada K, Stolk L, Oei EH, van Meurs JB, Janssen JA, Hofman A, van Leeuwen JP, Witteman JC, Pols HA, Uitterlinden AG, Klaver CC, Franco OH, Rivadeneira F. High bone mineral density and fracture risk in type 2 diabetes as skeletal complications of inadequate glucose control: The Rotterdam Study. Diabetes Care. 2013;36:1619–1628. doi: 10.2337/dc12-1188. [DOI] [PMC free article] [PubMed] [Google Scholar]
- 3.Mazess RB. Fracture risk: a role for compact bone. Calcif Tissue Int. 1990;47:191–193. doi: 10.1007/BF02555918. [DOI] [PubMed] [Google Scholar]
- 4.Riggs BL, Khosla S, Melton LJ 3rd. Sex steroids and the construction and conservation of the adult skeleton. Endocr Rev. 2002;23:279–302. doi: 10.1210/edrv.23.3.0465. [DOI] [PubMed] [Google Scholar]
- 5.Doherty RO, Stein D, Foley J. Insulin resistance. Diabetologia. 1997;40:B10. doi: 10.1007/BF03168180. [DOI] [PubMed] [Google Scholar]
- 6.Zhou LZ, Xiang Q, Liu ZH. Rational use of osteoporosis treatment of bone metabolism markers Directory (2004 Edition) Zhong Guo Gu Zhi Shu Song Za Zhi. 2004;10:397–404. [Google Scholar]
- 7.Ann EK, Sundeep K, Paul K. RANKL and OPG regulation of bone remodeling in health and disease. Endocrine Reviews. 2008;29:155–192. doi: 10.1210/er.2007-0014. [DOI] [PMC free article] [PubMed] [Google Scholar]
- 8.Dokken BB, Henriksen EJ. Chronic selective glycogen synthase kinase-3 inhibition enhances glucose disposal and muscle insulin action in prediabetic obese Zucker rats. Am J Physiol Endocrinol Metab. 2006;291:207–213. doi: 10.1152/ajpendo.00628.2005. [DOI] [PubMed] [Google Scholar]
- 9.Henriksen EJ. Dysregulation of glycogen synthase kinase-3 in skeletal muscle and the etiology of insulin resistance and type 2 diabetes. Curr Diabetes Rev. 2010;6:285–293. doi: 10.2174/157339910793360888. [DOI] [PubMed] [Google Scholar]
- 10.Qu Z, Jiao Z, Sun X, Zhao Y, Ren J, Xu G. Effects of streptozotocin-induced diabetes on tau phosphorylation in the rat brain. Brain Res. 2011;1383:300–306. doi: 10.1016/j.brainres.2011.01.084. [DOI] [PubMed] [Google Scholar]
- 11.Liu N, Jiang GX, Zhao B. Glycogen synthase kinase 3β osteogenic differentiation of periodontal ligament stem cells in inflammatory states. Journal of Internal Medicine, Zhong Hua Lao Nian Kou Qiang Yi Xue Za Zhi. 2014;12:129–133. [Google Scholar]
- 12.Hotarnisigil GS, Shargill NS, Sp iegelman BM. Adipose expression of tumor necrosis factor-alpha: direct role in obesity-linked insulin resistance. Science. 1993;259:87. doi: 10.1126/science.7678183. [DOI] [PubMed] [Google Scholar]
- 13.Grigsby RJ, Dobrowsky RT. Inhibition of ceramide production reverses TNF-induced insulin resistance. Biochem Biophys Res Commun. 2001;287:1121–1124. doi: 10.1006/bbrc.2001.5694. [DOI] [PubMed] [Google Scholar]
- 14.Deng ZZ, Qian RL. Lipid metabolism and treatment of Diabetes. Zhong Guo Tang Niao Bing Za Zhi. 2001;9:251–252. [Google Scholar]
- 15.Jia SD. Tumor necrosis factor-α and insulin resistance. Liao Ning Shi Yong Tang Niao Bing Za Zhi. 2004;12:50–52. [Google Scholar]
- 16.Wachlin G, Augstein P, Schroder D, Kuttler B, Klöting I, Heinke P, Schmidt S. IL-1beta, IFN-gamma and TNF-alpha increase vulnerability of pancreatic beta cells to autoimmune destruction. J Autoimmun. 2003;20:303–312. doi: 10.1016/s0896-8411(03)00039-8. [DOI] [PubMed] [Google Scholar]
- 17.An GF, Tu GJ. Expression characteristics of IL-6, IL-1β, TNF-α is in bone tissue. Zhong Guo Yi Ke Da Xue Xue Bao. 2005;34:97–99. [Google Scholar]
- 18.Cohen P, Gocdert M. GSK3 inhibitors: development and therapeutic potential. Nat Rev Drug Discov. 2004;3:479. doi: 10.1038/nrd1415. [DOI] [PubMed] [Google Scholar]
- 19.Kiechl S, Wittmann J, Giaccari A, Knoflach M, Willeit P, Bozec A, Moschen AR, Muscogiuri G, Sorice GP, Kireva T, Summerer M, Wirtz S, Luther J, Mielenz D, Billmeier U, Egger G, Mayr A, Oberhollenzer F, Kronenberg F, Orthofer M, Penninger JM, Meigs JB, Bonora E, Tilg H, Willeit J, Schett G. Blockade of receptor activator of nuclear factor-κB (RANKL) signaling improves hepatic insulin resistance and prevents development of diabetes mellitus. Nat Med. 2013;19:358–63. doi: 10.1038/nm.3084. [DOI] [PubMed] [Google Scholar]
- 20.Liu JZ, Ji ZL, Chen SM. OPG/RANKL/RANK System and bone destructive disease. Sheng Wu Gong Cheng Xue Bao. 2003;19:655–659. [PubMed] [Google Scholar]


