

Abstract
Objective: To explore association of peroxisome proliferator-activated receptor gamma (PPAR-γ) and phosphatase and tensin homolog (PTEN) expressions with prognosis of renal cell carcinoma (RCC). Methods: Our study subjects included 87 RCC tissues, 28 paracarcinoma tissues and 21 normal renal tissues. PPAR-γ and PTEN detection was conducted using immunohistochemistry staining. The association of PPAR-γ and PTEN with the clinical parameters and prognosis of RCC was analyzed. Kaplan-Meier method and Cox’s proportional hazards regression model were used for exploring the relation between variables and prognosis. Results: Among normal renal tissues, para-carcinoma tissues and renal cell carcinomas, positive PPAR-γ expression presented with a progressive tendency (P < 0.001), while positive PTEN expression a degressive tendency (P < 0.001). PPAR-γ expressions were closely related to tumor size, clinical stage and lymph node metastases (all P < 0.05). PTEN expressions were in close association with tumor size, Fuhrman grading, lymph node metastases (all P < 0.05). PPAR-γ expressions were in a negative relation with PTEN expressions (r = -0.417, P < 0.001). Negative PPAR-γ expressions confer a significantly higher overall survival rate than positive PPAR-γ expressions (P = 0.015), while negative PTEN expressions confer a significantly lower overall survival rate than positive PTEN expressions (P = 0.003). Clinical staging, Fuhrman grading, lymph node metastases, PPAR-γ and PTEN were independent prognostic factors for prognosis (all P < 0.05). Conclusion: PPAR-γ and PTEN expressions are related to the clinical parameters and prognosis of RCC and may be a biomarker for prognosis of RCC.
Keywords: PPAR-gamma, PTEN, renal cell carcinoma, survival, prognosis
Introduction
Renal cell carcinoma (RCC), also renal neoplasm, is the most common cancer type in urinary system, accounting for 2%-3% of adults malignances and representing approximately 90% of all neoplasms arising from the kidney [1]. The last two decades witnessed an annual increase of nearly 2% in incidence worldwide, with 338,000 newly-diagnosed renal carcinomas and 143,000 deaths from kidney cancer worldwide in 2012 alone [1,2]. According to 2004 WHO classification and the modification of the international society of Urological Pathology (ISUP) Vancouver Classification, RCC covers different subtypes with specific histopathological and genetic characteristics, three important subtypes being clear cell RCC (ccRCC; 80%-90%), papillary RCC (pRCC; 10%-15%) and chromophobe RCC (chRCC; 4%-5%) [3]. For the lack of such classic symptoms as flank pain, hematuria and flank mass as well as the diversity of clinical symptoms, up to 30% of patients with RCC are diagnosed at the metastatic stage, leading to poor prognosis, low 5-year survival (about 49%) and high recurrence of localized tumor (about 40%) [1,4]. Therefore, it is essential to figure out effective biomarkers for prognosis of RCC.
Peroxisome proliferator-activated receptor gamma (PPAR-γ) is a ligand-activated receptor and a member of nuclear hormone receptor family [5]. Being activated by ligand, PPAR-γ produces a heterodimer complex binding to retinoic acid (RXR). And then this complex translocates to the nucleus and combines with a peroxisome proliferator response element (PPRE) within a target gene [6]. PPAR-γ plays an important role in carcinogenesis as a tumor suppressor by promoting cell differentiation, inductive of increased cell apoptosis and its ligands may inhibit angiogenesis through downregulation of vascular endothelial growth factor (VEGF) [7]. PPAR-γ expression or overexpression is detected in tumor cells from different sites, including bladder cancer, breast cancer and colorectal cancer, renal cancer and so on [6,8,9]. Previous studies suggest that PPAR-γ is a potential biomarker for diagnosis and prognosis of cancers [10,11]. Phosphatase and tensin homolog (PTEN) is a tumor suppressor inhibiting several key signaling pathways. Its lipid phosphatase activity negatively regulates PDK1-mediated Akt phosphorylation by dephosphorylating PIP3 to PIP2 and thereby decreases [6]. Meanwhile, PTEN’s protein phosphatase activity can prevent cell spreading and migration through dephosphorylation of focal adhesion kinase (FAK) and promote cell differentiation and apoptosis by inhibiting SHC/SOS/GRB2 and mitogen-activated protein kinase (MAPK) pathways [6]. Previous studies suggest that PPAR-γ can regulate PTEN gene transcription, work together with PTEN to induce cell cycle arrest and become one of the most attractive anti-cancer mechanism [12-14]. In this study, we investigate the association of PPAR-γ and PTEN expressions and the clinical parameters and prognosis of RCC and explore the relation between PPAR-γ and PTEN in RCC.
Materials and methods
Ethic statement
This case-control study was approved by the Institutional of Huaihe Hospital, Henan University, Henan, China. Written informed consents were obtained from the legal guardians of all enrolled pediatric subjects and the study conformed to the guidelines and principles of Declaration of Helsinki [15].
Subjects
The case group included 87 RCC tissues collected from the radical nephrectomies conducted in Huaihe Hospital of Henan University from January 2010 to July 2012. Included RCC tissues were from: 1. Patients accepting their first radical nephrectomy with no history of radiotherapy, chemotherapy or targeted therapy or administration of related immunity drugs. 2. Patients of complete pathological, clinical and follow-up data. 3. Patients with no history of other renal diseases and systemic diseases, other tumors and other surgeries. 4. Patients pathologically diagnosed with RCC. Included patients consisted of 56 males and 31 females with a mean age of 53.4 ± 16.2. Of 87 patients, 60 patients were diagnosed with clear cell carcinoma, 18 with papillary carcinoma, 5 with chromophobe carcinoma, and 4 patients with unclassified RCC. According to standards of clinical stages of RCC by United States Joint Committee on cancer (AJCC) in 2009, 87 RCC tissues were staged (stage I, n = 26; stage II, n = 32; stage III, n = 23 and stage IV, n = 4) [16]. By Fuhrman grading system for RCC, 87 RCC tissues were leveled (level I, n = 22; level II, n = 37; level III, n= 17 and level IV, n = 11) [17]. On basis of imaging data and postoperative pathology data, there were 24 cases with lymph node metastasis and 63 cases without lymph node metastasis among the 87 RCC specimens. The control group included 28 para-carcinoma specimens 2 cm away from the tumor tissue and 21 normal renal tissues from the patients accepting open surgery because of renal trauma and kidney stones. All the 21 normal tissues were confirmed by histopathologic examination. All the collected specimens were fixed in the neutral formalin, hyalinized, dehydrated, and embeded with liquid paraffin for immunohistochemistry staining.
Immunohistochemistry staining
All specimens were fixed in 10% formalin for 24 hours and then embedded in conventional paraffin for archiving. The specimen-embedded paraffin was cut into 4 consecutive 5-μm slices, with known positive slice as a positive control, and PBS buffer as a negative control in substitution for primary antibodies. Dewaxing and hydration conducted, slices were flushed with PBS (pH 7.4) buffer three times, 3 minutes each. 1-drop or 50-ul peroxidase blocking solution was subsequently added to each slice for blocking endogenous peroxidase activity, followed by 10-min incubation at room temperature. Then slices were washed again with PBS three times, 3 min each. PBS solution wiped off, 1-drop or 50-μl non-immune serum was added to each slice, followed by 10-min incubation at room temperature for 10 minutes. After serum removal, 1-drop of 50-μl primary antibodies (rabbit anti human PPAR-γ monoclonal and rabbit anti-human PTEN monoclonal antibody purchased from Wuhan Boster Biological Engineering Co., Ltd) was added to each slice, followed by 60-min incubation at room temperature or overnight 4 incubation at 4 C and 5-min PBS rinse for three times. PBS solution was removed, and 1-drop or 50-μl biotin-labeled second antibody was added to each slice, followed by 10-min incubation at room temperature. Then slices were washed with PBS three times, 3 min each. PBS solution was eliminated, and 1-drop or 50-μl streptavidin-perosidase solution was added to each slice, followed by 10-min incubation at room temperature. Slices were washed with PBS three times, 3 min each. Then slices were washed in tap water, counterstained with hematoxylin (Beijing reagent factory), decomposed in 0.1% HCL, rinsed with 0.1% ammonia or PBS and converted to blue. Slices were colored with DAB, dewatered and dried with graded ethanol, vitrificated by dimethylbenzene and sealed with rubber.
Result interpretation
Examination was conducted with a pathological image analyzer (QMR+Q550 by Lycra Company in German). PPAR-γ and PTEN were located in the cytoplasm, with yellowish-brown or yellow cytoplasm or nucleus interpreted as positive. Slices were observed at × 400 magnifications in 10 randomly selected fields. The scoring system was based on the percentage of positive cells and intensity of the cell staining: < 1% scored as 0 point, 1%~25% as 1 point, 25%~50% as 2 points, 51%~75% as 3 points and > 75% as 4 points; colorless scored as 0 point, light yellow as 1 point, brownish-yellow as 2 points and dark yellow as 3 points. Determination was conducted by the product of these two scores, with 0 point defined as negative (-), 1~2 points as positive (++), and > 2 points as strongly positive (+++). Determination was conducted under a double blind model.
Statistical analysis
SPSS 18.0 software was used for data analysis. χ2 test was performed for data correlation analysis, Spearman rank correlation test for correlation analysis on the two proteins in RCC, Kaplan-Meier analysis for survival analysis, Log-rank test for comparing the survival curves, and COX proportional hazards regression model for exploring the relation between variables and prognosis. P < 0.05 indicated significant differences.
Results
PPAR-γ expressions
As shown in Figure 1, cytoplasm showed a high expression of positively-stained PPAR-γ which presented in granular form, and yellow or dark brown color, while nuclei was hardly stained. As shown in Table 1, 4 of 21 normal tissues (19%), 11 of 28 para-carcinoma tissues (39.3%) and 57 of 87 tumor tissues (65.5%) conferred positively-stained PPAR-γ. In the cytoplasm of normal tissues, para-carcinoma tissues and RCC tissues, positive PPAR-γ expressions presented with a progressive tendency (χ2 = 16.342, P < 0.001).
Figure 1.

Expressions of PPAR-γ in different renal tissues. A: Positive PPAR-γ expressions in RCC tissues (× 400); B: Weakly positively PPAR-γ expressions in paracarcinoma (× 400); C: Negative PPAR-γ expressions in normal kidney tissues (× 400). Note: PPAR-γ, peroxisome proliferators-activated receptor gamma.
Table 1.
PPAR-γ expressions in the cytoplasm of normal tissues, the cytoplasm of para-carcinoma tissues and the cytoplasm of renal cell carcinomas
| Number of cases | PPAR-γ expressions | Positive rate (%) | χ2 | P | |||
|---|---|---|---|---|---|---|---|
|
| |||||||
| - | + | ++ | |||||
| Normal tissues | 21 | 17 | 4 | 0 | 19 | 16.342 | < 0.001 |
| Para-carcinoma tissues | 28 | 17 | 8 | 3 | 39.3 | ||
| RCC tissues | 87 | 30 | 25 | 32 | 65.5 | ||
Note: PPAR-γ, peroxisome proliferator-activated receptor gamma; RCC, renal cell carcinoma.
PTEN expressions
As shown in Figure 2, positively-stained PTEN mostly concentrated in the cytoplasm and seldom expressed in nucleus. PTEN presented in form of dark yellow or dark brown granules. As shown in Table 2, 20 of 21 normal tissues (95.2%), 18 of 28 para-carcinoma tissues (64.3%) and 36 of 87 RCC tissues (41.4%) conferred positively-stained PTEN. In the cytoplasm of normal kidneys, para-carcinoma tissues and RCC tissues, positive PTEN expressions presented with a degressive tendency (χ2 = 21.172, P < 0.001).
Figure 2.

Expressions of PTEN in different renal tissues. A: Negative PTEN expressions in RCC tissues (× 400); B: Weakly positively PTEN expressions in para-carcinoma tissues (× 400); C: Positive PTEN expressions in normal kidney tissues (× 400). Note: PTEN, phosphatase and tensin homolog.
Table 2.
PTEN expressions in the cytoplasm of normal tissues, the cytoplasm of para-carcinoma tissues and the cytoplasm of renal cell carcinomas
| Number of cases | PTEN expression | Positive rate (%) | χ2 | P | |||
|---|---|---|---|---|---|---|---|
|
|
|||||||
| - | + | ++ | |||||
| Normal tissues | 21 | 1 | 8 | 12 | 95.2 | 21.172 | < 0.001 |
| Para-carcinoma tissues | 28 | 10 | 11 | 7 | 64.3 | ||
| RCC tissues | 87 | 51 | 22 | 14 | 41.4 | ||
Note: PTEN, phosphatase and tensin homolog; RCC, renal cell carcinoma.
PPAR-γ expressions and clinic pathologic parameters of RCC
As shown in Table 3, PPAR-γ expressions were not markedly related to age, sex, histological type, tumor location, and Fuhrman nuclear grading (all P > 0.05). Positive PPAR-γ expressions were significantly higher in patients at stage III+IV or with tumor size ≥ 5 cm or lymph node metastasis compared with patients at stage I+II or with tumor size < 5 cm or no lymph node metastasis (all P > 0.05).
Table 3.
PPAR-γ expressions in the cytoplasm of renal cell carcinomas and the relation of PPAR-γ expressions to clinicopathologic parameters of renal cell carcinomas
| Parameters | Number of cases | PPAR-γ expressions | χ2 | P | |
|---|---|---|---|---|---|
|
| |||||
| Positive (%) | Negative (%) | ||||
| Sex | |||||
| Male | 56 | 34 (60.7) | 22 (39.3) | 0.327 | 0.567 |
| Female | 31 | 23 (74.2) | 8 (25.8) | ||
| Age | |||||
| < 60 | 49 | 32 (65.3) | 17 (34.7) | 0.002 | 0.963 |
| ≥ 60 | 38 | 25 (65.8) | 13 (34.2) | ||
| Tumor size | |||||
| < 5 cm | 48 | 26 (54.2) | 22 (45.8) | 6.106 | 0.013 |
| ≥ 5 cm | 39 | 31 (79.5) | 8 (20.5) | ||
| Pathologic types | |||||
| Clear cell carcinoma | 60 | 41 (68.3) | 19 (31.7) | 1.990 | 0.370 |
| Papillary carcinoma | 18 | 12 (66.7) | 6 (33.3) | ||
| Other | 9 | 4 (44.4) | 5 (55.6) | ||
| Tumor location | |||||
| The left side | 50 | 34 (68.0) | 16 (32.0) | 0.321 | 0.571 |
| The right side | 37 | 23 (62.2) | 14 (37.8) | ||
| Clinical staging | |||||
| Stage I+II | 58 | 33 (56.9) | 25 (43.1) | 5.724 | 0.017 |
| stage III+IV | 29 | 24 (82.8) | 5 (17.2) | ||
| Fuhrman nuclear grade | |||||
| Level I+II | 59 | 38 (64.4) | 21 (35.6) | 0.011 | 0.918 |
| Level III+IV | 28 | 18 (64.3) | 10 (35.7) | ||
| Lymph node metastasis | |||||
| Yes | 24 | 20 (83.3) | 4 (16.7) | 4.656 | 0.031 |
| No | 63 | 37 (58.7) | 26 (41.3) | ||
Note: PPAR-γ, peroxisome proliferators-activated receptor gamma.
PTEN expression and its relation to clinicopathologic parameters of RCC
As shown in Table 4, PTEN expressions were not markedly related to age, sex, histological type, tumor location, and tumor size (all P > 0.05). Positive PTEN expressions were significantly lower in patients at stage III+IV or level III+IV or lymph node metastasis compared with patients at stage I+II or level I+II or no lymph node metastasis (all P > 0.05).
Table 4.
PTEN expressions in the cytoplasm of renal cell carcinoma and the relation of PTEN expressions to clinicopathologic parameters of renal cell carcinoma
| Parameters | Number of cases | PTEN expression | χ2 | P | |
|---|---|---|---|---|---|
|
| |||||
| Positive (%) | Negative (%) | ||||
| Sex | |||||
| Male | 56 | 25 (44.6) | 31 (55.4) | 0.690 | 0.406 |
| Female | 31 | 11 (35.5) | 20 (64.5) | ||
| Age | |||||
| < 60 | 49 | 22 (44.9) | 27 (55.1) | 0.573 | 0.449 |
| ≥ 60 | 38 | 14 (36.8) | 24 (63.2) | ||
| Tumor size | |||||
| < 5 cm | 48 | 21 (43.8) | 27 (56.3) | 0.248 | 0.618 |
| ≥ 5 cm | 39 | 15 (38.5) | 24 (61.5) | ||
| Pathologic types | |||||
| Clear cell carcinoma | 60 | 26 (43.3) | 34 (56.7) | 1.526 | 0.466 |
| Papillary carcinoma | 18 | 8 (44.4) | 10 (55.6) | ||
| Others | 9 | 2 (22.2) | 7 (77.8) | ||
| Tumor location | |||||
| The left side | 50 | 19 (38.0) | 31 (62.0) | 0.554 | 0.457 |
| The right side | 37 | 17 (45.9) | 20 (54.1) | ||
| Clinical staging | |||||
| Stage I+II | 58 | 30 (51.7) | 28 (48.3) | 7.676 | 0.005 |
| stage III+IV | 29 | 6 (20.7) | 23 (79.3) | ||
| Fuhrman nuclear grade | |||||
| Level I+II | 59 | 31 (52.5) | 28 (47.5) | 9.418 | 0.002 |
| Level III+IV | 28 | 5 (17.9) | 23 (82.1) | ||
| Lymph node metastasis | |||||
| Yes | 24 | 5 (20.8) | 19 (79.2) | 5.768 | 0.016 |
| No | 63 | 31 (49.2) | 32 (50.8) | ||
Note: PTEN, phosphatase and tensin homolog.
PPAR-γ expressions and PTEN expressions
As shown in Table 5, of 87 tumor tissues, 14 presented with positive PPAR-γ expressions and PTEN expressions, 8 with negative PPAR-γ expressions and PTEN expressions, 43 with positive PPAR-γ expressions and negative PTEN expressions and 22 with negative PPAR-γ expressions and positive PTEN expressions. Spearman rank correlation analysis results showed that PPAR-γ expressions and PTEN expressions were in negative association in RCC (r = 0.417, P < 0.001).
Table 5.
Association between PPAR-γ expressions in the cytoplasm of renal cell carcinomas and PTEN expressions in the cytoplasm of renal cell carcinoma
| PPAR-γ | PTEN | Total | R value | P value | |
|---|---|---|---|---|---|
|
|
|||||
| Positive (%) | Negative (%) | ||||
| Positive (%) | 14 | 43 | 57 | -0.417 | < 0.001 |
| Negative (%) | 22 | 8 | 30 | ||
| Total | 36 | 51 | 87 | ||
Note: PPAR-γ, peroxisome proliferators-activated receptor gamma; PTEN, phosphatase and tensin homolog.
PPAR-γ and PTEN expressions and prognosis of RCC
A 10 to 60-month follow-up study was conducted in 87 RCC patients providing the tumor specimens. 34 of 57 patients with positive PPAR-γ expressions died with an average survival time of 36.2 months and 9 of 30 patients with negative PPAR-γ expressions died with an average survival time of 50.4 months. According to Kaplan-Meier survival analysis (Figure 3), patients with negative PPAR-γ expressions (70.0%) had significantly better overall survival than patients with positive PPAR-γ expressions (40.4%). Log-rank test showed that the differences were statistically significant (P = 0.015). 11 of 36 patients with positive PTEN expressions died with an average survival time of 37 months and 32 of 51 patients with negative PTEN expressions died with an average survival time of 48.2 months. According to Kaplan-Meier survival analysis (Figure 4), patients with negative PTEN expressions (37.3%) had significantly worse overall survival than patients with positive PTEN expression (69.4%). Log-rank test showed that the differences were statistically significant (P = 0.003).
Figure 3.
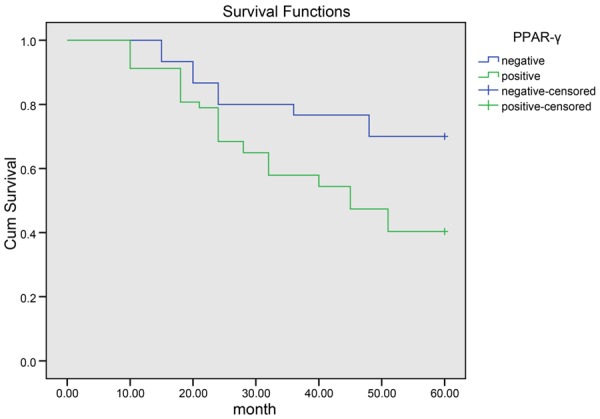
Kaplan-Meier curve of the overall survival of patients with negative expressions of PPAR-γ and patients with positive expressions of PPAR-γ. Note: PPAR-γ, peroxisome proliferators-activated receptor gamma.
Figure 4.
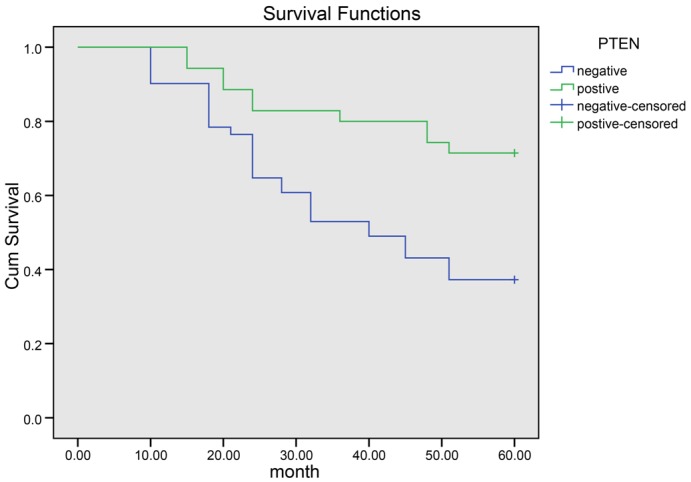
Kaplan-Meier curve of the overall survival of patients with negative expressions of PTEN and patients with positive expressions of PTEN. Note: PTEN, phosphatase and tensin homolog.
COX regression analysis and prognosis
COX proportional hazards regression model was adopted for risk analysis on age, sex, tumor size, tumor location, clinical stage, pathological types, Fuhrman grading, lymph node metastasis, PPAR-γ expression and PTEN expression. Multivariate analysis by Cox proportional hazard regression model revealed that clinical stage, Fuhrman grading, lymph node metastasis, PTEN expression and PPAR-γ expression were independent risk factors for prognosis (all P < 0.05), while age, sex, tumor size, tumor location, and pathological types had no marked relation to the survival time of patients with RCC (all P > 0.05) (Table 6).
Table 6.
Multivariate analysis by Cox proportional hazard regression model for prognosis of patients with renal cell carcinoma according to clinical staging, Fuhrman grading, lymph node, PPAR-γ and PTEN
| B | SE | Wald | Sig | Exp (B) | 95% CI | |
|---|---|---|---|---|---|---|
| Clinical staging | 1.623 | 0.366 | 19.496 | < 0.001 | 3.104 | 1.291-7.472 |
| Fuhrman grading | 0.987 | 0.461 | 4.526 | 0.003 | 2.662 | 1.080-6.561 |
| Lymph node metastasis | 1.079 | 0.478 | 5.498 | 0.018 | 2.936 | 1.195-7.154 |
| PPAR-γ | 1.135 | 0.449 | 6.963 | 0.011 | 2.698 | 1.213-5.897 |
| PTEN | -1.861 | 0.367 | 25.738 | 0.010 | 0.432 | 0.185-0.991 |
Note: PPAR-γ, peroxisome proliferators-activated receptor gamma; PTEN, phosphatase and tensin homolog; SE, standard error; Sig, significance; 95% CI, 95% confidence interval.
Discussion
We started this study to investigate the association of PPAR-γ expression and PTEN expression to the clinical parameters and prognos is of RCC and explore the relation of PPAR-γ expression and PTEN expression in RCC. PPAR-γ exerts a great influence on the tumor progression not only for its participation in the metabolism and inflammation but also for its role in cell differentiation and cell apoptosis via the activation by agonists [18-20]. Recent studies have suggested that PPAR-γ is a positive promoter in the malignant progression with its higher expression in malignant tumor than in benign tissues [21-23]. Li et al. suggested that the enhancement of PPAR-γ indirectly promotes the activity of it ligands and hence blocks the carcinogenesis and aids in the anticancer therapy [24]. On basis of the former researches, we come up with a hypothesis that PPAR-γ may be a useful predicator for prognosis of RCC which has been rarely studied in relation to PPAR-γ. According to our observation, PPAR-γ is positively expressed twice in para-carcinoma tissues as in normal renal tissues, an implication that the upregulation of PPAR-γ occurred in the early stage of RCC development. In consistent with predecessors’ observation, our results demonstrate that positive PPAR-γ expressions in normal kidney tissues (19.0%), par-carcinoma tissues (39.3%) and to tumor tissues (65.5%) are significantly different, indicating that PPAR-γ is positively related to the tumor development [25]. Moreover, we observed markedly higher PPAR-γ expressions in patients at stage III+IV and with lymph node metastasis compared with patients at stage I+II and without lymph node metastasis. In view of the above, PPAR-γ may be considered as a valuable predicative factor for clinical staging and prognosis of RCC. Notably, our follow-up study shows that the overall survival in patients with positive PPAR-γ expression is significantly lower in comparison with patients with negative PPAR-γ expression. On the contrary, previous study found that PPAR-γ ligands can increase cell differentiation and decrease malignancy [6,26]. We believe that high PPAR-γ expressions in the malignant RCC may not be activated by its ligands and therefore does not its role as a tumor suppressor.
PTEN participates in cell growth through metabolic process, cell motility and polarity via PI3K pathway, cellular senescence with activation of S phase kinase-associated protein 2 (SKP2) and the self-renewal pathway of cancer stem cell by controlling genomic stability and cell cycle progression in the nucleus [27]. Previous studies suggested that mutation in PTEN is in close association with prognosis of breast cancer and lymphatic-related metastasis of esophageal squamous cell carcinoma [28,29]. With this knowledge, we detect PTEN expression in the studied tissues. Our study finds out that PTEN expression shows a degressive trend, with positive expressions in 95.2% of normal renal tissues, 64.3% of para-carcinoma tissues and 41.4% of malignant tumor tissues. This result indicates that the loss or decrease of PTEN in the renal cells may aids in the development of RCC. In the light of clinical staging, Furhman grading and lymph node metastasis, we observed that positive PTEN expression is significantly higher in patients at stage I+II and without lymph node metastasis than in patients at stage III+IV and with lymph node metastasis. This result indicates the role of PTEN as a tumor suppressor. The decreased PTEN expression in RCC confers a decreased power of PTEN on inhibiting cell growth and promoting cell differentiation, leading to a more malignant and less differentiated state [6].
Our COX regression analysis suggests that PPAR-γ expression and PTEN expression are independent factors influencing the prognosis of patients with RCC. Previous studies reported that cell proliferation was inhibited by PPAR-γ-mediated induction of PTEN [30,31]. PPAR-γ activation stimulated by its ligands can upregulate the PTEN expression and thereby promotes Akt dephorsphorylation and apoptosis [32]. According to the data in the present study, PPAR-γ expression is in negative association with PTEN expression. What’s more, we observed that PTEN expression and PPAR-γ expression concentrated in the cytoplasm. The exact reason remains unclear. A reasonable explanation is that PPAR-γ takes part in the tumor development by dephophosrylation which is a product of PTEN’s protein activities inhibiting signaling pathways in the cytoplasm. From the above, we come to our hypothesis that high PPAR-γ expression in RCC may be activated to induce PTEN’s transcription and may provide a new therapy of RCC.
However, our study fails to figure out the exact signaling way of PPAR-γ and that of PTEN in RCC and also does not provide mechanism by which high PPAR-γ is activated to induce PTEN expression in RCC. Another limitation of our study lies in the comparatively small sample size which may impair the reliability of our results. In addition, our study sets in an in vitro environment which may also lead to bias on our results. Future efforts shall pay more attention to the role of PPAR-γ protein and PTEN protein and their complex interactions in RCC, and provide more comprehensive study with lager sample size in an in vivo environment.
In conclusion, we provide stout evidence that PPAR-γ and PTEN are in close association with the prognosis of RCC and PPAR-γ and PTEN signaling may be a promising therapy for RCC. Future efforts are need to provide more powerful insight on these two proteins.
Acknowledgements
This work was financially supported by the grants from the National 863 High Tech Foundation (2014AA020608).
Disclosure of conflict of interest
None.
References
- 1.Ljungberg B, Bensalah K, Canfield S, Dabestani S, Hofmann F, Hora M, Kuczyk MA, Lam T, Marconi L, Merseburger AS, Mulders P, Powles T, Staehler M, Volpe A, Bex A. EAU guidelines on renal cell carcinoma: 2014 update. Eur Urol. 2015;67:913–924. doi: 10.1016/j.eururo.2015.01.005. [DOI] [PubMed] [Google Scholar]
- 2.Znaor A, Lortet-Tieulent J, Laversanne M, Jemal A, Bray F. International variations and trends in renal cell carcinoma incidence and mortality. Eur Urol. 2015;67:519–530. doi: 10.1016/j.eururo.2014.10.002. [DOI] [PubMed] [Google Scholar]
- 3.Hes O. [International Society of Urological Pathology (ISUP) Vancouver Classification of Renal Neoplasia 2012] . Cesk Patol. 2014;50:137–141. [PubMed] [Google Scholar]
- 4.Motzer RJ, Hutson TE, Tomczak P, Michaelson MD, Bukowski RM, Rixe O, Oudard S, Negrier S, Szczylik C, Kim ST, Chen I, Bycott PW, Baum CM, Figlin RA. Sunitinib versus interferon alfa in metastatic renal-cell carcinoma. N Engl J Med. 2007;356:115–124. doi: 10.1056/NEJMoa065044. [DOI] [PubMed] [Google Scholar]
- 5.Park HK, Kim H, Kim HG, Cho YM, Jung WY, Han HS, Hwang TS, Kwon GY, Lim SD. Expression of Peroxisome Proliferator Activated Receptor gamma in Prostatic Adenocarcinoma. J Korean Med Sci. 2015;30:533–541. doi: 10.3346/jkms.2015.30.5.533. [DOI] [PMC free article] [PubMed] [Google Scholar]
- 6.Teresi RE, Waite KA. PPARgamma, PTEN, and the Fight against Cancer. PPAR Res. 2008;2008:932632. doi: 10.1155/2008/932632. [DOI] [PMC free article] [PubMed] [Google Scholar]
- 7.Mansure JJ, Nassim R, Chevalier S, Szymanski K, Rocha J, Aldousari S, Kassouf W. A novel mechanism of PPAR gamma induction via EGFR signalling constitutes rational for combination therapy in bladder cancer. PLoS One. 2013;8:e55997. doi: 10.1371/journal.pone.0055997. [DOI] [PMC free article] [PubMed] [Google Scholar]
- 8.Yang XY, Wang LH, Farrar WL. A Role for PPARgamma in the Regulation of Cytokines in Immune Cells and Cancer. PPAR Res. 2008;2008:961753. doi: 10.1155/2008/961753. [DOI] [PMC free article] [PubMed] [Google Scholar] [Retracted]
- 9.Jagan I, Fatehullah A, Deevi RK, Bingham V, Campbell FC. Rescue of glandular dysmorphogenesis in PTEN-deficient colorectal cancer epithelium by PPARgamma-targeted therapy. Oncogene. 2013;32:1305–1315. doi: 10.1038/onc.2012.140. [DOI] [PMC free article] [PubMed] [Google Scholar]
- 10.Nikiforov YE, Nikiforova MN. Molecular genetics and diagnosis of thyroid cancer. Nat Rev Endocrinol. 2011;7:569–580. doi: 10.1038/nrendo.2011.142. [DOI] [PubMed] [Google Scholar]
- 11.Ogino S, Shima K, Baba Y, Nosho K, Irahara N, Kure S, Chen L, Toyoda S, Kirkner GJ, Wang YL, Giovannucci EL, Fuchs CS. Colorectal cancer expression of peroxisome proliferator-activated receptor gamma (PPARG, PPARgamma) is associated with good prognosis. Gastroenterology. 2009;136:1242–1250. doi: 10.1053/j.gastro.2008.12.048. [DOI] [PMC free article] [PubMed] [Google Scholar]
- 12.Robbins GT, Nie D. PPAR gamma, bioactive lipids, and cancer progression. Front Biosci (Landmark Ed) 2012;17:1816–1834. doi: 10.2741/4021. [DOI] [PMC free article] [PubMed] [Google Scholar]
- 13.Paintlia AS, Paintlia MK, Singh AK, Orak JK, Singh I. Activation of PPAR-gamma and PTEN cascade participates in lovastatin-mediated accelerated differentiation of oligodendrocyte progenitor cells. Glia. 2010;58:1669–1685. doi: 10.1002/glia.21039. [DOI] [PMC free article] [PubMed] [Google Scholar]
- 14.Lee SJ, Yang EK, Kim SG. Peroxisome proliferator-activated receptor-gamma and retinoic acid X receptor alpha represses the TGFbeta1 gene via PTEN-mediated p70 ribosomal S6 kinase-1 inhibition: role for Zf9 dephosphorylation. Mol Pharmacol. 2006;70:415–425. doi: 10.1124/mol.106.022954. [DOI] [PubMed] [Google Scholar]
- 15.[The Helsinki Declaration of the World Medical Association (WMA). Ethical principles of medical research involving human subjects] Pol Merkur Lekarski. 2014;36:298–301. [PubMed] [Google Scholar]
- 16.Martinez-Salamanca JI, Huang WC, Millan I, Bertini R, Bianco FJ, Carballido JA, Ciancio G, Hernandez C, Herranz F, Haferkamp A, Hohenfellner M, Hu B, Koppie T, Martinez-Ballesteros C, Montorsi F, Palou J, Pontes JE, Russo P, Terrone C, Villavicencio H, Volpe A, Libertino JA. International Renal Cell Carcinoma-Venous Thrombus C Prognostic impact of the 2009 UICC/AJCC TNM staging system for renal cell carcinoma with venous extension. Eur Urol. 2011;59:120–127. doi: 10.1016/j.eururo.2010.10.001. [DOI] [PubMed] [Google Scholar]
- 17.Fuhrman SA, Lasky LC, Limas C. Prognostic significance of morphologic parameters in renal cell carcinoma. Am J Surg Pathol. 1982;6:655–663. doi: 10.1097/00000478-198210000-00007. [DOI] [PubMed] [Google Scholar]
- 18.Nagata D, Yoshihiro H, Nakanishi M, Naruyama H, Okada S, Ando R, Tozawa K, Kohri K. Peroxisome proliferator-activated receptor-gamma and growth inhibition by its ligands in prostate cancer. Cancer Detect Prev. 2008;32:259–266. doi: 10.1016/j.cdp.2008.05.008. [DOI] [PubMed] [Google Scholar]
- 19.Forootan FS, Forootan SS, Malki MI, Chen D, Li G, Lin K, Rudland PS, Foster CS, Ke Y. The expression of C-FABP and PPARgamma and their prognostic significance in prostate cancer. Int J Oncol. 2014;44:265–275. doi: 10.3892/ijo.2013.2166. [DOI] [PubMed] [Google Scholar]
- 20.Fuentes E, Guzman-Jofre L, Moore-Carrasco R, Palomo I. Role of PPARs in inflammatory processes associated with metabolic syndrome (Review) Mol Med Rep. 2013;8:1611–1616. doi: 10.3892/mmr.2013.1714. [DOI] [PubMed] [Google Scholar]
- 21.Lee C, Ramirez JA, Guitart J, Diaz LK. Expression of cyclooxygenase-2 and peroxisome proliferator-activated receptor gamma during malignant melanoma progression. J Cutan Pathol. 2008;35:989–994. doi: 10.1111/j.1600-0560.2007.00939.x. [DOI] [PubMed] [Google Scholar]
- 22.Meyer S, Vogt T, Landthaler M, Berand A, Reichle A, Bataille F, Marx AH, Menz A, Hartmann A, Kunz-Schughart LA, Wild PJ. Cyclooxygenase 2 (COX2) and Peroxisome Proliferator-Activated Receptor Gamma (PPARG) Are Stage-Dependent Prognostic Markers of Malignant Melanoma. PPAR Res. 2009;2009:848645. doi: 10.1155/2010/848645. [DOI] [PMC free article] [PubMed] [Google Scholar]
- 23.Ostlund L, Einhorn S, Robert KH. Induction of 2’,5’-oligoadenylate synthetase and blast transformation in primary chronic lymphocytic leukemia cells following exposure to interferon in vitro. Cancer Res. 1986;46:2160–2163. [PubMed] [Google Scholar]
- 24.Li MY, Yuan H, Ma LT, Kong AW, Hsin MK, Yip JH, Underwood MJ, Chen GG. Roles of peroxisome proliferator-activated receptor-alpha and -gamma in the development of non-small cell lung cancer. Am J Respir Cell Mol Biol. 2010;43:674–683. doi: 10.1165/rcmb.2009-0349OC. [DOI] [PubMed] [Google Scholar]
- 25.Apostoli AJ, Roche JM, Schneider MM, SenGupta SK, Di Lena MA, Rubino RE, Peterson NT, Nicol CJ. Opposing roles for mammary epithelial-specific PPARgamma signaling and activation during breast tumour progression. Mol Cancer. 2015;14:85. doi: 10.1186/s12943-015-0347-8. [DOI] [PMC free article] [PubMed] [Google Scholar]
- 26.Yamazaki K, Shimizu M, Okuno M, Matsushima-Nishiwaki R, Kanemura N, Araki H, Tsurumi H, Kojima S, Weinstein IB, Moriwaki H. Synergistic effects of RXR alpha and PPAR gamma ligands to inhibit growth in human colon cancer cells--phosphorylated RXR alpha is a critical target for colon cancer management. Gut. 2007;56:1557–1563. doi: 10.1136/gut.2007.129858. [DOI] [PMC free article] [PubMed] [Google Scholar]
- 27.Song MS, Salmena L, Pandolfi PP. The functions and regulation of the PTEN tumour suppressor. Nat Rev Mol Cell Biol. 2012;13:283–296. doi: 10.1038/nrm3330. [DOI] [PubMed] [Google Scholar]
- 28.Yu X, Xu Z, Lei J, Li T, Wang Y. VP22 mediates intercellular trafficking and enhances the in vitro antitumor activity of PTEN. Mol Med Rep. 2015;12:1286–1290. doi: 10.3892/mmr.2015.3509. [DOI] [PubMed] [Google Scholar]
- 29.Sun Z, Ji N, Bi M, Zhang Z, Liu X, Wang Z. Negative expression of PTEN identifies high risk for lymphatic-related metastasis in human esophageal squamous cell carcinoma. Oncol Rep. 2015;33:3024–3032. doi: 10.3892/or.2015.3928. [DOI] [PubMed] [Google Scholar]
- 30.Teresi RE, Shaiu CW, Chen CS, Chatterjee VK, Waite KA, Eng C. Increased PTEN expression due to transcriptional activation of PPARgamma by Lovastatin and Rosiglitazone. Int J Cancer. 2006;118:2390–2398. doi: 10.1002/ijc.21799. [DOI] [PubMed] [Google Scholar]
- 31.Zhang W, Wu N, Li Z, Wang L, Jin J, Zha XL. PPARgamma activator rosiglitazone inhibits cell migration via upregulation of PTEN in human hepatocarcinoma cell line BEL-7404. Cancer Biol Ther. 2006;5:1008–1014. doi: 10.4161/cbt.5.8.2887. [DOI] [PubMed] [Google Scholar]
- 32.Bonofiglio D, Gabriele S, Aquila S, Catalano S, Gentile M, Middea E, Giordano F, Ando S. Estrogen receptor alpha binds to peroxisome proliferator-activated receptor response element and negatively interferes with peroxisome proliferator-activated receptor gamma signaling in breast cancer cells. Clin Cancer Res. 2005;11:6139–6147. doi: 10.1158/1078-0432.CCR-04-2453. [DOI] [PubMed] [Google Scholar]