

Abstract
Bladder carcinoma is a common malignancy with complicated treatment methods due to its heterogeneity. In this study, we focused on two bladder carcinoma cell lines, 5637 and T24, to compare their differences from the transcriptome level. RNA sequencing was used to generate the transcriptome data of the two cell line and the control cell line SV-HUC-1. Differentially expressed genes (DEGs) and differentially expressed microRNAs (miRNAs) of cell line 5637 and T24 were screened. Their annotation and analyses were conducted using gene ontology (GO) and Kyoto encyclopedia of genes and genomes (KEGG) to predict their possible functions and pathways involved. Number of DEGs specific in cell line 5637, specific in cell line T24 and in both the cell lines was 880, 1512 and 1412, respectively. Number of differentially expressed miRNAs of the three categories was 7, 20 and 18, respectively. These DEGs and miRNAs participated in different biological processes and pathways, among which some were further verified by qRT-PCR. Interferon-stimulated genes (ISGs), including STAT1, TMEM173 and OAS3, were down-regulated in cell line 5637 compared to SV-HUC-1. NDOR1 and NDUFV1, genes related to mitochondrial metabolism, were up-regulated in cell line T24. miR-4257, miR-6733 and gene WNT9A and WNT10A were down-regulated in both the cell lines. Thus cell line 5637 might have lower chemotherapy resistance while T24 might exhibit abnormal mitochondrial metabolism. These results uncovered major differences between cell line 5637 and T24, which indicated the two cell lines, should be selectively used in bladder carcinoma research.
Keywords: Bladder carcinoma, differentially expressed genes (DEGs), microRNAs (miRNAs), chemotherapy resistance, mitochondrial metabolism
Introduction
Bladder carcinoma is one of the most common malignancies with an increasing incidence in the world [1]. The majority of the bladder carcinoma patients are non-muscle-invasive cancer [2]. Though surgical cystectomies with adjuvant chemotherapy are efficient to primary bladder carcinoma [3], recurrence has occurred in about 70% of patients and 10-40% of the cases have developed to metastatic diseases ultimately [4]. Moreover, a large proportion of advances bladder carcinoma patients are resistant to chemotherapy [5], characterized by some gene signatures, such as interferon-stimulated genes (ISGs) [6,7]. Heterogeneity is a characteristic of bladder carcinoma, which means metastasis, treatment response, relapse and clinical outcomes may vary remarkably among different individuals [8-10]. So a better understanding of biological properties and the molecular mechanisms of individual cancer cells is necessary and urgent.
DNA and RNA microarrays and sequencing have been widely used to identify mutations in bladder carcinoma genomic regions and differentially expressed genes [11,12]. Particularly, RNA sequencing has provided a reliable, quantitative and sensitive method for studying transcriptome and microRNAs (miRNAs) [13]. The development of sequencing methods has facilitated studies on genome and transcriptome landscapes and genetic aberrations of chromatin remodeling genes in bladder carcinoma [10,14].
Both the non-muscle-invasive bladder carcinoma cell line 5637 and the muscle-invasive bladder carcinoma cell line T24 have been used in numerous studies. A previous genomic study has compared these cell lines from their gene gains and losses, and pathways and biological functions of the altered genes [11]. But the transcriptome profiles of these cell lines are still unclear. Out study aimed at comparing cell line 5637 and T24 based on their transcriptome information. Their transcriptomes were sequenced using Illumina high-throughput sequencing and the data were analyzed with bioinformatics methods, using a normal bladder cell line SV-HUC-1 as the control. We focused on the differentially expressed genes (DEGs) and differentially expressed miRNAs in these cell lines and predicted their functions and pathways involved. Some DEGs and miRNAs that might participate in cancer-related functions and pathways were further analyzed by real-time quantitative RT-PCR (qRT-PCR). Our results might guide the differential treatments of bladder carcinoma subtypes.
Materials and methods
Cell lines
The human bladder carcinoma cell lines 5637 and T24, and the human uroepithelial cell line SV-HUC-1 were purchased from American Type Culture Collection (Manassas, VA, USA). The cells were cultured in Dulbecco’s Modified Eagle’s Medium (DMEM, Sigma-Aldrich, Shanghai, China) medium containing 10% fetal bovine serum (FBS, HyClone, Logan, Utah, USA) in humidified atmosphere with 5% CO2 at 37°C.
RNA extraction and sequencing
Total RNAs from each cell sample were extracted by Trizol (Invitrogen, Carlsbad, CA, USA) according to the manuals. DNA contamination was removed by DNase I (Invitrogen) and examined by agarose gel electrophoresis (AGE). The quality and quantity of RNA samples were detected by AGE and NanoDrop 2000 (Thermo Scientific, Wilmington, DE, USA). mRNAs were enriched by oligo(dT) and then digested by RNase III (Invitrogen) into fragments of about 200 nt. The library was constructed using TruSeq Stranded mRNA HT Sample Prep Kit (Illumina, San Diego, CA, USA). As to the miRNA sequencing, miRNAs were isolated and adapters were added. Library was constructed using TruSeq Small RNA Library Preparation Kits (Illumina). Sequencing was performed by HiseqTM 2000 Sequencing System (Illumina).
Data analysis
Clean reads were generated by removing the low-quality reads and adapters. Assembly was conducted using Trinity [15]. The sequencing quality was analyzed by RSeQC [16] and the quality was acceptable if Q20 was more than 95%. Annotation was performed using DAVID Bioinformatics Resources 6.7 [17,18] to describe the gene ontology (GO) [19] and Kyoto encyclopedia of genes and genomes (KEGG) pathway [20]. miRNAs were blast to miRBase 21 (http://www.mirbase.org/). DEGs and miRNAs were selected according to the threshold within which the absolute value of log2fold-change (log2FC) is more than 1.00 [21]. False discovery rate (FDR) control method was used to correct the P values [22] and terms with FDR < 0.05 were considered significant. Then reads per kilobase per million mapped reads (RPKM) was used to indicate the gene expression levels [23]. The pathways were analyzed by Fisher’s exact test and χ2 test. FDR < 0.05 was set as the threshold of significance.
qRT-PCR and statistical analysis
The complementary DNAs (cDNAs) of each sample for qRT-PCR analysis were synthesized from 1 μg RNAs using PrimeScript RT-PCR Kit (TaKaRa, Dalian, China). qRT-PCR was conducted on LightCycler 480 (Roche Applied Science, Shanghai, China) with cDNAs of 50 ng (Table 1) and specific primers in the reaction system. All the experiments were performed in triplicate. The relative expression level of genes and miRNAs was normalized by β-actin and U6 small nuclear RNA (snRNA), respectively. Data was calculated by 2-ΔΔCt method and analyzed by Student’s t-test. Differences were considered significant if P < 0.05. Statistical analyses were performed with the Statistical Package for Social Sciences (SPSS) 20 software (IBM, New York, USA).
Table 1.
Primers used in qRT-PCR
| Primers | Sequences (5’ to 3’) |
|---|---|
| β-actin-forward | TCACCCTCTCTGTGCCCATCTACGA |
| β-actin-reverse | CAGCGGAACCGCTCATTGCCAATGG |
| STAT1-forward | CAGCTTGACTCAAAATTCCTGGA |
| STAT1-reverse | TGAAGATTACGCTTGCTTTTCCT |
| TMEM173-forward | CCAGAGCACACTCTCCGGTA |
| TMEM173-reverse | CGCATTTGGGAGGGAGTAGTA |
| OAS3-forward | GAAGGAGTTCGTAGAGAAGGCG |
| OAS3-reverse | CCCTTGACAGTTTTCAGCACC |
| U6 snRNA-forward | CTCGCTTCGGCAGCACA |
| U6 snRNA-reverse | AACGCTTCACGAATTTGCGT |
| Uni-PCR | AGTGCGAACTGTGGCGAT |
| RT-Stem | GTCGTATCCAGTGCGAACTGTGGCGATCGGTACGGG CTACACTCGGCAATTGCACTGGATACGAC |
| miR-6733-5p-PCR | GGTGGGAAAGACAAACTCAG |
| miR-6733-5p-RT | GTCGTATCCAGTGCGAACTGTGGCGATCGGTACGGGCTACACTCGGCAATTGCACTGGATACGACAACT |
| miR-4257-PCR | GGCCAGAGGTGGGGACT |
| miR-4257-RT | GTCGTATCCAGTGCGAACTGTGGCGATCGGTACGGGCTACACTCGGCAATTGCACTGGATACGAC |
| NDOR1-forward | CTCCTACCCGGTGGTGAATCT |
| NDOR1-reverse | GCAAAGTCCATCTGACAGAGG |
| NDUFV1-forward | AGGATGAAGACCGGATTTTCAC |
| NDUFV1-reverse | CAGTCACCTCGACTCAGGGA |
| WNT9A-forward | GACTGCCTTCCTCTATGCC |
| WNT9A-reverse | AGGTCGGGTGCCTCATC |
| WNT10A-forward | GGCAACCCGTCAGTCT |
| WNT10A-reverse | CATTCCCCACCTCCCATCT |
Results
DEGs and miRNAs in cell line 5637 and T24
The qualities of the three sequenced transcriptomes were all acceptable and a total of 12 Gb raw data were obtained, suggesting the RNA-sequencing data were qualified for further analyses. When searching for the DEGs of cell line 5637 and T24 compared to the control cell line SV-HUC-1, we categorized DEGs into three groups: DEGs specific to cell line 5637, DEGs specific to cell line T24 and DEGs found in both the cell lines (including the up-regulated and the down-regulated genes). Results showed that the DEG numbers of the three categories were 880, 1512 and 1412, respectively (Figure 1A and Tables S1, S2, S3). Among the 1412 genes, 1360 showed no differential expression between cell line 5637 and T24, including WNT9A and WNT10A, which were both down-regulated in the two cell lines. While 44 were up-regulated and 17 down-regulated in cell line 5637 compared to T24 (Table S3). As to the differentially expressed miRNAs, seven of them were found only in cell line 5637, 20 in cell line T24 and 18 in both the cell lines (Figure 1B and Table S4). Especially, miRNA-4257 and miRNA-6733 were significantly down-regulated in both 5637 and T24 cell lines, implying their potential roles involved in tumorgenesis and progression.
Figure 1.
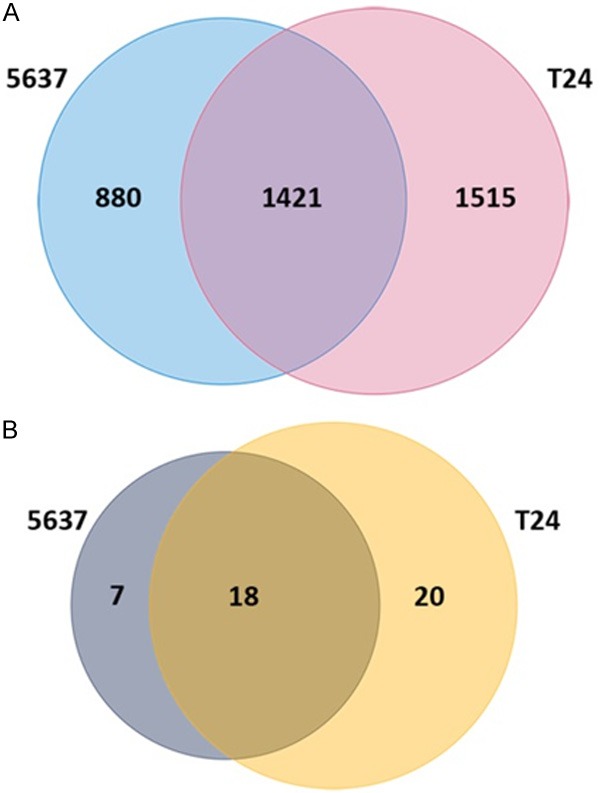
Venn diagrams of DEGs and differentially expressed miRNAs in cell line 5637 and T24. A. Venn diagram of DEGs in cell line 5637 and T24. The blue circle indicates DEGs sequenced in cell line 5637 and the pink one indicates DEGs sequences in cell line T24. The overlapped region of the two circles indicates DEGs shared by the two cell lines. B. Venn diagram of differentially expressed miRNAs in cell line T24. The purple circle indicates miRNAs sequenced in cell line 5637 and the yellow one indicates miRNAs sequenced in cell line T24. The overlapped region of the two circles indicates the differentially expressed miRNAs shared by the two cell lines.
GO analysis and pathway prediction
GO analysis results showed the annotation of genes from three ontologies, that is, biological process (BP), molecular function (MF) and cellular component (CC). DEGs of cell line 5637 were enriched in BP terms like mitotic cell cycle, cell division, and apoptotic process (Figure 2A). In MF terms, they were enriched in protein binding and in CC terms, and in CC terms, they focused on cytosol components. Some of the DEGs shared by the two cell lines fell in the mitotic cell cycle, gene expression, cellular metabolic process and so on (Figure 3B). As to the DEGs in cell line T24, they were predicted mainly in endoplasmic reticulum unfolded protein response, cellular protein metabolic process and regulation of cell proliferation (Figure 2C). A certain number of them were predicted to be perinuclear region components of cytoplasm, differing from DEGs in cell line 5637. These data indicated the DEGs of the three categories exhibited differentiable GO features, implying on one aspect the disparities between cell line 5637 and T24.
Figure 2.

GO analysis of DEGs. A. BP, MF and CC ontologies of DEGs specific to cell line 5637. B. BP, MF and CC ontologies of DEGs shared by cell line 5637 and T24. C. BP, MF and CC ontologies of DEGs specific to cell line T24. In each ontology, the first 15 enriched terms were listed. BP: biological process. MF: molecular function. CC: cellular component.
Figure 3.

KEGG analysis of DEGs. A. Pathway prediction of DEGs specific to cell line 5637. B. Pathway prediction of DEGs shared by cell line 5637 and T24. C. Pathway prediction of DEGs specific to cell line T24. In each category, the first 15 enriched terms were listed.
KEGG pathway analysis results illustrated the disparities of the three DEG categories from another perspective (Figure 3). The first two terms enriched in cell line 5637-specific DEGs were pathogenic Escherichia coli infection and cell cycle (Figure 3A) and the first two terms in cell line T24-specific DEGs were Salmonella infection and shigellosis (Figure 3C). While those in the DEGs of both cell lines were Parkinson’s disease and oxidative phosphorylation (Figure 3B). Especially, genes pathways related to cancers were predicted in DEGs of cell line 5637 and T24, such as bladder cancer and small cell lung cancer. As was expected, wingless-type MMTV integration site (WNT) family members WNT9A and WNT10A were predicted in the Wnt signaling pathway. Specific factors in these pathways might indicate the possible relationship between these cell lines and some diseases. Interestingly, we found three ISGs, transmembrane protein 173 (TMEM173), signal transducer and activator of transcription 1 (STAT1) and 2’-5’-oligoadenylate synthetase 3 (OAS3) in DEGs of cell line 5637, which might imply their specific roles in cell line 5637.
qRT-PCR verification
To verify the sequencing results, qRT-PCR was used to detect the expression levels of three gene categories and two miRNAs.TMEM173, STAT1 and OAS3 were cell line 5637-specific DEGs and results showed they were all down-regulated in cell line 5637 compared toSV-HUC-1, with significant differences (P < 0.05, Figure 4A). NADPH-dependent diflavin oxidoreductase 1 (NDOR1)and NADH dehydrogenase (ubiquinone) flavoprotein 1 (NDUFV1), belonging to NADH metabolism, were both cell line T24-specific DEGs and were both significantly up-regulated in cell line T24 compared toSV-HUC-1 (P < 0.05, Figure 4B). miR-4257, miR-6733, WNT9A and WNT10A were all differentially expressed in cell line 5637 and T24 and were significantly down-regulated in the two cell lines compared to SV-HUC-1 (P < 0.05, Figure 4C, 4D). These results were in accordance with the sequencing results and gave more detailed expression profiles of these genes and miRNAs.
Figure 4.

qRT-PCR verification of several genes and miRNAs in cell line SV-HUC-1, 5637 and T24. A. Relative expression levels of STAT1, TMEM173 and OAS3 in cell line 5637 compared to SV-HUC-1. B. Relative expression levels of NDOR1 and NDUFV1 in cell line T24 compared to SV-HUC-1. C. Relative expression levels of miR-6733 and miR-4257 in the three cell lines. D. Relative expression levels of WNT9A and WNT10A in the three cell lines. * indicates significant differences between groups (P < 0.05) and ** indicates extremely significant differences between groups (P < 0.01). snRNA: small nuclear RNA. miR: microRNA. STAT1: signal transducer and activator of transcription 1. TMEM173: transmembrane protein 173. OAS3: 2’-5’-oligoadenylate synthetase 3. NDOR1: NADPH-dependent diflavin oxidoreductase 1. NDUFV1: NADH dehydrogenase (ubiquinone) flavoprotein 1. WNT: wingless-type MMTV integration site.
Discussion
In this study, the transcriptomes of bladder carcinoma cell line 5637 and T24 are sequenced by Illumina high-throughput sequencing, and compared to the normal bladder cell line SV-HUC-1. DEGs and miRNAs specific to cell line 5637 or T24 and those shared by the two cell lines are analyzed. GO and KEGG analysis results show the possible functions and pathways involving these DEGs and miRNAs, including cell cycle, cellular protein metabolic process, the pathogenic infection pathway and cancer-related pathways. The differential expression of several DEGs and miRNAs are further verified by qRT-PCR. Three ISGs, such as TMEM173, STAT1 and OAS3 are down-regulated in cell line 5637. While the NADH metabolism-related factors, NDOR1 and NDUFV1 were up-regulated in cell line T24. Our data reflect the differences between cell line 5637 and T24, and offer basic transcriptome information of the two cell lines for selectively usage in future bladder carcinoma research.
ISGs, classified to be antiviral response gene, are considered to be DNA damage resistance signature (IRDS). IRDS are associated with radio- and chemotherapy resistance of cancers, and STAT1 is one of the IRDS genes identified [24]. TMEM137 (alias stimulator of interferon genes protein, STING) [25] and OAS3 [26] referred to in this study are also important ISGs. As DEGs results showed, STAT1, TMEM137 and OAS3 were all down-regulated in cell line 5637 compared to the normal cell line SV-HUC-1, which was further verified by qRT-PCR results. While in cell line T24, the three genes were not DEGs. It could be deduced that cell line 5637 might exhibit lower resistance to chemotherapy, which implied 5637-like bladder carcinoma patients might be more sensitive to chemotherapy than T24-like patients. Another group of genes, NDOR1 and NDUFV1, were both up-regulated in cell line T24 compared to cell line SV-HUC-1. Since the two genes are both NAD(P)H-related genes, whose deletions or mutations may cause mitochondrial deficiency [27-29], their up-regulations in cell line T24 might infer the abnormal mitochondrial metabolism. Some DEGs were up-regulated or down-regulated in both cell line 5637 and T24, among which WNT9A and WNT10A were verified. Wnt signaling molecules are related to the process of mitogenic, cell development and differentiation [30]. Abnormal expression of WNT9A and WNT10A may lead to pathological conditions, such as congenital diseases and cancer [31], and down-regulation of WNT9A has been proved to promote the cell proliferation of breast cancer cells MA891 [32]. The expression profiles of WNT9A and WNT10A indicated the Wnt signaling pathways in cell line 5637 and T24 both possessed abnormal status, inferring the aberrant cell cycle progress in bladder carcinoma cells.
miRNAs are important in regulating RNA silencing and post-transcriptional regulation of gene expression [33]. Over one third of metazoan transcriptomes are directly regulated by miRNAs [34]. Though no detailed studies have discussed the specific roles of miR-4257 or miR-6733, researchers have shown miR-4257 may bind to genes involving in mitochondrial apoptosis pathway [35]. So based on the data in this study, we could speculate that the differentially expressed miRNAs might regulate the expression of DEGs in cell line 5637 and T24, especially the DEGs in mitochondrial metabolism, thus causing aberrant patterns of bladder carcinoma.
As discussed above, cell line 5637 and T24 could be differentiated from normal bladder cell line SV-HUC-1 based on DEGs and differentially expressed miRNAs. Disparities were also found between cell line 5637 and T24, both being used as bladder carcinoma cells in many studies. The former might be characterized by its lower resistance to chemotherapy, and the latter could be distinguished by its abnormal mitochondrial metabolism. So the two cell lines should be selectively used in bladder carcinoma research. For example, cell line 5637 may be unsuitable for comparative tests on chemotherapy sensitivity, and cell line T24 is an inadequate experimental material for studying the relationship between mitochondrial metabolism and carcinogenesis. Still, further information is necessary for more accurate comparisons of the two cell lines.
To sum up, this study has compared the transcriptomes of two bladder carcinoma cell lines, 5637 and T24, based on data generated from RNA-sequencing. Analyses on DEGs and differentially expressed miRNAs have revealed important features of the two cell lines, including chemotherapy sensitivity and mitochondrial metabolisms. In order to better distinguish and utilize the two cell lines in bladder carcinoma research, further studies are needed to verify the functional mechanisms of these DEGs and miRNAs.
Acknowledgements
This research was supported by the Science and Technology Development Fund of Macao (Grant No. 064/2012/A).
Disclosure of conflict of interest
None.
Supporting Information
References
- 1.Siegel R, Ma J, Zou Z, Jemal A. Cancer statistics, 2014. CA Cancer J Clin. 2014;64:9–29. doi: 10.3322/caac.21208. [DOI] [PubMed] [Google Scholar]
- 2.Montironi R, Lopez-Beltran A. The 2004 WHO classification of bladder tumors: a summary and commentary. Int J Surg Pathol. 2005;13:143–153. doi: 10.1177/106689690501300203. [DOI] [PubMed] [Google Scholar]
- 3.Hollenbeck BK, Dunn RL, Ye Z, Hollingsworth JM, Skolarus TA, Kim SP, Montie JE, Lee CT, Wood DP Jr, Miller DC. Delays in diagnosis and bladder cancer mortality. Cancer. 2010;116:5235–5242. doi: 10.1002/cncr.25310. [DOI] [PubMed] [Google Scholar]
- 4.Nishiyama H, Habuchi T, Watanabe J, Teramukai S, Tada H, Ono Y, Ohshima S, Fujimoto K, Hirao Y, Fukushima M, Ogawa O. Clinical Outcome of a Large-Scale Multi-Institutional Retrospective Study for Locally Advanced Bladder Cancer: A Survey Including 1131 Patients Treated during 1990-2000 in Japan. Eur Urol. 2004;45:176–181. doi: 10.1016/j.eururo.2003.09.011. [DOI] [PubMed] [Google Scholar]
- 5.Porter MP, Kerrigan MC, Donato BM, Ramsey SD. Patterns of use of systemic chemotherapy for Medicare beneficiaries with urothelial bladder cancer. Urol Oncol. 2011;29:252–258. doi: 10.1016/j.urolonc.2009.03.021. [DOI] [PubMed] [Google Scholar]
- 6.Xiaoting L, Apei J, Qing F. Ubiquitin-like protein ISG15 and its modification system in tumor. Chenistry of Life. 2011;31:630–635. [Google Scholar]
- 7.Ina S, Hirono S, Noda T, Yamaue H. Identifying molecular markers for chemosensitivity to gemcitabine in pancreatic cancer: increased expression of interferon-stimulated gene 15 kd is associated with intrinsic chemoresistance. Pancreas. 2010;39:473–485. doi: 10.1097/MPA.0b013e3181c0decc. [DOI] [PubMed] [Google Scholar]
- 8.Bentivegna A, Conconi D, Panzeri E, Sala E, Bovo G, Viganò P, Brunelli S, Bossi M, Tredici G, Strada G, Dalprà L. Biological heterogeneity of putative bladder cancer stem-like cell populations from human bladder transitional cell carcinoma samples. Cancer Sci. 2010;101:416–424. doi: 10.1111/j.1349-7006.2009.01414.x. [DOI] [PMC free article] [PubMed] [Google Scholar]
- 9.Cha EK, Sfakianos JP, Al-Ahmadie H, Scott SN, Kim PH, Iyer G, Bajorin DF, Rosenberg JE, Berger MF, Bochner BH, Solit DB. Branched evolution and intratumor heterogeneity of urothelial carcinoma of the bladder. J. Clin. Oncol. 2014;32:293. [Google Scholar]
- 10.Morrisona CD, Liu P, Woloszynska-Read A, Zhang J, Luo W, Qin M, Bshara W, Conroy JM. Whole-genome sequencing identifies genomic heterogeneity at a nucleotide and chromosomal level in bladder cancer. PNAS. 2014;111:E672–E681. doi: 10.1073/pnas.1313580111. [DOI] [PMC free article] [PubMed] [Google Scholar]
- 11.Pinto-Leite R, Carreira I, Melo J, Ferreira SI, Ribeiro I, Ferreira J, Filipe M, Bernardo C, Arantes-Rodrigues R, Oliveira P, Santos L. Genomic characterization of three urinary bladder cancer cell lines: understanding genomic types of urinary bladder cancer. Tumour Biol. 2014;35:4599–4617. doi: 10.1007/s13277-013-1604-3. [DOI] [PubMed] [Google Scholar]
- 12.Descotes F, Dessen P, Bringuier PP, Decaussin M, Martin PM, Adams M, Villers A, Lechevallier E, Rebillard X, Rodriguez-Lafrasse C, Devonec M, Paparel P, Perrin P, Lazar V, Ruffion A. Microarray gene expression profiling and analysis of bladder cancer supports the sub-classification of T1 tumours into T1a and T1b stages. BJU Int. 2014;113:333–342. doi: 10.1111/bju.12364. [DOI] [PubMed] [Google Scholar]
- 13.Ozsolak F, Milos PM. RNA sequencing: Advances, challenges and opportunities. Nat Rev Genet. 2011;12:87–98. doi: 10.1038/nrg2934. [DOI] [PMC free article] [PubMed] [Google Scholar]
- 14.Gui Y, Guo G, Huang Y, Hu X, Tang A, Gao S, Wu R, Chen C, Li X, Zhou L, He M, Li Z, Sun X, Jia W, Chen J, Yang S, Zhou F, Zhao X, Wan S, Ye R, Liang C, Liu Z, Huang P, Liu C, Jiang H, Wang Y, Zheng H, Sun L, Liu X, Jiang Z, Feng D, Chen J, Wu S, Zou J, Zhang Z, Yang R, Zhao J, Xu C, Yin W, Guan Z, Ye J, Zhang H, Li J, Kristiansen K, Nickerson ML, Theodorescu D, Li Y, Zhang X, Li S, Wang J, Yang H, Wang J, Cai Z. Frequent mutations of chromatin remodeling genes in transitional cell carcinoma of the bladder. Nat Genet. 2011;43:875–878. doi: 10.1038/ng.907. [DOI] [PMC free article] [PubMed] [Google Scholar]
- 15.Grabherr MG, Haas BJ, Yassour M, Levin JZ, Thompson DA, Amit I, Adiconis X, Fan L, Raychowdhury R, Zeng Q, Chen Z, Mauceli E, Hacohen N, Gnirke A, Rhind N, di Palma F, Birren BW, Nusbaum C, Lindblad-Toh K, Friedman N, Regev A. Full-length transcriptome assembly from RNA-Seq data without a reference genome. Nat Biotechnol. 2011;29:644–652. doi: 10.1038/nbt.1883. [DOI] [PMC free article] [PubMed] [Google Scholar]
- 16.Wang L, Wang S, Li W. RSeQC: Quality control of RNA-seq experiments. Bioinformatics. 2012;28:2184–2185. doi: 10.1093/bioinformatics/bts356. [DOI] [PubMed] [Google Scholar]
- 17.Huang DW, Sherman BT, Lempicki RA. Systematic and integrative analysis of large gene lists using DAVID bioinformatics resources. Nat Protoc. 2008;4:44–57. doi: 10.1038/nprot.2008.211. [DOI] [PubMed] [Google Scholar]
- 18.Huang da W, Sherman BT, Lempicki RA. Bioinformatics enrichment tools: Paths toward the comprehensive functional analysis of large gene lists. Nucleic Acids Res. 2009;37:1–13. doi: 10.1093/nar/gkn923. [DOI] [PMC free article] [PubMed] [Google Scholar]
- 19.Ashburner M, Ball CA, Blake JA, Botstein D, Butler H, Cherry JM, Davis AP, Dolinski K, Dwight SS, Eppig JT, Harris MA, Hill DP, Issel-Tarver L, Kasarskis A, Lewis S, Matese JC, Richardson JE, Ringwald M, Rubin GM, Sherlock G. Gene ontology: Tool for the unification of biology. The Gene Ontology Consortium. Nat Genet. 2000;25:25–29. doi: 10.1038/75556. [DOI] [PMC free article] [PubMed] [Google Scholar]
- 20.Kanehisa M, Goto S. KEGG: Kyoto Encyclopedia of Genes and Genomes. Nucleic Acids Res. 2000;28:27–30. doi: 10.1093/nar/28.1.27. [DOI] [PMC free article] [PubMed] [Google Scholar]
- 21.Wu J, Zhang Y, Zhang H, Huang H, Folta KM, Lu J. Whole genome wide expression profiles of Vitis amurensis grape responding to downy mildew by using Solexa sequencing technology. BMC Plant Biol. 2010;10:234. doi: 10.1186/1471-2229-10-234. [DOI] [PMC free article] [PubMed] [Google Scholar]
- 22.Reiner A, Yekutieli D, Benjamini Y. Identifying differentially expressed genes using false discovery rate controlling procedures. Bioinformatics. 2003;19:368–375. doi: 10.1093/bioinformatics/btf877. [DOI] [PubMed] [Google Scholar]
- 23.Mortazavi A, Williams BA, McCue K, Schaeffer L, Wold B. Mapping and quantifying mammalian transcriptomes by RNA-Seq. Nat Methods. 2008;5:621–628. doi: 10.1038/nmeth.1226. [DOI] [PubMed] [Google Scholar]
- 24.Weichselbaum RR, Ishwaran H, Yoon T, Nuyten DS, Baker SW, Khodarev N, Su AW, Shaikh AY, Roach P, Kreike B, Roizman B, Bergh J, Pawitan Y, van de Vijver MJ, Minn AJ. An interferon-related gene signature for DNA damage resistance is a predictive marker for chemotherapy and radiation for breast cancer. Proc Natl Acad Sci U S A. 2008;105:18490–18495. doi: 10.1073/pnas.0809242105. [DOI] [PMC free article] [PubMed] [Google Scholar]
- 25.Burdette DL, Monroe KM, Sotelo-Troha K, Iwig JS, Eckert B, Hyodo M, Hayakawa Y, Vance RE. STING is a direct innate immune sensor of cyclic di-GMP. Nature. 2011;478:515–518. doi: 10.1038/nature10429. [DOI] [PMC free article] [PubMed] [Google Scholar]
- 26.Hovanessian AG, Justesen J. The human 2’-5’oligoadenylate synthetase family: unique interferon-inducible enzymes catalyzing 2’-5’ instead of 3’-5’ phosphodiester bond formation. Biochimie. 2007;89:779–788. doi: 10.1016/j.biochi.2007.02.003. [DOI] [PubMed] [Google Scholar]
- 27.Finn RD, Wilkie M, Smith G, Paine MJ. Identification of a functionally impaired allele of human novel oxidoreductase 1 (NDOR1), NDOR1*1. Pharmacogenet Genomics. 2005;15:381–386. doi: 10.1097/01213011-200506000-00002. [DOI] [PubMed] [Google Scholar]
- 28.Benit P, Chretien D, Kadhom N, de Lonlay-Debeney P, Cormier-Daire V, Cabral A, Peudenier S, Rustin P, Munnich A, Rotig A. Large-scale deletion and point mutations of the nuclear NDUFV1 and NDUFS1 genes in mitochondrial complex I deficiency. Am J Hum Genet. 2001;68:1344–1352. doi: 10.1086/320603. [DOI] [PMC free article] [PubMed] [Google Scholar]
- 29.Chen G, Wang F, Trachootham D, Huang P. Preferential killing of cancer cells with mitochondrial dysfunction by natural compounds. Mitochondrion. 2010;10:614–625. doi: 10.1016/j.mito.2010.08.001. [DOI] [PMC free article] [PubMed] [Google Scholar]
- 30.Katoh M. Regulation of WNT signaling molecules by retinoic acid during neuronal differentiation in NT2 cells: Threshold model of WNT action (Review) Int J Mol Med. 2002;10:683–687. [PubMed] [Google Scholar]
- 31.Katoh M. Networking of WNT, FGF, Notch, BMP, and Hedgehog Signaling Pathways during Carcinogenesis. Stem Cell Rev. 2007;3:30–38. doi: 10.1007/s12015-007-0006-6. [DOI] [PubMed] [Google Scholar]
- 32.Zheng X, Zhong X, Meng W, Mi C, Liu S, Li Y, Yu S, Zhao J, Zhang L, Li D, Nie D, Xiang Y. The Role of Mouse Wnt9a in MA891 Breast Cancer Cell Proliferation. Journal of Life Sciences. 2011;5:584–589. [Google Scholar]
- 33.Ambros V. The functions of animal microRNAs. Nature. 2004;431:350–355. doi: 10.1038/nature02871. [DOI] [PubMed] [Google Scholar]
- 34.Engels BM, Hutvagner G. Principles and effects of microRNA-mediated post-transcriptional gene regulation. Oncogene. 2006;25:6163–6169. doi: 10.1038/sj.onc.1209909. [DOI] [PubMed] [Google Scholar]
- 35.Berillo OA, Ivashchenko AT. MicroRNAs bind with mRNAs of genes involving in mitochondrial apoptosis pathway [Google Scholar]
Associated Data
This section collects any data citations, data availability statements, or supplementary materials included in this article.