Abstract
Objective: To analyze morphological features of omental milky spots (MS). Method: Hematoxylin-eosin staining and immunohistochemistry technique were used to study the omental MS of gastric cancer (GC) patients and rectal cancer (RC) patients. We focused on morphological features of MS and conducted quantitative analysis on the cells number and cellular constituents. Differences in MS parameters between GC and RC were also analyzed. Results: Various shapes of MS were mainly round, oval, irregular form in the adipose and perivascular annular. The median MS perimeter was 2752 (range 817~7753) computer-based pixels. The median value of immune cells in one MS was 141 (43~650), comprising T lymphocytes (46.1%), B lymphocytes (28.4%), macrophages (12.4%) and other immune cells (13.1%). Relatively high density of vessels in MS could be calculated by micro-vessel density (MVD) as 4 (0~13). The median value of mesothelial cells loosely arranged in the surface layer was 5 (0~51). There were no significant differences in MS perimeter, MVD, the number of mesothelial cells, total immune cells, T lymphocytes and macrophages between GC and RC (P>0.05), while the number of MS B lymphocytes in RC was significantly higher than that in GC (P<0.001). Conclusion: MS are primary immune tissues in the omentum and structural bases for development and progression of peritoneal dissemination of GC and RC. Analyzing the morphology and cellular constituents could help understanding the mechanism of peritoneal metastasis.
Keywords: Milky spot, omentum, gastric cancer, rectal cancer, peritoneal metastasis
Introduction
Peritoneal carcinomatosis is a kind of regional metastatic disease arising from intraperitoneal tumors including carcinomas of the stomach, colorectum, and ovary [1-3]. After escaping from the primary tumor, cancer cells in the peritoneal fluid gain access into the peritoneum and can potentially infiltrate within a variety of peritoneal tissues. The omentum is the major site for peritoneal metastasis [4] because of more abundant milky spots (MS) than other tissues in the abdominal cavity such as the mesentery and the pelvic floor. Interspersed within the omentum, MS are specific sites consisting of a complex network of capillaries, aggregates of immune cells and loosely arranged mesothelial cells atop them. These unique microenvironment are adaptive for attachment, survival, and growth of peritoneal free cancer cells (PFCC) to facilitate metastatic colonization within the peritoneal cavity. However, precise cellular constituents of MS still need to be further studied.
This study aimed to conduct quantitative analysis on the histological features, cells number, and cellular composition of MS. These data could help gain a clear understanding of MS at the cytological and histological level to study the peritoneal metastasis of gastric cancer (GC) and rectal cancer (RC).
Materials and methods
Preparation for human omentum tissues
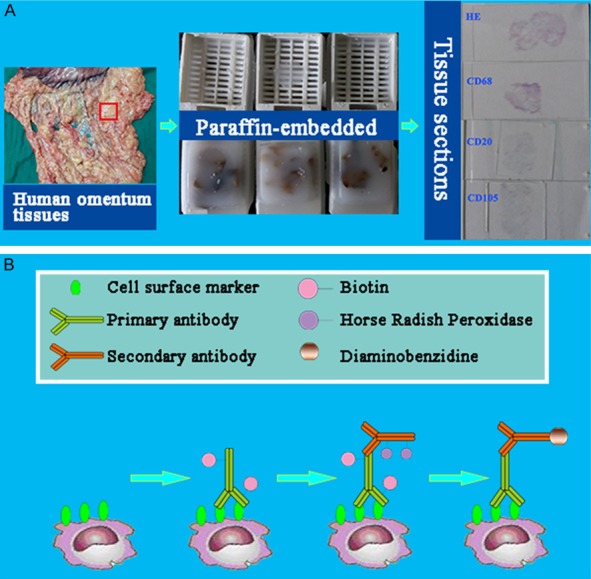
The omenta were obtained from three GC patients and three RC patients, and then fixed in neutral formalin and processed by routine histological procedure, with the study protocol approved by ethnics committee of hospital. According to our previously established technical procedure [5], tissue sections (4 μm thickness) were treated by deparaffinizing, hydration, antigen retrieval, and washing in deionized water before proceeding to the following imaging studies (Figure 1A).
Figure 1.

The design and major technical procedures of this study. A. Preparation of tissue sections. B. CD68, CD3, CD20cy, Calretinin and CD105 were imaged based on immunohistochemical method.
Immunohistochemistry
The immunohistochemistry (IHC) study was conducted to demonstrate mesothlial cells, macrophages, T lymphocytes, B lymphocytes and vascular endothelial cells. Primary antibodies used were listed in Table 1. After blocking endogenous peroxidase activity with 3% H2O2 for 10 min to prevent any nonspecific binding, 2% bovine serum albumin (BSA) was used to block the slides to decrease background intensity. Then the slides were first incubated with primary antibodies respectively for 2 h at 37°C, then rinsed and incubated with corresponding secondary antibodies (dilution 1:300) for 30 min at 37°C. The reaction products were visualized with diaminobenzidine (DAB, DAKO, Denmark). As a negative control, the primary antibody was replaced with Tries-buffered saline on sections that were proven to be positive for Calretinin, CD68, CD3, CD20cy and CD105 in preliminary experiments (Figure 1B).
Table 1.
Primary antibodies used in this study
| Primary antibody | Clone | Source | Dilution | For |
|---|---|---|---|---|
| Monoclonal Mouse Anti-Human CD68 | PG-M1 | Dako, Denmark | Ready-to-use | Macrophages |
| Monoclonal Mouse Anti-Human CD3 | F7.2.38 | T lymphocytes | ||
| Monoclonal Mouse Anti-Human CD20cy | L26 | B lymphocytes | ||
| Monoclonal Mouse Anti-Human Calretinin | DAK-Calret 1 | Mesothelial cells | ||
| Polyclonal Goat Anti-Human CD105 | P4A4 | Santa Cruz, USA | 1:500 | Vascular endothelial cells |
Image acquisition
Slides were examined under Olympus BX51 microscope equipped with an Olympus DP72 camera (Olympus Optical Co., Ltd., Tokyo, Japan) at 10, 20 and 40× magnifications and the images were captured by DP72 camera.
Using pixel value to calculate the size of MS
We drew the outline of every MS on HE stained images under the guide of expert-pathologist (Jing-Ping Yuan). The morphological features of MS were shown as different shapes with corresponding proportions. A self-adaptive Otsu threshold method was adopted by digital image processing computer scientist Ai-Ping Qu [6] to convert the obtained images into binary images. Then the perimeter of MS region could be output as pixel value spontaneously.
Cells counting methods
IHC stained results showed that outlines of T lymphocytes, B lymphocytes and mesothelial cells were clear enough to directly count cells number, while macrophages were in irregular shapes. In order to solve this problem, Imagepro Plus 6.0 software (IPP, Media Cybernetics, Inc., Washington, USA) [7] was operated to segment areas of interesting (AOI), that is brown macrophages of MS images as one color, and other cells of MS as another color. Then integrated optical density (IOD) of both color region could be obtained from the data output by IPP. The proportion of macrophages area was calculated subsequently by the equation that IOD Macrophages ×100%/IOD MS.
Microvessel density (MVD) was counted according to methods reported by Weidner et al. [8]. If separated with microvessels nearby or other connective tissues, every endothelial cell or endothelial cell clusters were treated as one microvessel. Formation of apparent lumen or exist of red blood cells was not judgment standard. In addition, blood vessels with lumen area more than 8 red blood cells or thick muscular layer were excluded.
Statistical analysis
Statistical analysis was performed with SPSS 21.0 software (SPSS Inc. Chicago, IL, USA). Results of cellular components number were expressed as median value with relevant range. Differences between MS from GC and RC were calculated by Mann-Whitney U test. Two sided P<0.05 was considered as statistically significant.
Results
Results of HE staining
Morphological features of MS
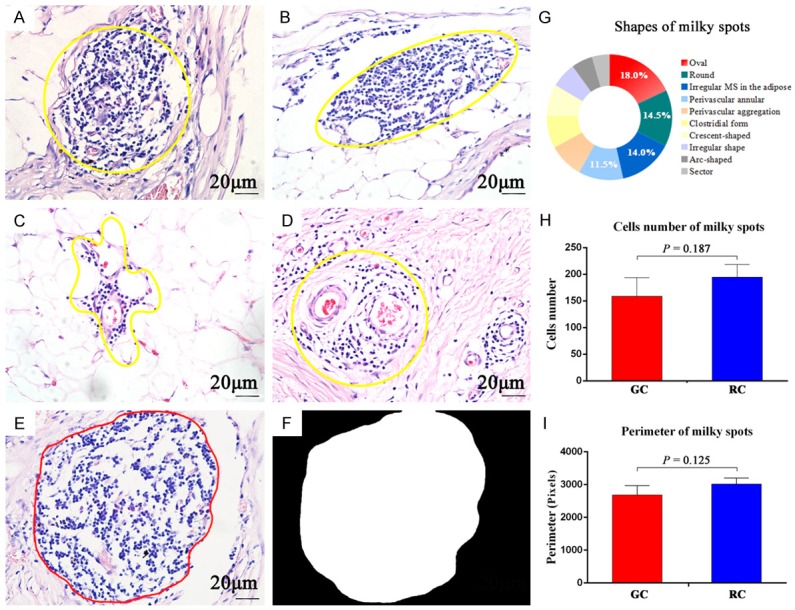
One hundred MS images from GC slides and one hundred MS from RC were obtained by HE staining. After drawing outlines of every MS, we carefully classified various shapes as round (14.5%), oval (18.0%), irregular form in the adipose (14.0%), perivascular annular (11.5%), perivascular aggregation (9.0%), sector (4.5%), clostridial form (8.5%), arc-shaped along the omental edge (5.5%) and others (14.5%) (Figure 2G). The former four types were the main shapes (Figure 2A-D). It was fairly common to find MS within the edge of the omentum in RC images, while this phenomenon was not obvious for GC. However, all MS were rich in blood vessels and a cluster of immune cells.
Figure 2.

HE staining of milky spots. The yellow frame is used to show the gross morphology of MS: A. Round. B. Oval. C. Irregular form in adipose tissues. D. Perivascular annular. E→F. Using computer methods to convert HE images into binary images for calculation of MS perimeter. G. Proportions of MS shapes. H + I. Comparison of MS cells number and perimeter between GC and RC, respectively. (A→F: 400×, scale bar =20 μm).
Cells number and size of MS
The median MS cells number for GC was 130, ranging from 43 to 520. The corresponding data for RC was 145, ranging from 45 to 650. There was no significant difference in MS cells number between GC and RC (P=0.187) (Figure 2H). The median MS perimeter for GC was 2545 pixels, ranging from 1104 to 4836 pixels. The corresponding data for RC was 2783 pixels, ranging from 817 to 7753 pixels. There was no significant difference in MS perimeters between GC and RC (P=0.125) (Figure 2I).
Results of IHC staining
Macrophages
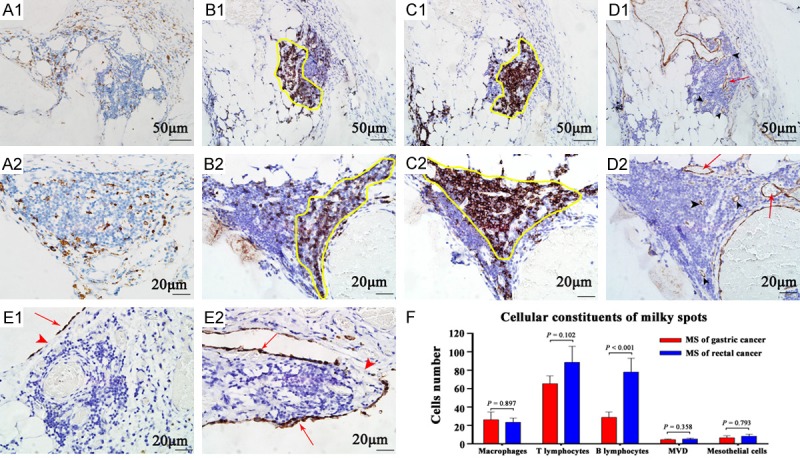
Macrophages with different sizes and irregular shapes were diffusely distributed among other immune cells (Figure 3A). The percentage composition of macrophages varies considerably by the output data of IPP software. In GC MS, the median macrophages percentage was 14.7%, ranging from 0.6% to 75.8%. The corresponding data of RC was 10.7%, ranging from 2.0% to 56.1%, with no significant difference from GC (P=0.897).
Figure 3.

IHC staining of milky spots to analyze the cellular constituents. A. Macrophages are diffusely distributed within MS. B, C. Lymphocytes are located intensively in particular position. The location of T lymphocytes is roughly complementary with B lymphocytes, as shown by the yellow frame. D. Black arrow heads indicate microvessels in MS, while red arrows indicate vessels more than 8 red blood cells in diameter. E. Red arrows indicate mesothelial cells stained by Calretinin. Red arrow heads indicate the stomata of MS. F. Different cellular components of MS. (A1→D1: 200×, scale bar =50 μm; A2→E2: 400×, scale bar =20 μm).
T lymphocytes
T lymphocytes accumulated to form cell mass located in particular position in MS (Figure 3B). The median T lymphocytes number of GC MS was 57, ranging from 20 to 146. The data of RC was 68, ranging from 17 to 280. There was no significant difference in MS T lymphocyte number between GC and RC (P=0.102).
B lymphocytes
B lymphocytes also formed accumulations located in particular position roughly complementary with T lymphocytes in MS (Figure 3C). The median B lymphocytes number of GC MS was 21, ranging from 7 to 100. The data of RC was 66, ranging from 7 to 220. B lymphocytes number of GC MS was significantly higher than RC MS (P<0.001).
Vascular endothelial cells
Micro-vessels exist-ed mainly in the internal layer of MS (Figure 3D). The median MVD of GC MS was 4, ranging from 0 to 11. The data of RC was 5, ranging from 0 to 13. There was no significant difference in MS MVD between GC and RC (P=0.358).
Mesothelial cells
The surface layer of MS was covered by mesothelial cells (MC) atop the aggregates of immune cells and blood vessels. The number of MC was approximately 3.6% of that of immune cells. MC was loosely arranged. Intercellular gaps and pores (stomata) are frequently found, and these openings expose underlying connective tissue matrix of MS (Figure 3E) and gain access into the abdominal cavity. In addition, there are also accumulated MC presenting double layer in few MS (Figure 3J). The median MC number of GC MS was 7, ranging from 0 to 17. The data of RC was 5, ranging from 0 to 51. There was no significant difference in MS mesothelial cells number between GC and RC (P=0.793).
General parameters
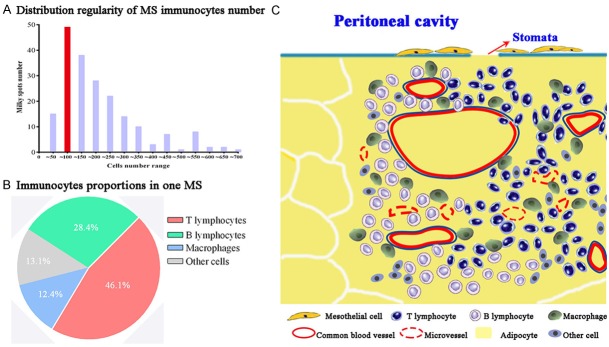
The above results of every parameter were summarized in Table 2. We found cells number of MS in HE images was mostly between 50 and 100, accounting for 24.5% (49/200) of the total studied MS. Based on total immune cells number obtained from HE images, results of cellular components of IHC images showed that the proportion of T lymphocytes, B lymphocytes, macrophages and other immune cells was 46.1%, 28.4%, 12.4% and 13.1%, respectively. Based on these information of MS morphology and cellular components (Figures 3F, 4A and 4B), we designed an illustrative diagram of MS structure (Figure 4C).
Table 2.
Comprehensive parameters of milky spots
| Parameters | Overall | Gastric cancer | Rectal cancer | P * |
|---|---|---|---|---|
|
| ||||
| Median (range) | Median (range) | Median (range) | ||
| Total immune cells | 141 (43~650) | 130 (43~520) | 145 (45~650) | 0.187 |
| Perimeter (pixels) | 2752 (817~7753) | 2545 (1104~4836) | 2783 (817~7753) | 0.125 |
| Mesothelial cells | 5 (0~51) | 7 (0~17) | 5 (0~51) | 0.793 |
| Macrophages (%) | 12.4 (0.6~75.8) | 14.7 (0.6~75.8) | 10.7 (2.0~56.1) | 0.897 |
| T lymphocytes | 65 (17~280) | 57 (20~146) | 68 (17~280) | 0.102 |
| B lymphocytes | 40 (7~220) | 21 (7~100) | 66 (7~220) | <0.001 |
| Micro-vessel density | 4 (0~13) | 4 (0~11) | 5 (0~13) | 0.358 |
Mann-Whitney U test.
Figure 4.
Morphological features of milky spots. A. Immunocytes number in one MS is mainly between 50 and 100. B. Immunocytes proportions of MS. C. The structure of MS: Leukocytes comprising macrophages, B cells, and T cells are arranged around the omental capillaries that lie directly beneath the discontinuous mesothelium with pores allowing for direct communication with the peritoneal cavity.
Discussion
Induced by synergistic effect of tumor cells and microenvironment [9-11], activating invasion and metastasis is one of the six biological capabilities acquired during the multistep development of human tumors [12]. Peritoneal metastasis is a frequent cause of death from GC and RC, with the great omentum as a predominant metastatic site. It is mainly because of the specific primary immune tissues called milky spots (MS), which are interspersed within the omental environment [13]. In the light of seed-soil theory, peritoneal cancer cells dislodged from the primary tumor become seeds maintaining the ability of invasion and metastasis, and preferentially attach, subsequently survive and grow within MS [14]. The intimate and dynamic interactions between cancer cells and cellular constituents of MS are largely unknown.
Mesothelial cells in the surface layer of MS constitute the first line of defense against tumor cells. The omentum, like the rest of the peritoneum, is covered by a layer of mesothelial cells [15]. These mesothelial cells can be injured by external tumor cells and internal macrophages of MS [16], then probably undergo transformation into myofibroblasts in response to TGF-β1 [17,18], thus creating a favorable microenvironment for peritoneal metastasis. In a word, the mesothelial cells are strong candidates for the preferential attachment of tumor cells on MS [13].
Immune cells constitute the main body part of MS. In our study, T lymphocytes form 46.1%, B lymphocytes 28.4%, and macrophages 12.4% of the immune cell population. Our quantification results differ from those described by Krist et al [19], in 1995. They reported a higher percentage of macrophages (67.9%±9.4, mean ± standard deviation). These differences can be explained by the following facts that a much higher number of MS are counted, more specific monoclonal antibodies are applied in our study, and MS is influenced by metastatic tumor cells to some extent. Other than cells proportion, positional relation of immune aggregates is analyzed by IHC technique as well. Lymphocytes tend to form accumulations located in particular position in MS, and T lymphocytes are roughly complementary with B lymphocytes. This phenomenon may represent or facilitate regional enhanced immunization for anti-tumor effect in early stages of metastasis. On the contrary, macrophages distribute diffusely in MS and along their border with surrounding tissues. In general, there are two forms of macrophages, classically activated (M1) and alternatively activated (or polarized, M2) [20]. M2 macrophages are also tumor-associated macrophages (TAM). Roles of TAMs vary in distinct microenvironments. TAMs promote metastasis in stromal and perivascular areas and stimulate angiogenesis in hypoxic avascular and peri-necrotic areas [21,22]. We need further study of macrophages phenotype to distinguish whether TAMs have site-specific locations in MS, thus ensuring the correlation between the structure and functions of MS.
Finally, the most important requirement for survival and growth of metastatic tumor cells is a high density of vascular system within the target tissues [23]. Metastatic tumor cells have been found to migrate toward the closest microvessel and there start dividing [24]. Only in this way, these aggressive cells will gain a survival advantage for subsequent growth into metastatic foci. Based on our results of CD105 immunostaining, microvessels are mainly located in the internal layer of MS. As a proliferation-associated antigen, CD105 is located predominately on vascular endothelial cells undergoing active angiogenesis [25,26]. Therefore, angiogenesis can be detected in MS once influenced by metastatic tumor cells. It also explains why MS is suitable for tumor survival and growth.
Except for changes of cellular components, the general morphology of MS is also influenced by metastatic tumor cells. Gerber et al. [27] have proved immune cell clusters in mice omentum are disrupted gradually after intraperitoneally injected with tumor cells. Once infiltrated with metastatic tumor cells, MS initially perform anti-tumor effect. After the apoptosis of mature cancer cells, remaining cancer stem cells [28,29] maintain the ability to proliferate and differentiate by releasing varieties of chemokines, inducing angiogenesis and so on. MS region is replaced by proliferating cancer cells gradually after inherent cellular components withering away. In our study, round and oval MS are two main morphology with the most immune cells from HE images. Other MS are either in irregular shape or with fewer immune cells. Thus, we can propose that round and oval shapes represent the early stages of complete MS. In conclusion, the reduction of the number of MS in early stages is a sign indicating the progression of peritoneal metastasis.
Conclusion
MS are hotbeds for invasion and metastasis of intraperitoneal tumor cells. Quantitative analysis on different parameters of MS can be conducted separately by IHC technique to obtain preliminary morphological characteristics, cellular constituents of MS. As preferential sites for metastasis of GC and RC, MS deserve to be studied furthermore. The proportion and positional relation of cellular constituents in MS become structural basis for development and progression of the peritoneal metastasis.
Acknowledgements
This study was supported by the following grants: Key Project of National Natural Science Foundation (No. 81230031/H18), The Hubei Province’s Outstanding Medical Academic Leader Program (No. [2013]4).
Disclosure of conflict of interest
None.
References
- 1.Glockzin G, Piso P. Current status and future directions in gastric cancer with peritoneal dissemination. Surg Oncol Clin N Am. 2012;21:625–633. doi: 10.1016/j.soc.2012.07.002. [DOI] [PubMed] [Google Scholar]
- 2.Mahteme H, Hansson J, Berglund A, Påhlman L, Glimelius B, Nygren P, Graf W. Improved survival in patients with peritoneal metastases from colorectal cancer: a preliminary study. Br J Cancer. 2004;90:403–407. doi: 10.1038/sj.bjc.6601586. [DOI] [PMC free article] [PubMed] [Google Scholar]
- 3.Lengyel E. Ovarian cancer development and metastasis. Am J Pathol. 2010;177:1053–1064. doi: 10.2353/ajpath.2010.100105. [DOI] [PMC free article] [PubMed] [Google Scholar]
- 4.Hagiwara A, Takahashi T, Sawai K, Taniguchi H, Shimotsuma M, Okano S, Sakakura C, Tsujimoto H, Osaki K, Sasaki S, Shirasu M. Milky spots as the implantation site for malignant cells in peritoneal dissemination in mice. Cancer Res. 1993;53:687–692. [PubMed] [Google Scholar]
- 5.Chen C, Peng J, Xia HS, Yang GF, Wu QS, Chen LD, Zeng LB, Zhang ZL, Pang DW, Li Y. Quantum dots-based immunofluorescence technology for the quantitative determination of HER2 expression in breast cancer. Biomaterials. 2009;30:2912–2918. doi: 10.1016/j.biomaterials.2009.02.010. [DOI] [PubMed] [Google Scholar]
- 6.Wang LW, Qu AP, Yuan JP, Chen C, Sun SR, Hu MB, Liu J, Li Y. Computer-based image studies on tumor nests mathematical features of breast cancer and their clinical prognostic value. PLoS One. 2013;8:e82314. doi: 10.1371/journal.pone.0082314. [DOI] [PMC free article] [PubMed] [Google Scholar]
- 7.Gu J, Liang Y, Qiao L, Li X, Li X, Lu Y, Zheng Q. Expression analysis of URI/RMP gene in endometrioid adenocarcinoma by tissue microarray immunohistochemistry. Int J Clin Exp Pathol. 2013;6:2396–2403. [PMC free article] [PubMed] [Google Scholar]
- 8.Weidner N, Folkman J, Pozza F, Bevilacqua P, Allred EN, Moore DH, Meli S, Gasparini G. Tumor angiogenesis: a new significant and independent prognostic indicator in early-stage breast carcinoma. J Natl Cancer Inst. 1992;84:1875–1887. doi: 10.1093/jnci/84.24.1875. [DOI] [PubMed] [Google Scholar]
- 9.Wu SD, Ma YS, Fang Y, Liu LL, Fu D, Shen XZ. Role of the microenvironment in hepatocellular carcinoma development and progression. Cancer Treat Rev. 2012;38:218–225. doi: 10.1016/j.ctrv.2011.06.010. [DOI] [PubMed] [Google Scholar]
- 10.Peng CW, Tian Q, Yang GF, Fang M, Zhang ZL, Peng J, Li Y, Pang DW. Quantum-dots based simultaneous detection of multiple biomarkers of tumor stromal features to predict clinical outcomes in gastric cancer. Biomaterials. 2012;33:5742–5752. doi: 10.1016/j.biomaterials.2012.04.034. [DOI] [PubMed] [Google Scholar]
- 11.Fang M, Yuan JP, Peng CW, Pang DW, Li Y. Quantum dots-based in situ molecular imaging of dynamic changes of collagen IV during cancer invasion. Biomaterials. 2013;34:8708–8717. doi: 10.1016/j.biomaterials.2013.07.069. [DOI] [PubMed] [Google Scholar]
- 12.Hanahan D, Weinberg RA. Hallmarks of cancer: the next generation. Cell. 2011;144:646–674. doi: 10.1016/j.cell.2011.02.013. [DOI] [PubMed] [Google Scholar]
- 13.Sorensen EW, Gerber SA, Sedlacek AL, Rybalko VY, Chan WM, Lord EM. Omental immune aggregates and tumor metastasis within the peritoneal cavity. Immunol Res. 2009;45:185–194. doi: 10.1007/s12026-009-8100-2. [DOI] [PMC free article] [PubMed] [Google Scholar]
- 14.Jayne D. Molecular biology of peritoneal carcinomatosis. Cancer Treat Res. 2007;134:21–33. doi: 10.1007/978-0-387-48993-3_2. [DOI] [PubMed] [Google Scholar]
- 15.Beelen RH. The greater omentum: physiology and immunological concepts. Neth J Surg. 1991;43:145–149. [PubMed] [Google Scholar]
- 16.Liu XY, Miao ZF, Zhao TT, Wang ZN, Xu YY, Gao J, Wu JH, You Y, Xu H, Xu HM. Milky spot macrophages remodeled by gastric cancer cells promote peritoneal mesothelial cell injury. Biochem Biophys Res Commun. 2013;439:378–383. doi: 10.1016/j.bbrc.2013.08.073. [DOI] [PubMed] [Google Scholar]
- 17.Lv ZD, Na D, Ma XY, Zhao C, Zhao WJ, Xu HM. Human peritoneal mesothelial cell transformation into myofibroblasts in response to TGF-β1 in vitro. Int J Mol Med. 2011;27:187–193. doi: 10.3892/ijmm.2010.574. [DOI] [PubMed] [Google Scholar]
- 18.Standiford TJ, Kuick R, Bhan U, Chen J, Newstead M, Keshamouni VG. TGF-β-induced IRAK-M expression in tumor-associated macrophages regulates lung tumor growth. Oncogene. 2011;30:2475–2484. doi: 10.1038/onc.2010.619. [DOI] [PMC free article] [PubMed] [Google Scholar]
- 19.Krist LF, Eestermans IL, Steenbergen JJ, Hoefsmit EC, Cuesta MA, Meyer S, Beelen RH. Cellular composition of milky spots in the human greater omentum: an immunochemical and ultrastructural study. Anat Rec. 1995;241:163–174. doi: 10.1002/ar.1092410204. [DOI] [PubMed] [Google Scholar]
- 20.Martinez FO, Sica A, Mantovani A, Locati M. Macrophage activation and polarization. Front Biosci. 2008;13:453–461. doi: 10.2741/2692. [DOI] [PubMed] [Google Scholar]
- 21.Lewis CE, Pollard JW. Distinct role of macrophages in different tumor microenvironments. Cancer Res. 2006;66:605–612. doi: 10.1158/0008-5472.CAN-05-4005. [DOI] [PubMed] [Google Scholar]
- 22.Sica A. Role of tumour-associated macrophages in cancer-related inflammation. Exp Oncol. 2010;32:153–158. [PubMed] [Google Scholar]
- 23.Folkman J. Role of angiogenesis in tumor growth and metastasis. Semin Oncol. 2002;29:15–18. doi: 10.1053/sonc.2002.37263. [DOI] [PubMed] [Google Scholar]
- 24.Li CY, Shan S, Huang Q, Braun RD, Lanzen J, Hu K, Lin P, Dewhirst MW. Initial stages of tumor cell-induced angiogenesis: evaluation via skin window chambers in rodent models. J Natl Cancer Inst. 2000;92:143–147. doi: 10.1093/jnci/92.2.143. [DOI] [PubMed] [Google Scholar]
- 25.Fonsatti E, Maio M. Highlights on endoglin (CD105): from basic findings towards clinical applications in human cancer. J Transl Med. 2004;2:18. doi: 10.1186/1479-5876-2-18. [DOI] [PMC free article] [PubMed] [Google Scholar]
- 26.Sánchez-Elsner T, Botella LM, Velasco B, Langa C, Bernabéu C. Endoglin expression is regulated by transcriptional cooperation between the hypoxia and transforming growth factor-beta pathways. J Biol Chem. 2002;277:43799–43808. doi: 10.1074/jbc.M207160200. [DOI] [PubMed] [Google Scholar]
- 27.Gerber SA, Rybalko VY, Bigelow CE, Lugade AA, Foster TH, Frelinger JG, Lord EM. Preferential attachment of peritoneal tumor metastases to omental immune aggregates and possible role of a unique vascular microenvironment in metastatic survival and growth. Am J Pathol. 2006;169:1739–1752. doi: 10.2353/ajpath.2006.051222. [DOI] [PMC free article] [PubMed] [Google Scholar]
- 28.Cao L, Hu X, Zhang Y. Omental milky spots--highly efficient “natural filter” for screening gastric cancer stem cells. Med Hypotheses. 2009;73:1017–1018. doi: 10.1016/j.mehy.2009.03.055. [DOI] [PubMed] [Google Scholar]
- 29.Xu G, Shen J, Ou Yang X, Sasahara M, Su X. Cancer stem cells: the ‘heartbeat’ of gastric cancer. J Gastroenterol. 2013;48:781–797. doi: 10.1007/s00535-012-0712-y. [DOI] [PubMed] [Google Scholar]


