

Abstract
Gastric cancer (GC) is one of the most common malignancies and ranks the second leading cause of cancer death worldwide. The role of long non-coding RNAs (lncRNAs) in the gastric cancer pathogenesis is largely unknown. The present study is aimed to identify aberrantly expressed lncRNAs involved in the progression of GC. 33 lncRNAs showed significantly differential expression levels between gastric tumor samples and matched normal tissues from 5 pairs of samples using microarray assay. LncRNAs were classified into different subgroups. The expression levels of 4 lncRNAs: HIF1A-AS1, PVT1, CBR3-AS1 and UCA1 both in tumor and plasma were further confirmed in 20 gastric patients by real-time PCR assay. Then, the correlations between the tissue and plasma of these 4 lncRNA levels were assessed. Our data show that there was a significantly positive correlation of UCA1 expression levels between tumor tissues and plasma (r = 0.931). Furthermore, the specificity and sensitivity of PVT-1 and UCA1 were evaluated by receiver operating characteristic (ROC) curve. The results demonstrated that plasma UCA1 provided the higher diagnostic performance for detection of GC (AUC = 0.928; P < 0.001) than PVT-1 (AUC = 0.731; P < 0.01). Taken together, our study suggested that plasma UCA1 levels could be a promising candidate of noninvasive biomarker for GC early diagnosis.
Keywords: Gastric cancer, biomarker, lncRNA, UCA1
Introduction
Gastric cancer (GC) is one of the most common malignancies and ranks the second leading cause of cancer death worldwide with the incidence of 69 in 100,000 per year in northeast of Asia [1,2]. No or mild typical signs of gastric cancer exist until the cancer is advanced, leading to a great difficulty in early gastric cancer diagnosis. Despite multiple therapeutic strategies to eradicate GC cell, including surgery, chemotherapy and radiotherapy, the prognosis of gastric cancer is still very poor for its ability to metastasize to regional lymph nodes, liver, and the peritoneal cavity [3-5]. The average survival rate around the world is only about 30% of the patients diagnosed with gastric cancer in 2000. However, in Japan, survival is good (52%), in part attributable to early detection in screening programs [6].
Therefore, tumor circulation biomarkers for gastric cancer are indispensable for minimally invasive diagnosis in the early stage to reduce gastric cancer mortality rates. However, the currently known tumor antigens in serum, such as CA72-4, CEA, and CA19-9, are of little use in gastric cancer diagnosis [7,8]. Thus, screening out other alternative tumor biomarkers would enable the early detection of gastric cancer. Recent studies of cancer genetics and epigenetics have revealed novel diagnostic biomarkers and therapeutic targets in carcinogenesis, such as DNA methylation, histone modifications, nucleosome positioning, and non-coding RNAs (ncRNAs) by whole-genome sequencing and whole-transcriptome sequencing analyses [9,10]. Non-coding RNAs (ncRNAs) which are unable to be translated into proteins are grouped into two major classes based on transcript size: small ncRNAs (< 200 nt) and long non-coding RNAs (lncRNAs). Small ncRNAs including microRNAs, siRNAs and piRNAs are shown to play important roles in gastric carcinogenesis [11,12]. LncRNAs are emerging as new players in tumorigenic with oncogenic or tumor suppressive roles by regulating gene expression at the transcriptional, post-transcriptional and transcriptional levels.
One lncRNA that has attracted significant attention is urothelial carcinoma-associated 1 (UCA1), which is located in chromosome 19p13.12 and contains three exons encoding two transcripts. One is 1.2 kb in length, another transcript (2.2 kb) was identified in doxorubicin-resistant human squamous carcinoma cells which induces drug resistance [13]. UCA1 is highly expressed in bladder cancer and enhances bladder cancer cell proliferation and migration, indicating UCA1 may function as a biomarker for the diagnosis of bladder cancer [14]. However, the contributions of UCA1 to gastric cancer remain largely unknown.
In the present study, we investigated the expression of 33 lncRNA in 5 paired gastric cancer samples. We further examined the relationships between 4 lncRNAs expression levels both in tumor tissues and plasma by real-time PCR assay. Furthermore, the specificity and sensitivity of PVT-1 and UCA1 were evaluated. Our study indicated that plasma UCA1 levels might be useful biomarkers for gastric cancer diagnosis.
Materials and methods
Patients’ samples
The 5 gastric cancer tissues and the 5 pair-matched noncancerous tissues utilized in this study were obtained from patients at Linyi People Hospital, Shandong Province, China. None of the patients had received preoperative radiotherapy or chemotherapy prior to surgical resection. The 20 plasma samples of patients and pair-matched plasma samples were collected at the Linyi People Hospital Hospital, Shandong Province, China. This study was performed with the approval of Research Ethics Committee of Linyi People Hospital. Informed consent was obtained from all individual participants included in the study. Tumor and corresponding non-tumor fresh specimens were snap-frozen in liquid nitrogen for the extraction of total RNA.
RNA extraction and real-time PCR
Total RNAs was isolated from 100 mg tissue using Trizol reagent (Invitrogen, Carlsbad, CA, USA) and stored at -80°C immediately after the extraction of RNA. First-strand cDNA was generated using the Reverse Transcription System Kit (Takara, Dalian, China). Real-time PCR was performed using the standard SYBR Green PCR kit protocol (Takara, Dalian, China). GAPDH was employed as an endogenous control for lncRNA. The primer sequences used were as follows: HIF1A-AS1, 5’-AATGTGTTCCTTGCTCTT-3’ (forward) and 5’-GTATGTCTCAGTTATCTTCCT-3’ (reverse); PVT1, 5’-CTTGAGAACTGTCCTTACG-3’ (forward) and 5’-CAGATGAACCAGGTGAAC-3’ (reverse); CBR3-AS1, 5’-CTTCTGGTTACAATGATTCTC-3’ (forward) and 5’-CACTTACTGCCTACATTAGA-3’ (reverse); UCA1, 5’-TTCCTTATTATCTCTTCTG-3’ (forward) and 5’-TCCATCATACGAATAGTA-3’ (reverse); GAPDH, 5’-CTCGCTTTGGCAGCACA-3’ (forward) and 5’-AACGCTTCACGAATTTGCGT-3’ (reverse).
The real-time PCR reactions were performed in triplicate, and the mean was calculated for data analysis. Cycle threshold (Ct) values were obtained using the real-time PCR melting curve plot. Values for HIF1A-AS1, PVT1, CBR3-AS1, and UCA1 expression were normalized to their controls by using the 2-ΔΔCt calculation method.
Statistical analysis
All tests and calculations were done with the help of SPSS software (version 17.0). Data were summarized as mean ± SE. Groups were compared using Student’s t test and ANOVA followed by Bonferronipost hoc test. P < 0.05 was considered as statistically significant. Sensitivity, specificity, positive predictive value (PPV), negative predictive value (NPV), diagnostic accuracy, and likelihood ratio (LR) were assessed by ROC curve analysis.
Results
Overview of profiles of aberrantly expressed lncRNAs in gastric cancer
Human LncRNA Microarray V3.0 (8 × 60 K) was used to analyze lncRNA expression profiles in 5 GC tissues and paired corresponding non-tumorous tissues. 68 diseases associated-lncRNA were screened out by the LncRNA and Disease Database. Among them, fold change greater than 2 between tumor tissues and normal tissues was set as the criteria to further filter the top 33 significantly dysregulated lncRNAs (Figure 1). Those LncRNAs were used to carry on Unsupervised Hierarchical Clustering. The classification of differentially expressed lncRNAs indicated the complication of gastric cancer. 13 lncRNAs were up-regulated whereas 20 lncRNAs were down-regulated. Among these dysregulated lncRNAs, HIF1A-AS1, PVT1, CBR3-AS1 and UCA1 which were reported as candidates for biomarker of some diseases, were further identified in our study (Figure 2).
Figure 1.
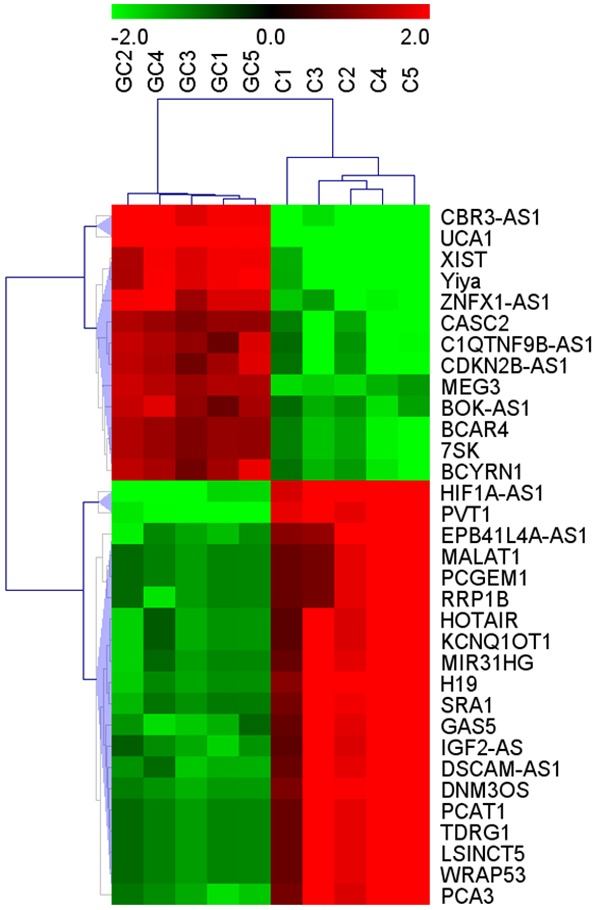
Alterations in lncRNA expression profiles between gastric carcinoma tissues and non-tumorous tissues in lncRNA microarray. Hierarchical clustering analysis showed the 33 significantly dysregulated lncRNAs among samples. The normalized expression values are represented in shades of red and blue, indicating expression above (blue) and below (red) the median expression value across the 10 samples.
Figure 2.
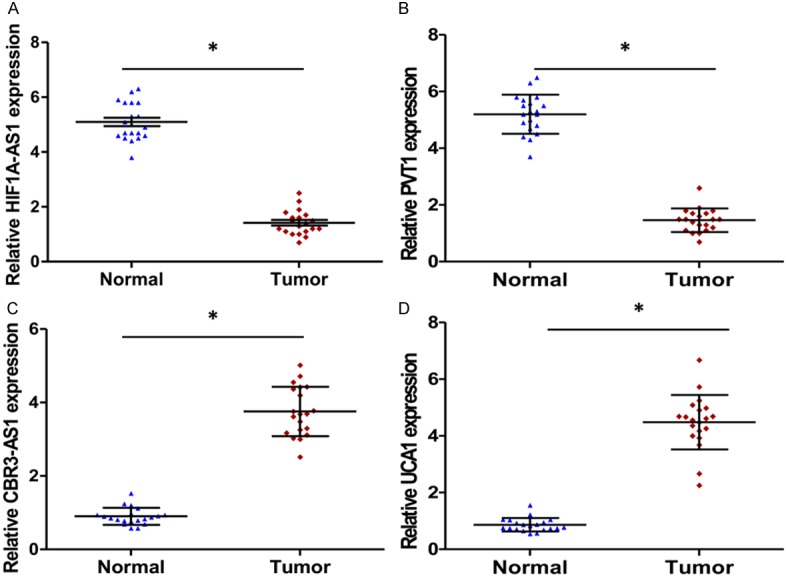
HIF1A-AS1, PVT1, CRB3-AS1 and UCA1 expression levels in gastric cancer tissues and adjacent normal tissues. (A) HIF1A-AS1, (B) PVT1, (C) CRB3-AS1 and (D) UCA1 expression were examined by qRT-PCR and normalized to GAPDH expression (Tumor, red square) compared with corresponding non-tumor tissues (Normal, blue triangle, *P < 0.001, n = 20). Data are expressed as the means ± SE of three independent experiments.
UCA1 is aberrantly up-regulated both in GC tissues and plasma
As shown in Table 1, Univariate analysis indicated that the expression level of UCA1, clinical stage and lymph node metastasis were correlated with overall survival rate of patients with GC. These results demonstrated that the expression of UCA1 in GC patients could be developed as a powerful independent prognostic factor. We further analyzed the expression of the top 2 downregulated and up-regulated lncRNAs in 20 GC tissues and corresponding nontumourous tissues by qRT-PCR. The expression of HIF1A-AS1 and PVT1 drastically decreased in GC tumor tissues (Figure 2A and 2B). Conversely, the expression of CBR3-AS1 and UCA1 increased (Figure 2C and 2D). Especially the expression of UCA1 in GC tissues was conspicuously 8 times higher than that observed in pair-matched adjacent nontumourous tissues (P < 0.001, Figure 2D). Moreover, UCA1 expression also increased in plasma from GC patients and a positive correlation was noted between GC tissues and plasma (r = 0.931, P < 0.001, Figure 3D), whereas, for CBR3-AS1 (r = 0.527, P < 0.001, Figure 3C), the correlation was not as significant as UCA1. In consideration of the opposite expression pattern of HIF1A -AS1 and PVT1, we further analyzed their correlation between GC tissue and plasma, HIF1A-AS1 (r = 0.616, P < 0.001, Figure 3A) and PVT1 (r = 0.752, P < 0.001, Figure 3B) showed weak correlation between GC tissues and plasma. Taken together, our results reveal that UCA1 was aberrantly up-regulated both in GC tissues and plasma and may be associated with GC disease progression.
Table 1.
Univariate and multivariate regression analyses of parameters associated with prognosis of GC patients
| Variable | Subset | Univariate analysis | Multivariate analysis | ||
|---|---|---|---|---|---|
|
|
|||||
| Hazard ratio (95% CI) | P value | Hazard ratio (95% CI) | P value | ||
| Gender | Male/Female | 1.174 (0.659-1.852) | 0.683 | ||
| Age | < 60/≥ 60 | 1.217 (0.859-1.925) | 0.437 | ||
| Tumor size (cm) | < 3/≥ 3 | 1.285 (0.908-2.136) | 0.604 | ||
| Histological | I-II/III-IV | 2.637 (1.502-4.529) | 0.001 | 2.216 (1.314-3.604) | 0.011 |
| Lymph nodes metastasis | N/P | 3.239 (1.805-5.371) | 0.001 | 2.235 (1.113-4.052) | 0.001 |
| UCA1 | High/Low | 2.793 (1.841-5.051) | 0.001 | 2.017 (1.024-3.371) | 0.012 |
Figure 3.
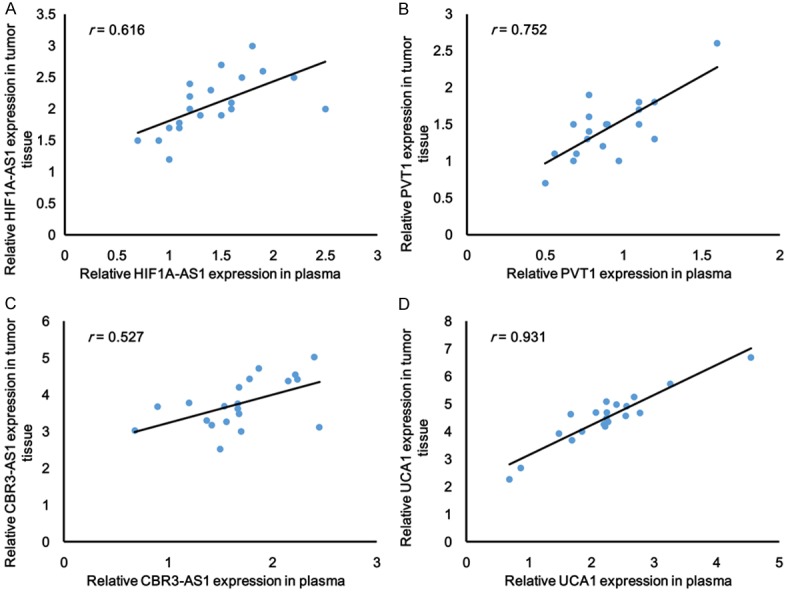
The correlation analysis of lncRNAs (A) HIF1A-AS1, (B) PVT1, (C) CRB3-AS1 and (D) UCA1 (n = 20) expression between tumor tissue and plasma were performed (*P < 0.001, n = 20).
UCA1 may be used as a noninvasive biomarker for GC
The UCA1 and PVT1 levels detected in the cancer and non-cancerous tissue were constructed on ROC curves. Highly expressed UCA1 level showed a sensitivity of 89.2% and a specificity of 80.3% with a diagnostic accuracy of 85.7%, whereas the sensitivity and specificity of PVT1 were 59.3% and 92.1%, respectively, with a diagnostic accuracy of 68.9%. The area under the ROC curve for UCA1 was 0.928 (95% confidence interval (CI) = 0.888-0.968; P < 0.001, Figure 4B), whereas for PVT1, it is 0.797 (95% CI = 0.731-0.863; P < 0.01, Figure 4A). UCA1 was more sensitive for diagnosis of patients in comparison to the sensitivity by PVT1. Moreover, the sensitivity, specificity, accuracy of UCA1 and PVT1 for distinguishing GC from healthy controls were summarized in Table 2. The results indicated that the diagnostic effect of UCA1 for GC screening from healthy controls was better than PVT1.
Figure 4.
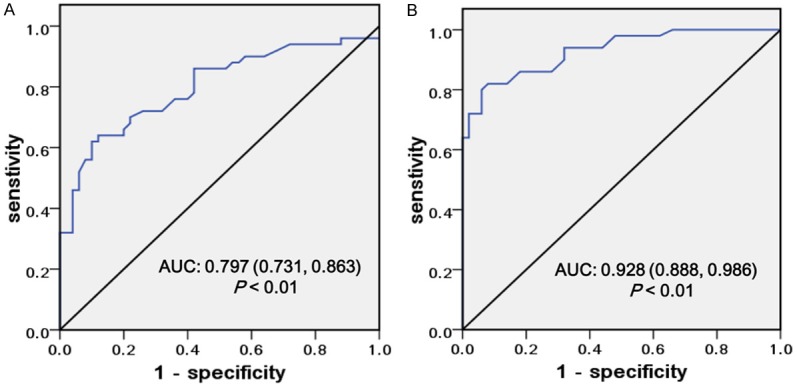
Potential diagnostic values of PVT1 and UCA1. The ROC curves of PVT1 (A) and UCA1 (B) predict the presence of GC in terms of sensitivity and specificity.
Table 2.
Performance of UCA1 in the differential diagnosis GC from healthy participants
| Sensitivity | Specificity | Accuracy | Youden index | True positive | True negative | False positive | False negative | |
|---|---|---|---|---|---|---|---|---|
| UCA1 | 85.0% | 96.3% | 94.9% | 81.3% | 102 | 18 | 34 | 873 |
| PVT1 | 70.8% | 91.3% | 88.9% | 62.1% | 85 | 35 | 79 | 828 |
Discussion
Human gastric cancer is the highest morbidity digestive system malignancy and the second fatal human cancers worldwide especially in the northeast of Asia. Among the frequently mutated genes, cell adhesion was the most significant biological pathway affected. Mutated FAT4 gene, which was a member of the cadherin gene family, lost the ability to suppress tumor growth via Hippo signaling [15]. Mutations in chromatin remodeling genes (ARID1A, MLL3 and MLL) were also found in 47% of GCs [16]. However, about 20,000 protein coding gene only account less than 2% the total genome, the rest 98% are noncoding RNAs (ncRNAs) which exert its function by targeting coding genes. It is well investigated that miRNA alterations play a key role in the pathogenesis of GC [17]. Some of the tumor-derived miRNAs levels in tumor tissue have a positive correlation with the levels in circulation. MiRNA may serve as clinical candidates for noninvasive diagnostic biomarkers. New emerging molecules lncRNAs have opened new avenue for the study of diverse biological processes, including development, cell growth and tumorigenesis. The investigation of the role of lncRNA in tumors is a big challenge full of promise [18].
In the present study, the profiles of aberrantly expressed lncRNAs in the gastric cancer and pair-matched noncancerous tissues were evaluated. The expression levels of four lncRNAs were further confirmed by RT-PCR. They were studied in cancers or other diseases. HIF1A-AS1 was demonstrated to be involved in the proliferation of different types of cells. HIF1A-AS1 silencing enhanced the proliferation of Hepatic stellate cells leading to liver fibrosis and the proliferation of vascular smooth muscle cells resulting in thoracic aortic aneurysms [19,20]. The increased expression of PVT1 in a variety of tumors [21] shared a positive correlation with the expression of oncogene MYC [22]; interestingly, PVT1 lied in a cancer risk locus that it shares with MYC [23]. PVT1 protected MYC from protein degradation and they cooperate to promote cell proliferation in cancer [24]. CBR3-AS1 which was also named PlncRNA-1 was upregulated in the prostate cancer and esophageal squamous carcinoma [25]. UCA1 is an lncRNA that is associated with drug resistance and tumor cell viability. Over-expression of UCA1 in bladder cancer cells resulted in cisplatin resistance by targeting Wnt6 and significantly increased cell growth via CREB through PI3-K dependent pathway [26]. Consistent with upregulation of UCA1 in bladder cancer tissues from previous reports, our results demonstrated that UCA1 is also upregulated in GC tissues in comparison with pair-matched noncancerous tissues. UCA1 upregulation in GC tissue was positively correlated with the level in circulation. It suggests that UCA1 is involved in the GC carcinogenesis and has an excellent prospect to become a biomarker of GC in early stage.
Further evaluation on a larger patient population is also needed. The molecular mechanisms of how UCA1 works is largely unknown. Next we will focus on GC-related miRNAs or proteins to find out the direct target gene of UCA1. This will make beneficial effects on the understanding of the biological function of UCA1 and the GC diagnosis and treatment.
Acknowledgements
We appreciate all of the patients participated in this study. Informed consent was obtained from all individual participants included in the study.
Disclosure of conflict of interest
None.
References
- 1.Siegel R, Ma J, Zou Z, Jemal A. Cancer statistics, 2014. CA Cancer J Clin. 2014;64:9–29. doi: 10.3322/caac.21208. [DOI] [PubMed] [Google Scholar]
- 2.Young JA, Shimi SM, Kerr L, McPhillips G, Thompson AM. Reduction in gastric cancer surgical mortality over 10 years: An adverse events analysis. Ann Med Surg (Lond) 2014;3:26–30. doi: 10.1016/j.amsu.2014.03.003. [DOI] [PMC free article] [PubMed] [Google Scholar]
- 3.Hartgrink HH, Jansen EP, van Grieken NC, van de Velde CJ. Gastric cancer. Lancet. 2009;374:477–490. doi: 10.1016/S0140-6736(09)60617-6. [DOI] [PMC free article] [PubMed] [Google Scholar]
- 4.Ilson DH. Adjuvant treatment for gastric cancer: too much is not enough. Lancet Oncol. 2014;15:788–789. doi: 10.1016/S1470-2045(14)70293-1. [DOI] [PubMed] [Google Scholar]
- 5.Bagcchi S. Radiotherapy for testicular cancer increases gastric cancer risk. Lancet Oncol. 2014;15:e593. doi: 10.1016/S1470-2045(14)71118-0. [DOI] [PubMed] [Google Scholar]
- 6.Parkin DM. Global cancer statistics in the year 2000. Lancet Oncol. 2001;2:533–543. doi: 10.1016/S1470-2045(01)00486-7. [DOI] [PubMed] [Google Scholar]
- 7.Liu Z, Shao Y, Tan L, Shi H, Chen S, Guo J. Clinical significance of the low expression of FER1L4 in gastric cancer patients. Tumour Biol. 2014;35:9613–9617. doi: 10.1007/s13277-014-2259-4. [DOI] [PubMed] [Google Scholar]
- 8.Sun Z, Zhang N. Clinical evaluation of CEA, CA19-9, CA72-4 and CA125 in gastric cancer patients with neoadjuvant chemotherapy. World J Surg Oncol. 2014;12:397. doi: 10.1186/1477-7819-12-397. [DOI] [PMC free article] [PubMed] [Google Scholar]
- 9.Yamamoto H, Watanabe Y, Maehata T, Morita R, Yoshida Y, Oikawa R, Ishigooka S, Ozawa S, Matsuo Y, Hosoya K, Yamashita M, Taniguchi H, Nosho K, Suzuki H, Yasuda H, Shinomura Y, Itoh F. An updated review of gastric cancer in the next-generation sequencing era: insights from bench to bedside and vice versa. World J Gastroenterol. 2014;20:3927–3937. doi: 10.3748/wjg.v20.i14.3927. [DOI] [PMC free article] [PubMed] [Google Scholar]
- 10.Calcagno DQ, Gigek CO, Chen ES, Burbano RR, Smith Mde A. DNA and histone methylation in gastric carcinogenesis. World J Gastroenterol. 2013;19:1182–1192. doi: 10.3748/wjg.v19.i8.1182. [DOI] [PMC free article] [PubMed] [Google Scholar]
- 11.Xu Q, Liu JW, Yuan Y. Comprehensive assessment of the association between miRNA polymorphisms and gastric cancer risk. Mutat Res Rev Mutat Res. 2015;763:148–160. doi: 10.1016/j.mrrev.2014.09.004. [DOI] [PubMed] [Google Scholar]
- 12.Gu W, Gao T, Sun Y, Zheng X, Wang J, Ma J, Hu X, Li J, Hu M. LncRNA expression profile reveals the potential role of lncRNAs in gastric carcinogenesis. Cancer Biomark. 2015;15:249–58. doi: 10.3233/CBM-150460. [DOI] [PMC free article] [PubMed] [Google Scholar]
- 13.Otani N, Kumamoto Y, Tsukamoto T, Miyao N, Iwabe H, Yanase M, Takahashi A, Masumori N. [Clinical efficacy of modified M-VAC chemotherapy for advanced urothelial carcinoma and influence of squamous cell carcinoma-associated antigen on efficacy of the chemotherapy] . Nihon Hinyokika Gakkai Zasshi. 1991;82:786–791. doi: 10.5980/jpnjurol1989.82.786. [DOI] [PubMed] [Google Scholar]
- 14.Srivastava AK, Singh PK, Rath SK, Dalela D, Goel MM, Bhatt ML. Appraisal of diagnostic ability of UCA1 as a biomarker of carcinoma of the urinary bladder. Tumour Biol. 2014;35:11435–11442. doi: 10.1007/s13277-014-2474-z. [DOI] [PubMed] [Google Scholar]
- 15.Katoh M. Function and cancer genomics of FAT family genes (review) Int J Oncol. 2012;41:1913–1918. doi: 10.3892/ijo.2012.1669. [DOI] [PMC free article] [PubMed] [Google Scholar]
- 16.Lee J, Kim KM, Kang WK, Ou SH. Innovative personalized medicine in gastric cancer: time to move forward. Clin Genet. 2014;86:37–43. doi: 10.1111/cge.12408. [DOI] [PubMed] [Google Scholar]
- 17.Matuszcak C, Haier J, Hummel R, Lindner K. MicroRNAs: promising chemoresistance biomarkers in gastric cancer with diagnostic and therapeutic potential. World J Gastroenterol. 2014;20:13658–13666. doi: 10.3748/wjg.v20.i38.13658. [DOI] [PMC free article] [PubMed] [Google Scholar]
- 18.Yarmishyn AA, Kurochkin IV. Long noncoding RNAs: a potential novel class of cancer biomarkers. Front Genet. 2015;6:145. doi: 10.3389/fgene.2015.00145. [DOI] [PMC free article] [PubMed] [Google Scholar]
- 19.Wang S, Zhang X, Yuan Y, Tan M, Zhang L, Xue X, Yan Y, Han L, Xu Z. BRG1 expression is increased in thoracic aortic aneurysms and regulates proliferation and apoptosis of vascular smooth muscle cells through the long non-coding RNA HIF1A-AS1 in vitro. Eur J Cardiothorac Surg. 2015;47:439–446. doi: 10.1093/ejcts/ezu215. [DOI] [PubMed] [Google Scholar]
- 20.Zhang QQ, Xu MY, Qu Y, Hu JJ, Li ZH, Zhang QD, Lu LG. TET3 mediates the activation of human hepatic stellate cells via modulating the expression of long non-coding RNA HIF1A-AS1. Int J Clin Exp Pathol. 2014;7:7744–7751. [PMC free article] [PubMed] [Google Scholar]
- 21.Colombo T, Farina L, Macino G, Paci P. PVT1: a rising star among oncogenic long noncoding RNAs. Biomed Res Int. 2015;2015:304208. doi: 10.1155/2015/304208. [DOI] [PMC free article] [PubMed] [Google Scholar]
- 22.Chapman MH, Tidswell R, Dooley JS, Sandanayake NS, Cerec V, Deheragoda M, Lee AJ, Swanton C, Andreola F, Pereira SP. Whole genome RNA expression profiling of endoscopic biliary brushings provides data suitable for biomarker discovery in cholangiocarcinoma. J Hepatol. 2012;56:877–885. doi: 10.1016/j.jhep.2011.10.022. [DOI] [PMC free article] [PubMed] [Google Scholar]
- 23.Wang F, Yuan JH, Wang SB, Yang F, Yuan SX, Ye C, Yang N, Zhou WP, Li WL, Li W, Sun SH. Oncofetal long noncoding RNA PVT1 promotes proliferation and stem cell-like property of hepatocellular carcinoma cells by stabilizing NOP2. Hepatology. 2014;60:1278–1290. doi: 10.1002/hep.27239. [DOI] [PubMed] [Google Scholar]
- 24.Tseng YY, Moriarity BS, Gong W, Akiyama R, Tiwari A, Kawakami H, Ronning P, Reuland B, Guenther K, Beadnell TC, Essig J, Otto GM, O’Sullivan MG, Largaespada DA, Schwertfeger KL, Marahrens Y, Kawakami Y, Bagchi A. PVT1 dependence in cancer with MYC copy-number increase. Nature. 2014;512:82–86. doi: 10.1038/nature13311. [DOI] [PMC free article] [PubMed] [Google Scholar]
- 25.Wang CM, Wu QQ, Li SQ, Chen FJ, Tuo L, Xie HW, Tong YS, Ji L, Zhou GZ, Cao G, Wu M, Lv J, Shi WH, Cao XF. Upregulation of the long non-coding RNA PlncRNA-1 promotes esophageal squamous carcinoma cell proliferation and correlates with advanced clinical stage. Dig Dis Sci. 2014;59:591–597. doi: 10.1007/s10620-013-2956-7. [DOI] [PubMed] [Google Scholar]
- 26.Yang C, Li X, Wang Y, Zhao L, Chen W. Long non-coding RNA UCA1 regulated cell cycle distribution via CREB through PI3-K dependent pathway in bladder carcinoma cells. Gene. 2012;496:8–16. doi: 10.1016/j.gene.2012.01.012. [DOI] [PubMed] [Google Scholar]