

Abstract
The association of ADP-ribosylation factor-like 15 (ARL15) rs6450176 single nucleotide polymorphism (SNP) and serum lipid profiles has never been studied in the Chinese population. The present study was undertaken to detect the association of ARL15 rs6450176 SNP and several environmental factors with serum lipid levels in the Jing and Han populations. Genotypes of the SNP were determined in 726 unrelated subjects of Jing nationality and 726 participants of Han nationality. The genotypic and allelic frequencies of the SNP in Jing but not in Han were different between males and females (P < 0.001 and P < 0.05; respectively). The G allele carriers in Han had lower serum total cholesterol (TC), low-density lipoprotein cholesterol (LDL-C) and apolipoprotein (Apo) B levels, and higher ApoA1/ApoB ratio than the G allele non-carriers (P < 0.05-0.01). The G allele carriers in Jing had lower serum TC, high-density lipoprotein cholesterol (HDL-C), ApoA1, ApoB levels and higher ApoA1/ApoB ratio than the G allele non-carriers (P < 0.05 for all). Subgroup analyses showed that the G allele carriers had lower TC and LDL-C levels in Han males; lower LDL-C and ApoB levels in Han females; lower ApoB levels and ApoA1/ApoB ratio in Jing males; and lower LDL-C levels in Jing females than the G allele non-carriers (P < 0.05-0.01). Multiple linear regression analysis showed that serum TC, LDL-C, ApoB levels and the ApoA1/ApoB ratio in Han; and TC, HDL-C and ApoA1 levels in Jing were correlated with the genotypes of the ARL15 rs6450176 SNP (P < 0.05-0.001). Serum lipid parameters were also associated with several environmental factors in both ethnic groups. These findings indicated that there may be a racial/ethnic- and/or sex-specific association of the ARL15 rs6450176 SNP and serum lipid levels.
Keywords: ADP-ribosylation factor-like 15 gene, single nucleotide polymorphism, rs6450176, serum lipid level
Introduction
Cardiovascular diseases (CVD) are the leading causes of morbidity and mortality worldwide. Over decades, it has prospective epidemiological evidences that the most attributable and heritable risk factor for coronary artery disease (CAD) is the unfavorable serum lipid profile such as elevated serum levels of total cholesterol (TC) [1], triglyceride (TG) [2], low-density lipoprotein cholesterol (LDL-C) [3], and apolipoprotein (Apo) B [4], together with decreased levels of ApoA1 [4] and high-density lipoprotein cholesterol (HDL-C) [5]. Dyslipidemia is believed to be caused by various genetic and environmental factors [6], and their interactions [7]. Through family history and twin studies, it is known that almost 40%-70% of the interindividual variation in plasma lipid phenotypes can be explained by genetic polymorphisms [8,9].
More than 95 loci associated with serum lipid levels had been identified by genome-wide association (GWA) studies in recent years [10]. It is noticeable that a growing number of new loci involving in lipid metabolism have been identified through GWA studies. ADP-ribosylation factor-like 15 (ARL15) (http://www.ncbi.nlm.nih.gov/gene), a gene located on chromosome 5P15.2, is a member of ADP-ribosylation factor (ARF) subfamily. ARL has 40%-60% homologous sequences with the members of ARF which is a small G protein of Ras superfamily. ARL exists widely in eukaryotes and plays a substantial role in intracellular vesicle trafficking and signal transduction [11]. In 2009, Richards et al used GWA study to identify a single nucleotide polymorphism (SNP) located in the ARL15, rs4311394, which was associated with low adiponectin levels and type 2 diabetes (T2DM) in a European population [12]. Low plasma adiponectin levels have been associated with adiponectin-related diseases, such as T2DM, obesity, dyslipidemia, insulin resistance and CVD [11]. However, the effect of this rs6450176 SNP on serum lipid levels was not functionally validated and the mechanism was yet unclear. Furthermore, the reproducibility of this association has not been detected in the Chinese population so far.
China is a multiethnic country of 56 ethnic groups. Han is the largest ethnic group and Jing is the least populated minorities in south China among the 55 minority groups according to the population size of 28199 in 2010 (the sixth national census statistics of China). Most of them live in the so called “Three Islands of Jing Nationality”, Dongxing City, Guangxi Zhuang Autonomous Region, People’s Republic of China. The history of this minority can be traced back to the 1600s. Jing is the only Chinese minority for coastal fisheries, meanwhile is the only sea people in China. In this case, it has a lot of differences between Jing and Han (as well as the other landlocked nationalities) nationality in diet custom and culture characteristics. In previous studies, Lin et al. suggested that Jing ethnic population has an origin of Southeast Asia and is belonged to the southern group of Chinese populations [13]. To our knowledge, however, the association of ARL15 SNPs and serum lipid levels has not been previously reported in this population. Therefore, the aim of the present study was to explore the association of ARL15 rs6450176 SNP and several environmental factors with serum lipid profiles in the Jing and Han populations.
Materials and methods
Study population
A total of 726 unrelated subjects of Jing nationality comprising 376 males (51.79%) and 350 females (48.21%) and 726 unrelated participants of Han nationality including 374 men (51.52%) and 352 women (48.48%) were randomly selected from our previous stratified randomized samples. All of them were rural agricultural and/or fishery workers residing in Jiangping Down, Dongxing City, Guangxi Zhuang Autonomous Region, People’s Republic of China. The age range was from 15 to 80 years. The mean age of Jing participants was 57.87±13.33 years, whereas that of Han subjects was 58.29±13.14 years. All participants were essentially healthy and had no evidence of diseases related to atherosclerosis, CAD and diabetes. Any participant had a history of taking medications known to affect serum lipid levels (lipid-lowering drugs such as statins or fibrates, beta blockers, diuretics, or hormones) was excluded before the blood sample was taken. The study design was approved by the Ethics Committee of the First Affiliated Hospital, Guangxi Medical University. Informed consent was obtained from all participants.
Epidemiological survey
The survey was carried out using internationally standardized methods, following a common protocol [14]. Information on demographics, socioeconomic status, and lifestyle factors was collected with standardized questionnaires. The intake of alcohol was quantified as the number of liang (about 50 g) of rice wine, corn wine, rum, beer, or liquor consumed during the preceding 12 months. Alcohol consumption was categorized into groups of grams of alcohol per day: < 25 and ≥ 25. Smoking status was categorized into groups of cigarettes per day: < 20 and ≥ 20. In the physical examination, several parameters such as height, weight, and waist circumference were measured. Sitting blood pressure was measured three times with the use of a mercury sphygmomanometer after a 5-minute rest, and the average of the three measurements was recorded. Systolic blood pressure was determined by the first Korotkoff sound, and diastolic blood pressure by the fifth Korotkoff sound. Body weight, to the nearest 50 grams, was measured using a portable balance scale. Subjects were weighed in a minimum of clothing with shoes off. Height was measured, to the nearest 0.5 cm, using a stadiometer. From these two measurements body mass index (BMI, kg/m2) was calculated.
Biochemical measurements
A venous blood sample of 5 mL was obtained from all subjects after at least 12 hours of fasting. A two fifth of the sample (2 mL) was collected into glass tubes and used to determine serum lipid levels. The remaining three fifth of the sample (3 mL) was transferred to the tubes contained anticoagulants (4.80 g/L citric acid, 14.70 g/L glucose, and 13.20 g/L tri-sodium citrate) and was used to extract deoxyribonucleic acid (DNA). Measurements of serum TC, TG, HDL-C, and LDL-C levels in the samples were performed by enzymatic methods with commercially available kits (RANDOX Laboratories Ltd., Ardmore, Diamond Road, CrumlinCo. Antrim, United Kingdom, BT29 4QY; Daiichi Pure Chemicals Co., Ltd., Tokyo, Japan). Serum ApoA1 and ApoB levels were detected by the immunoturbidimetric immunoassay using a commercial kit (RANDOX Laboratories Ltd.). All determinations were performed with an autoanalyzer (Type 7170A; Hitachi Ltd., Tokyo, Japan) in the Clinical Science Experiment Center of the First Affiliated Hospital, Guangxi Medical University [15-17].
DNA amplification and genotyping
Genomic DNA was isolated from peripheral blood leukocytes using the phenol-chloroform method [15-17]. The extracted DNA was stored at 4°C until analysis. Genotyping of the ARL15 rs6450176 SNP was performed by polymerase chain reaction and restriction fragment length polymorphism (PCR-RFLP). PCR amplification was performed using 5’-TCGTGTTGGCCCATTTTAGG-3’ and 5’-CCCTTATGACACCTCCCCAA-3’ (Sangon, Shanghai, People’s Republic of China) as the forward and reverse primer pairs; respectively. Each amplification reaction was performed in a total volume of 25 μL, containing 10 × PCR buffer (1.8 mM MgCl2) 2.5 μL, 1 U Taq polymerase, 2.5 mmol/L of each dNTP (Tiangen, Beijing, People’s Republic of China) 2.0 μL, 20 pmol/L of each primer and 50 ng of genomic DNA, processing started with 95°C for 7 min and followed by 50 s of denaturing at 95°C, 45 s of annealing at 60°C and 1 min of elongation at 72°C for 33 cycles. The amplification was completed by a final extension at 72°C for 7 min. Then 10 U of Awl261 enzyme was added directly to the PCR products (10 μL) and digested at 37°C overnight. After restriction enzyme digestion of the amplified DNA, genotypes were identified by electrophoresis on 2% ethidium-bromide stained agarose gels and visualizing with ultraviolet illumination. Genotypes were scored by an experienced reader blinded to the epidemiological and lipid results. Six samples (AA, AG and GG genotypes in two; respectively) detected by the PCR-RFLP were also confirmed by direct sequencing. The PCR product was purified by low melting point gel electrophoresis and phenol extraction, and then the DNA sequences were analyzed in Shanghai Sangon Biological Engineering Technology & Services Co., Ltd., People’s Republic of China.
Diagnostic criteria
The normal values of serum TC, TG, HDL-C, LDL-C, ApoA1 and ApoB levels, and the ratio of ApoA1 to ApoB in our Clinical Science Experiment Center were 3.10-5.17, 0.56-1.70, 1.16-1.42, 2.70-3.10 mmol/L, 1.20-1.60, 0.80-1.05 g/L, and 1.00-2.50; respectively. The individuals with TC > 5.17 mmol/L and/or TG > 1.70 mmol/L were defined as hyperlipidemic [18]. Hypertension was diagnosed according to the criteria of 1999 World Health Organization-International Society of Hypertension Guidelines for the management of hypertension [19,20]. The diagnostic criteria of overweight and obesity were according to the Cooperative Meta-analysis Group of China Obesity Task Force. Normal weight, overweight and obesity were defined as a BMI < 24, 24-28, and > 28 kg/m2; respectively [21].
Statistical analyses
Epidemiological data were recorded on a pre-designed form and managed with Excel software. Data analysis was performed using the software SPSS version 16.0 (SPSS Inc., Chicago, Illinois). Quantitative variables were expressed as mean ± standard deviation (serum TG levels were presented as medians and interquartile ranges). Qualitative variables were expressed as percentages. Allele frequency was determined via direct counting, and the standard goodness-of-fit test was used to test the Hardy-Weinberg equilibrium. Difference in genotype distribution between the groups was obtained using the chi-square test. The difference in general characteristics between Jing and Han was tested by the Student’s unpaired t-test. The association of genotypes and serum lipid parameters was tested by analysis of covariance (ANCOVA). Sex, age, BMI, blood pressure, alcohol consumption, cigarette smoking were adjusted for the statistical analysis. Multivariate linear regression analysis with stepwise modeling was performed to evaluate the association of serum lipid levels with genotypes (AA = 1, AG = 2 and GG = 3) and several environment factors in the combined population of Jing and Han, Jing, Han, males and females; respectively. A P value of less than 0.05 was considered statistically significant.
Results
General characteristics and serum lipid levels
The general characteristics and serum lipid levels between the Han and Jing populations are summarized in Table 1. The percentages of smoking and alcohol consumption, LDL-C, ApoA1 and ApoB levels were higher in Han than in Jing (P < 0.05-0.001), whereas the levels of height, body weight, BMI, waist circumference, blood glucose, TC, TG were lower in Han than in Jing (P < 0.05-0.001). There were no significant differences in the gender ratio, age structure, systolic blood pressure, diastolic blood pressure, pulse pressure, serum HDL-C levels and the ApoA1/ApoB ratio between the two ethnic groups (P > 0.05 for all).
Table 1.
The general characteristics and serum lipid levels between Jing and Han Chinese
| Parameter | Han | Jing | t (x2) | P |
|---|---|---|---|---|
| Number | 726 | 726 | ||
| Male/female | 374/352 | 376/350 | 0.011 | 0.958 |
| Age (year) | 58.29±13.14 | 57.87±13.33 | -0.609 | 0.543 |
| Height (cm) | 157.27±8.26 | 158.30±7.92 | -2.431 | 0.015 |
| Weight (kg) | 56.93±9.69 | 58.94±9.93 | -3.903 | 0.000 |
| Body mass index (kg/m2) | 22.98±3.30 | 23.45±3.13 | -3.789 | 0.005 |
| Waist circumference (cm) | 78.25±9.10 | 80.33±9.09 | -4.347 | 0.000 |
| Cigarette smoking [n (%)] | ||||
| Non-smoker | 576 (79.34) | 642 (88.43) | ||
| < 20 cigarettes/day | 36 (4.96) | 18 (2.48) | ||
| ≥ 20 cigarettes/day | 114 (15.70) | 66 (9.09) | 22.376 | 0.000 |
| Alcohol consumption [n (%)] | ||||
| Non-drinker | 560 (77.13) | 619 (85.26) | ||
| ≥ 25 g/day | 112 (15.43) | 87 (11.98) | ||
| ≤ 25 g/day | 54 (7.44) | 20 (2.75) | 21.715 | 0.000 |
| Systolic BP (mmHg) | 134.47±55.96 | 131.95±21.96 | 1.128 | 0.259 |
| Diastolic BP (mmHg) | 81.37±10.60 | 80.36±10.53 | 1.831 | 0.067 |
| Pulse pressure (mmHg) | 53.02±54.24 | 51.45±17.83 | 0.742 | 0.458 |
| Glucose (mmol/L) | 6.59±1.05 | 6.89±1.67 | -4.118 | 0.000 |
| Total cholesterol (mmol/L) | 4.94±0.75 | 5.06±0.90 | -2.696 | 0.007 |
| Triglyceride (mmol/L) | 1.56 (0.90) | 1.69 (0.90) | -2.673 | 0.008 |
| HDL-C (mmol/L) | 1.81±0.56 | 1.77±0.45 | 1.753 | 0.080 |
| LDL-C (mmol/L) | 2.92±0.40 | 2.81±0.42 | 5.021 | 0.000 |
| Apolipoprotein (Apo) A1 (g/L) | 1.34±0.20 | 1.28±0.22 | 5.372 | 0.000 |
| ApoB (g/L) | 1.07±0.24 | 1.04±0.23 | 2.698 | 0.007 |
| ApoA1/ApoB | 1.31±0.36 | 1.29±3.38 | 0.919 | 0.358 |
HDL-C: high-density lipoprotein cholesterol; LDL-C: low-density lipoprotein cholesterol. The value of triglyceride was presented as median (interquartile range), the difference between the two ethnic groups was determined by the Wilcoxon-Mann-Whitney test.
Results of electrophoresis and genotyping
After the genomic DNA of the samples were amplified by 2% agarose gel electrophoresis, the products of 521 bp nucleotide sequences were found in all samples (Figure 1). The genotypes identified were named according to the presence (G allele) or absence (A allele) of the enzyme restriction sites. Thus GG genotype was homozygote for the presence of the sites (bands at 287- and 234-bp). AG genotype was heterozygote for the presence and absence of the site (bands at 521-, 287- and 234-bp), and AA genotype was homozygote for the absence of the site (bands at 521-bp; Figure 2). The genotypes of the rs6450176 SNP were followed by the Hardy-Weinberg equilibrium.
Figure 1.
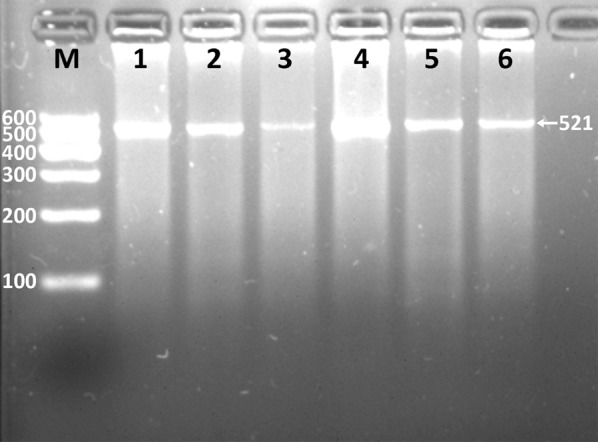
Electrophoresis of PCR products of the ARL15 rs6450176 SNP. Lane M, 100 bp marker ladder; lanes 1-6, PCR products (521 bp).
Figure 2.
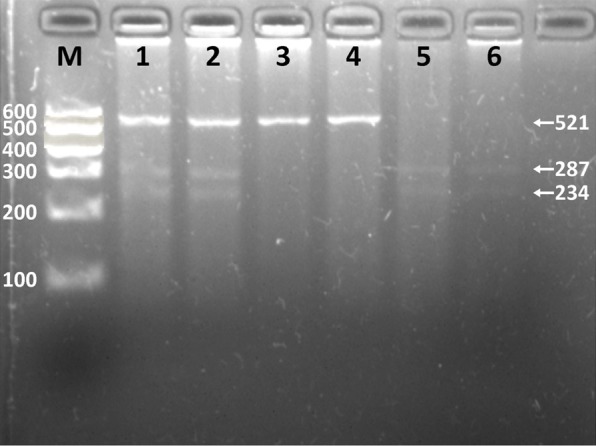
Genotyping of the ARL15 rs6450176 SNP. Lane M, 100 bp marker ladder; lanes 1 and 2, AG genotype (521-, 287-, and 234-bp); lanes 3 and 4, AA genotype (521-bp); lanes 5 and 6, GG genotype (287- and 234-bp).
Genotypic and allelic frequencies
The genotypic and allelic frequencies of ARL15 rs6450176 SNP are shown in Table 2. The frequencies of A and G alleles were 59.37% and 40.08% in Han, and 59.78% and 40.22% in Jing (P > 0.05), respectively. The genotypic and allelic frequencies of the SNP in Jing but not in Han were different between males and females (P < 0.001 and P < 0.05; respectively). There were no differences in the genotypic frequencies of the ARL15 rs6450176 SNP between Han and Jing, or between Han males and Han females.
Table 2.
Comparison of the genotype and allele frequencies of ARL15 rs6450176 SNP in the Han and Jing populations [n (%)]
| Group | n | Genotype | Allele | |||
|---|---|---|---|---|---|---|
|
|
||||||
| AA | AG | GG | A | G | ||
| Han | 726 | 275 (37.88) | 302 (41.60) | 139 (19.15) | 862 (59.37) | 582 (40.08) |
| Jing | 726 | 300 (41.32) | 308 (42.42) | 138 (19.01) | 868 (59.78) | 584 (40.22) |
| Χ2 | 0.534 | 0.002 | ||||
| P | 0.766 | 0.963 | ||||
| Han | ||||||
| Male | 374 | 150 (40.11) | 150 (40.11) | 74 (19.79) | 450 (60.16) | 290 (39.84) |
| Female | 352 | 125 (35.51) | 162 (46.02) | 65 (18.47) | 412 (58.52) | 292 (41.48) |
| Χ2 | 2.653 | 0.785 | ||||
| P | 0.265 | 0.376 | ||||
| Jing | ||||||
| Male | 376 | 186 (44.15) | 140 (37.23) | 70 (18.62) | 472 (62.77) | 280 (37.23) |
| Female | 350 | 114 (32.57) | 168 (48.00) | 68 (19.43) | 396 (56.57) | 304 (43.43) |
| Χ2 | 17.083 | 5.786 | ||||
| P | 0.000 | 0.016 | ||||
Results of sequencing
The results were shown as AA, AG and GG genotypes by PCR-RFLP, the AA, AG and GG genotypes were also confirmed by direct sequencing (Figure 3); respectively.
Figure 3.
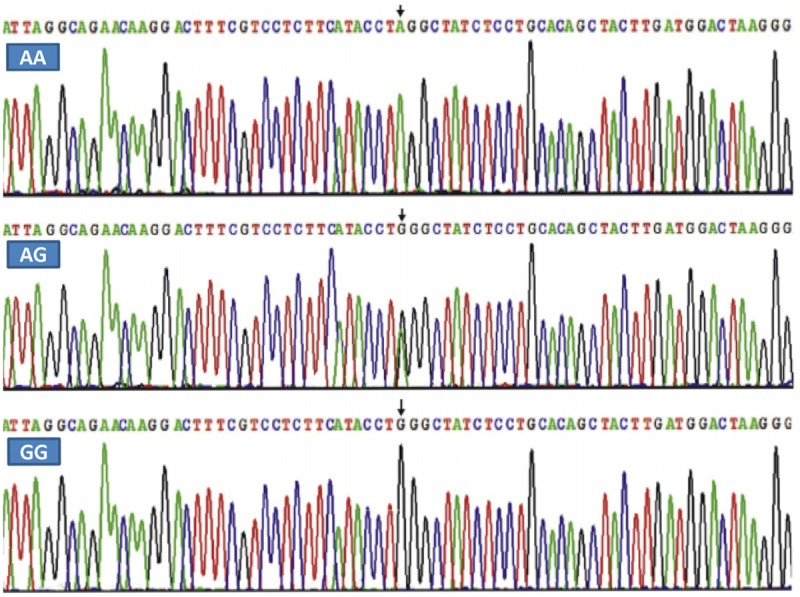
A part of the nucleotide sequence of the ARL15 rs6450176 SNP. AA: AA genotype; AG: AG genotype; and GG: GG genotype.
Genotypes and serum lipid levels
As shown in Table 3, serum TC, LDL-C, ApoB levels and the ApoA1/ApoB ratio in Han were different among the genotypes (P < 0.05-0.001). The G allele carriers had lower serum TC, LDL-C and ApoB levels, and higher ApoA1/ApoB ratio than the G allele non-carriers. Serum TC, HDL-C, ApoA1, ApoB levels and the ApoA1/ApoB ratio were different among the genotypes in Jing (P < 0.05 for all). The G allele carriers had lower serum TC, HDL-C, ApoA1, ApoB levels and higher ApoA1/ApoB ratio than the G allele non-carriers. Subgroup analyses showed that serum TC and LDL-C levels in Han males and LDL-C and ApoB levels in Han females were different among the genotypes (P < 0.05-0.01). The G allele carrier had lower serum TC, LDL-C and ApoB levels than the G allele non-carriers in Han males and females. In contrast, serum ApoB levels and ApoA1/ApoB ratio in Jing males and LDL-C levels in Jing females were different among the genotypes (P < 0.05-0.01). The G allele carriers had lower serum LDL-C and ApoB levels, and the ApoA1/ApoB ratio than the G allele non-carriers in Jing males and females (Table 4).
Table 3.
Comparison of the genotypes and serum lipid levels in the Han and Jing populations
| Genotype | N | TC (mmol/L) | TG (mmol/L) | HDL-C (mmol/L) | LDL-C (mmol/L) | ApoA1 (g/L) | ApoB (g/L) | ApoA1/ApoB |
|---|---|---|---|---|---|---|---|---|
| Han | ||||||||
| AA | 275 | 5.10±0.64 | 1.27 (0.62) | 1.86±0.48 | 3.01±0.36 | 1.35±0.22 | 1.12±0.23 | 1.26±0.34 |
| AG | 302 | 4.86±0.79 | 1.38 (0.67) | 1.80±0.52 | 2.88±0.43 | 1.34±0.18 | 1.06±0.24 | 1.34±0.36 |
| GG | 139 | 4.81±0.80 | 1.38 (0.81) | 1.75±0.73 | 2.86±0.42 | 1.31±0.19 | 1.05±0.25 | 1.33±0.38 |
| F | 11.787 | 2.607 | 1.596 | 10.841 | 1.883 | 6.141 | 4.288 | |
| P | 0.000 | 0.272 | 0.203 | 0.000 | 0.153 | 0.002 | 0.014 | |
| Jing | ||||||||
| AA | 300 | 5.14±0.89 | 1.40 (0.59) | 1.82±0.49 | 2.84±0.39 | 1.31±0.26 | 1.04±0.21 | 1.30±0.35 |
| AG | 308 | 5.08±0.92 | 1.44 (0.78) | 1.76±0.42 | 2.82±0.45 | 1.27±0.20 | 1.06±0.24 | 1.27±0.35 |
| GG | 138 | 4.87±0.95 | 1.44 (0.74) | 1.78±0.45 | 2.73±0.50 | 1.27±0.19 | 0.99±0.24 | 1.37±0.45 |
| F | 3.499 | 1.105 | 3.150 | 1.733 | 3.580 | 4.039 | 4.052 | |
| P | 0.031 | 0.332 | 0.043 | 0.178 | 0.028 | 0.018 | 0.018 |
TC: total cholesterol; TG: triglyceride; HDL-C: high-density lipoprotein cholesterol; LDL-C: low-density lipoprotein; ApoA1: apolipoprotein A1; ApoB: apolipoprotein B; ApoA1/ApoB: the ratio of apolipoprotein A1 to apolipoprotein B. The value of triglyceride was presented as median (interquartile range), the difference among the genotypes was determined by the Kruskal-Wallis test.
Table 4.
Comparison of the genotypes and serum lipid levels between males and females in the Han and Jing populations
| Ethnic/Genotype | N | TC (mmol/L) | TG (mmol/L) | HDL-C (mmol/L) | LDL-C (mmol/L) | ApoA1 (g/L) | ApoB (g/L) | ApoA1/ApoB |
|---|---|---|---|---|---|---|---|---|
| Han/male | ||||||||
| AA | 150 | 5.07±0.67 | 1.24 (0.53) | 1.79±0.54 | 2.97±0.35 | 1.32±0.22 | 1.09±0.22 | 1.27±0.37 |
| AG | 150 | 4.81±0.67 | 1.27 (0.77) | 1.75±0.58 | 2.91±0.38 | 1.36±0.20 | 1.07±0.22 | 1.32±0.31 |
| GG | 74 | 4.600 | 1.39 (0.88) | 1.59±0.67 | 2.73±0.39 | 1.31±0.19 | 1.04±0.25 | 1.35±0.41 |
| F | 6.075 | 0.147 | 1.605 | 5.419 | 1.132 | 0.927 | 0.985 | |
| P | 0.003 | 0.863 | 0.204 | 0.005 | 0.325 | 0.398 | 0.375 | |
| Han/female | ||||||||
| AA | 125 | 5.14±0.60 | 1.29 (0.65) | 1.95±0.40 | 3.03±0.36 | 1.36±0.21 | 1.12±0.23 | 1.26±0.32 |
| AG | 162 | 4.90±0.88 | 1.41 (0.61) | 1.84±0.47 | 2.86±0.45 | 1.33±0.18 | 1.05±0.26 | 1.34±0.38 |
| GG | 65 | 5.05±0.82 | 1.31 (0.78) | 1.93±0.75 | 2.94±0.42 | 1.31±0.20 | 1.05±0.25 | 1.32±0.36 |
| F | 2.402 | 1.376 | 2.030 | 4.605 | 1.873 | 3.201 | 1.518 | |
| P | 0.092 | 0.254 | 0.133 | 0.011 | 0.155 | 0.042 | 0.221 | |
| Jing/male | ||||||||
| AA | 186 | 5.04±0.85 | 1.33 (0.68) | 1.76±0.53 | 2.78±0.36 | 1.29±0.23 | 1.03±0.22 | 1.32±0.41 |
| AG | 140 | 5.12±0.82 | 1.59 (0.94) | 1.65±0.36 | 2.84±0.39 | 1.23±0.20 | 1.11±0.22 | 1.15±0.29 |
| GG | 70 | 4.94±0.84 | 1.81 (1.00) | 1.75±0.47 | 2.80±0.39 | 1.24±0.19 | 1.01±0.21 | 1.31±0.44 |
| F | 0.847 | 0.290 | 1.092 | 0.432 | 1.924 | 5.092 | 3.675 | |
| P | 0.430 | 0.748 | 0.338 | 0.650 | 0.149 | 0.007 | 0.027 | |
| Jing/female | ||||||||
| AA | 114 | 5.22±0.91 | 1.45 (0.50) | 1.87±0.44 | 2.87±0.40 | 1.32±0.29 | 1.05±0.21 | 1.29±0.31 |
| AG | 168 | 5.06±0.97 | 1.40 (0.74) | 1.80±0.43 | 2.87±0.47 | 1.29±0.20 | 1.03±0.25 | 1.32±0.37 |
| GG | 68 | 4.83±1.01 | 1.37 (0.58) | 1.79±0.44 | 2.67±0.55 | 1.28±0.19 | 0.98±0.26 | 1.40±0.45 |
| F | 2.963 | 0.130 | 1.292 | 3.246 | 0.887 | 2.208 | 1.959 | |
| P | 0.053 | 0.878 | 0.276 | 0.040 | 0.413 | 0.111 | 0.143 |
TC: total cholesterol; TG: triglyceride; HDL-C: high-density lipoprotein cholesterol; LDL-C: low-density lipoprotein cholesterol; ApoA1: apolipoprotein A1; ApoB: apolipoprotein B; ApoA1/ApoB: the ratio of apolipoprotein A1 to apolipoprotein B. The values of TG were presented as median (interquartile range), the difference among the genotypes was determined by the Kruskal-Wallis test.
Relative factors for serum lipid parameters
Multiple linear regression analysis showed that serum TC, HDL-C, LDL-C, ApoA1 and ApoB levels in the combined population of Han and Jing; TC, LDL-C, ApoB levels and the ApoA1/ApoB ratio in Han; and TC, HDL-C and ApoA1 levels in Jing were correlated with the genotypes of the ARL15 rs6450176 SNP (P < 0.05-0.001; Table 5). When the correlation of serum lipid parameters and the genotypes was analyzed according to sex, we showed that serum TC, HDL-C and LDL-C levels in Han males; ApoB levels in Han females; ApoA1 levels in Jing males; and TC and LDL-C levels in Jing females were correlated with the genotypes (P < 0.05-0.001; Table 6).
Table 5.
Relationship between serum lipid parameters and relative factors in the Han and Jing populations
| Lipid | Risk factor | B | Std.error | Beta | t | P |
|---|---|---|---|---|---|---|
| Han and Jing | ||||||
| TC | Age | 0.007 | 0.002 | 0.114 | 4.328 | 0.000 |
| Genotype | -0.129 | 0.029 | -0.114 | -4.444 | 0.000 | |
| Height | -0.010 | 0.003 | -0.102 | -3.762 | 0.000 | |
| Waist circumference | 0.007 | 0.002 | 0.074 | 2.760 | 0.006 | |
| Glucose | 0.134 | 0.015 | 0.227 | 8.855 | 0.000 | |
| Ethnic group | 0.111 | 0.043 | 0.067 | 2.586 | 0.010 | |
| TG | Waist circumference | 0.041 | 0.004 | 0.419 | 9.438 | 0.000 |
| Diastolic blood pressure | 0.008 | 0.002 | 0.098 | 3.828 | 0.000 | |
| Glucose | 0.122 | 0.017 | 0.189 | 7.314 | 0.000 | |
| Weight | -0.018 | 0.004 | -0.197 | -4.369 | 0.000 | |
| Alcohol consumption | 0.152 | 0.043 | 0.090 | 3.517 | 0.000 | |
| Age | -0.006 | 0.002 | -0.082 | -3.199 | 0.001 | |
| Ethnic group | 0.094 | 0.045 | 0.052 | 2.077 | 0.038 | |
| HDL-C | Waist circumference | -0.016 | 0.001 | -0.289 | -11.244 | 0.000 |
| Gender | 0.256 | 0.037 | 0.252 | 6.966 | 0.000 | |
| Alcohol consumption | 0.143 | 0.027 | 0.149 | 5.341 | 0.000 | |
| Cigarette smoking | -0.044 | 0.013 | -0.089 | -3.433 | 0.001 | |
| Height | 0.009 | 0.002 | 0.150 | 4.155 | 0.000 | |
| Genotype | -0.049 | 0.017 | -0.070 | -2.817 | 0.005 | |
| Age | 0.003 | 0.001 | 0.070 | 2.558 | 0.011 | |
| LDL-C | Ethnic group | -0.112 | 0.022 | -0.135 | -5.197 | 0.000 |
| Age | 0.003 | 0.001 | 0.089 | 3.347 | 0.001 | |
| Glucose | 0.037 | 0.008 | 0.125 | 4.813 | 0.000 | |
| Genotype | -0.059 | 0.015 | -0.103 | -4.017 | 0.000 | |
| Diastolic blood pressure | 0.002 | 0.001 | 0.058 | 2.176 | 0.030 | |
| Waist circumference | 0.003 | 0.001 | 0.069 | 2.532 | 0.011 | |
| Height | -0.003 | 0.001 | -0.061 | -2.248 | 0.025 | |
| ApoA1 | Waist circumference | -0.004 | 0.001 | -0.177 | -6.872 | 0.000 |
| Glucose | -0.010 | 0.004 | -0.069 | -2.620 | 0.009 | |
| Alcohol consumption | 0.074 | 0.011 | 0.184 | 6.428 | 0.000 | |
| Ethnic group | -0.043 | 0.011 | -0.101 | -3.907 | 0.000 | |
| Gender | 0.042 | 0.012 | 0.099 | 3.546 | 0.000 | |
| Genotype | -0.022 | 0.007 | -0.075 | -2.942 | 0.003 | |
| Cigarette smoking | -0.013 | 0.005 | -0.063 | -2.365 | 0.018 | |
| Systolic blood pressure | 0.000 | 0.000 | 0.059 | 2.337 | 0.020 | |
| ApoB | Waist circumference | 0.006 | 0.001 | 0.230 | 9.002 | 0.000 |
| Glucose | 0.012 | 0.004 | 0.074 | 2.839 | 0.005 | |
| Ethnic group | -0.047 | 0.012 | -0.100 | -3.912 | 0.000 | |
| Age | 0.002 | 0.000 | 0.095 | 3.728 | 0.000 | |
| Genotype | -0.023 | 0.008 | -0.073 | -2.883 | 0.004 | |
| ApoA1/ApoB | Waist circumference | -0.009 | 0.002 | -0.218 | -4.907 | 0.000 |
| Glucose | -0.029 | 0.007 | -0.110 | -4.222 | 0.000 | |
| Age | -0.003 | 0.001 | -0.097 | -3.779 | 0.000 | |
| Alcohol consumption | 0.060 | 0.018 | 0.088 | 3.440 | 0.001 | |
| Weight | -0.003 | 0.002 | -0.093 | -2.039 | 0.042 | |
| Han | ||||||
| TC | Genotype | -0.169 | 0.037 | -0.165 | -4.617 | 0.000 |
| Height | -0.019 | 0.004 | -0.215 | -5.292 | 0.000 | |
| Glucose | 0.197 | 0.027 | 0.263 | 7.218 | 0.000 | |
| Systolic blood pressure | 0.001 | 0.000 | 0.110 | 3.071 | 0.002 | |
| Waist circumference | 0.026 | 0.006 | 0.322 | 4.202 | 0.000 | |
| Body mass index | -0.061 | 0.017 | -0.269 | -3.566 | 0.000 | |
| TG | Waist circumference | 0.050 | 0.006 | 0.509 | 7.948 | 0.000 |
| Cigarette smoking | 0.201 | 0.045 | 0.166 | 4.471 | 0.000 | |
| Glucose | 0.169 | 0.031 | 0.202 | 5.471 | 0.000 | |
| Weight | -0.028 | 0.006 | -0.300 | -4.594 | 0.000 | |
| Diastolic blood pressure | 0.011 | 0.003 | 0.125 | 3.492 | 0.001 | |
| Age | -0.007 | 0.002 | -0.103 | -2.884 | 0.004 | |
| HDL-C | Waist circumference | -0.017 | 0.002 | -0.271 | -7.327 | 0.000 |
| Cigarette smoking | -0.120 | 0.032 | -0.159 | -3.687 | 0.000 | |
| Diastolic blood pressure | 0.004 | 0.002 | 0.083 | 2.310 | 0.021 | |
| Gender | 0.244 | 0.056 | 0.219 | 4.336 | 0.000 | |
| Height | 0.012 | 0.003 | 0.179 | 3.720 | 0.000 | |
| Alcohol consumption | 0.098 | 0.040 | 0.105 | 2.462 | 0.014 | |
| LDL-C | Genotype | -0.089 | 0.020 | -0.163 | -4.497 | 0.000 |
| Glucose | 0.088 | 0.015 | 0.219 | 5.940 | 0.000 | |
| Diastolic blood pressure | 0.003 | 0.001 | 0.085 | 2.267 | 0.024 | |
| Height | -0.005 | 0.002 | -0.097 | -2.675 | 0.008 | |
| Systolic blood pressure | 0.001 | 0.000 | 0.077 | 2.054 | 0.040 | |
| ApoA1 | Body mass index | -0.011 | 0.002 | -0.184 | -5.112 | 0.000 |
| Alcohol consumption | 0.067 | 0.013 | 0.203 | 5.006 | 0.000 | |
| Gender | 0.047 | 0.016 | 0.119 | 2.920 | 0.004 | |
| ApoB | Waist circumference | 0.010 | 0.002 | 0.390 | 6.213 | 0.000 |
| Glucose | 0.023 | 0.009 | 0.094 | 2.505 | 0.012 | |
| Genotype | -0.039 | 0.012 | -0.119 | -3.323 | 0.001 | |
| Weight | -0.005 | 0.002 | -0.193 | -3.081 | 0.002 | |
| ApoA1/ApoB | Waist circumference | -0.013 | 0.001 | -0.321 | -8.964 | 0.000 |
| Glucose | -0.042 | 0.013 | -0.116 | -3.097 | 0.002 | |
| Genotype | 0.046 | 0.017 | 0.095 | 2.699 | 0.007 | |
| Height | 0.004 | 0.002 | 0.084 | 2.334 | 0.020 | |
| Jing | ||||||
| TC | Age | 0.014 | 0.003 | 0.202 | 5.066 | 0.000 |
| Cigarette smoking | 0.188 | 0.054 | 0.123 | 3.456 | 0.001 | |
| Glucose | 0.126 | 0.022 | 0.213 | 5.699 | 0.000 | |
| Body mass index | 0.031 | 0.010 | 0.108 | 3.003 | 0.003 | |
| Pulse pressure | -0.006 | 0.002 | -0.115 | -2.881 | 0.004 | |
| Alcohol consumption | 0.232 | 0.075 | 0.115 | 3.111 | 0.002 | |
| Height | -0.012 | 0.004 | -0.104 | -2.712 | 0.007 | |
| Genotype | -0.105 | 0.044 | -0.086 | -2.406 | 0.016 | |
| TG | Waist circumference | 0.027 | 0.004 | 0.272 | 7.390 | 0.000 |
| Glucose | 0.121 | 0.022 | 0.207 | 5.531 | 0.000 | |
| Diastolic blood pressure | 0.007 | 0.003 | 0.079 | 2.134 | 0.033 | |
| HDL-C | Waist circumference | -0.016 | 0.002 | -0.324 | -9.344 | 0.000 |
| Alcohol consumption | 0.226 | 0.037 | 0.221 | 6.038 | 0.000 | |
| Gender | 0.137 | 0.034 | 0.151 | 4.095 | 0.000 | |
| Genotype | -0.044 | 0.021 | -0.071 | -2.045 | 0.041 | |
| LDL-C | Age | 0.004 | 0.001 | 0.130 | 3.519 | 0.000 |
| Glucose | 0.028 | 0.011 | 0.101 | 2.649 | 0.008 | |
| Body mass index | 0.013 | 0.005 | 0.099 | 2.700 | 0.007 | |
| ApoA1 | Weight | -0.004 | 0.001 | -0.182 | -4.955 | 0.000 |
| Alcohol consumption | 0.046 | 0.018 | 0.092 | 2.487 | 0.013 | |
| Genotype | -0.027 | 0.011 | -0.089 | -2.435 | 0.015 | |
| ApoB | Waist circumference | 0.003 | 0.002 | 0.125 | 2.053 | 0.040 |
| Age | 0.002 | 0.001 | 0.106 | 2.947 | 0.003 | |
| Body mass index | 0.009 | 0.004 | 0.128 | 2.101 | 0.036 | |
| ApoA1/ApoB | Waist circumference | -0.005 | 0.003 | -0.124 | -1.987 | 0.047 |
| Age | -0.004 | 0.001 | -0.128 | -3.490 | 0.001 | |
| Weight | -0.007 | 0.002 | -0.192 | -3.039 | 0.002 | |
| Alcohol consumption | 0.079 | 0.030 | 0.093 | 2.605 | 0.009 |
TC: total cholesterol; TG: triglyceride; HDL-C: high-density lipoprotein cholesterol; LDL-C: low-density lipoprotein cholesterol; ApoA1: apolipoprotein A1; ApoB: apolipoprotein B; ApoA1/ApoB: the ratio of apolipoprotein A1 to apolipoprotein B.
Table 6.
Relationship between serum lipid parameters and relative factors in the males and females of the Han and Jing populations
| Lipid | Risk factor | B | Std.error | Beta | t | P |
|---|---|---|---|---|---|---|
| Han/male | ||||||
| TC | Genotype | -0.247 | 0.047 | -0.263 | -5.315 | 0.000 |
| Glucose | 0.188 | 0.033 | 0.291 | 5.762 | 0.000 | |
| Systolic blood pressure | 0.001 | 0.000 | 0.141 | 2.854 | 0.005 | |
| Waist circumference | 0.008 | 0.004 | 0.097 | 1.968 | 0.050 | |
| TG | Waist circumference | 0.058 | 0.011 | 0.521 | 5.333 | 0.000 |
| Cigarette smoking | 0.209 | 0.053 | 0.200 | 3.955 | 0.000 | |
| Glucose | 0.160 | 0.039 | 0.214 | 4.137 | 0.000 | |
| Diastolic blood pressure | 0.019 | 0.004 | 0.211 | 4.394 | 0.000 | |
| Body mass index | -0.099 | 0.031 | -0.306 | -3.198 | 0.002 | |
| Age | -0.011 | 0.004 | -0.156 | -2.871 | 0.004 | |
| Height | -0.022 | 0.009 | -0.132 | -2.347 | 0.019 | |
| HDL-C | Waist circumference | -0.020 | 0.004 | -0.286 | -5.527 | 0.000 |
| Height | 0.016 | 0.005 | 0.162 | 3.152 | 0.002 | |
| Cigarette smoking | -0.120 | 0.035 | -0.186 | -3.429 | 0.001 | |
| Diastolic blood pressure | 0.005 | 0.003 | 0.097 | 1.911 | 0.057 | |
| Alcohol consumption | 0.099 | 0.044 | 0.122 | 2.256 | 0.025 | |
| Genotype | -0.081 | 0.039 | -0.103 | -2.071 | 0.039 | |
| LDL-C | Genotype | -0.115 | 0.025 | -0.228 | -4.529 | 0.000 |
| Glucose | 0.085 | 0.018 | 0.245 | 4.791 | 0.000 | |
| Waist circumference | 0.005 | 0.002 | 0.117 | 2.321 | 0.021 | |
| ApoA1 | Waist circumference | -0.007 | 0.001 | -0.317 | -6.524 | 0.000 |
| Alcohol consumption | 0.085 | 0.014 | 0.312 | 6.041 | 0.000 | |
| Cigarette smoking | -0.024 | 0.011 | -0.111 | -2.146 | 0.033 | |
| ApoB | Waist circumference | 0.006 | 0.001 | 0.238 | 4.707 | 0.000 |
| Glucose | 0.025 | 0.011 | 0.119 | 2.273 | 0.024 | |
| Diastolic blood pressure | 0.002 | 0.001 | 0.107 | 2.120 | 0.035 | |
| ApoA1/ApoB | Waist circumference | -0.016 | 0.002 | -0.373 | -7.726 | 0.000 |
| Glucose | -0.035 | 0.017 | -0.107 | -2.029 | 0.043 | |
| Alcohol consumption | 0.056 | 0.024 | 0.113 | 2.347 | 0.019 | |
| Han/Female | ||||||
| TC | Height | -0.016 | 0.006 | -0.138 | -2.611 | 0.009 |
| Glucose | 0.213 | 0.046 | 0.243 | 4.617 | 0.000 | |
| TG | Waist circumference | 0.028 | 0.004 | 0.325 | 6.415 | 0.000 |
| Glucose | 0.184 | 0.050 | 0.194 | 3.659 | 0.000 | |
| HDL-C | Body mass index | -0.039 | 0.007 | -0.277 | -5.395 | 0.000 |
| LDL-C | Age | 0.007 | 0.002 | 0.207 | 3.946 | 0.000 |
| Glucose | 0.093 | 0.025 | 0.196 | 3.692 | 0.000 | |
| ApoA1 | Body mass index | -0.008 | 0.003 | -0.147 | -2.778 | 0.006 |
| ApoB | Age | 0.003 | 0.001 | 0.158 | 2.981 | 0.003 |
| Waist circumference | 0.013 | 0.003 | 0.480 | 4.498 | 0.000 | |
| Genotype | -0.052 | 0.018 | -0.149 | -2.909 | 0.004 | |
| Weight | -0.008 | 0.003 | -0.309 | -2.865 | 0.004 | |
| ApoA1/ApoB | Body mass index | -0.024 | 0.005 | -0.251 | -4.923 | 0.000 |
| Glucose | -0.052 | 0.021 | -0.130 | -2.415 | 0.016 | |
| Age | -0.005 | 0.001 | -0.180 | -3.528 | 0.000 | |
| Jing/male | ||||||
| TC | Cigarette smoking | 0.225 | 0.068 | 0.164 | 3.326 | 0.001 |
| Age | 0.014 | 0.003 | 0.238 | 4.334 | 0.000 | |
| Glucose | 0.076 | 0.027 | 0.147 | 2.766 | 0.006 | |
| Pulse pressure | -0.010 | 0.003 | -0.206 | -3.745 | 0.000 | |
| Alcohol consumption | 0.251 | 0.072 | 0.173 | 3.489 | 0.001 | |
| Body mass index | 0.086 | 0.025 | 0.312 | 3.368 | 0.001 | |
| Waist circumference | -0.017 | 0.008 | -0.198 | -2.153 | 0.032 | |
| TG | Waist circumference | 0.037 | 0.005 | 0.359 | 7.091 | 0.000 |
| Age | -0.014 | 0.004 | -0.201 | -3.819 | 0.000 | |
| Glucose | 0.151 | 0.031 | 0.251 | 4.841 | 0.000 | |
| Height | -0.028 | 0.008 | -0.189 | -3.436 | 0.001 | |
| HDL-C | Waist circumference | -0.024 | 0.004 | -0.497 | -5.633 | 0.000 |
| Alcohol consumption | 0.246 | 0.039 | 0.303 | 6.317 | 0.000 | |
| Body mass index | 0.031 | 0.014 | 0.201 | 2.283 | 0.023 | |
| LDL-C | Body mass index | 0.017 | 0.006 | 0.136 | 2.646 | 0.008 |
| ApoA1 | Weight | -0.004 | 0.001 | -0.188 | -3.759 | 0.000 |
| Alcohol consumption | 0.062 | 0.019 | 0.166 | 3.297 | 0.001 | |
| Genotype | -0.036 | 0.014 | -0.128 | -2.536 | 0.012 | |
| ApoB | Body mass index | 0.021 | 0.004 | 0.294 | 5.922 | 0.000 |
| ApoA1/ApoB | Weight | -0.014 | 0.002 | -0.356 | -7.184 | 0.000 |
| Age | -0.004 | 0.001 | -0.152 | -3.059 | 0.002 | |
| Alcohol consumption | 0.080 | 0.032 | 0.120 | 2.478 | 0.014 | |
| Jing/female | ||||||
| TC | Age | 0.018 | 0.004 | 0.233 | 4.509 | 0.000 |
| Glucose | 0.200 | 0.036 | 0.291 | 5.522 | 0.000 | |
| Genotype | -0.183 | 0.070 | -0.135 | -2.603 | 0.010 | |
| TG | Waist circumference | 0.025 | 0.005 | 0.276 | 5.239 | 0.000 |
| Glucose | 0.072 | 0.030 | 0.131 | 2.396 | 0.017 | |
| Height | -0.025 | 0.007 | -0.187 | -3.561 | 0.000 | |
| HDL-C | Waist circumference | -0.017 | 0.003 | -0.316 | -6.222 | 0.000 |
| LDL-C | Age | 0.008 | 0.002 | 0.205 | 3.937 | 0.000 |
| Glucose | 0.059 | 0.018 | 0.176 | 3.251 | 0.001 | |
| Genotype | -0.086 | 0.034 | -0.130 | -2.490 | 0.013 | |
| ApoA1 | Body mass index | -0.010 | 0.004 | -0.146 | -2.744 | 0.006 |
| ApoB | Systolic blood pressure | 0.002 | 0.001 | 0.150 | 2.804 | 0.005 |
| Body mass index | 0.010 | 0.004 | 0.138 | 2.590 | 0.010 | |
| ApoA1/ApoB | Body mass index | -0.024 | 0.006 | -0.214 | -4.079 | 0.000 |
TC: total cholesterol; TG: triglyceride; HDL-C: high-density lipoprotein cholesterol; LDL-C: low-density lipoprotein cholesterol; ApoA1: apolipoprotein A1; ApoB: apolipoprotein B; ApoA1/ApoB: the ratio of apolipoprotein A1 to apolipoprotein B.
Serum lipid parameters were also associated with age, gender, BMI, systolic and diastolic blood pressure, pulse pressure, fasting blood glucose levels, cigarette smoking and alcohol consumption in both ethnic groups or in males and females (P < 0.05-0.001; Tables 5 and 6).
Discussion
In the present study, we showed that the levels of TC and TG were higher and LDL-C, ApoA1 and ApoB were lower in Jing than in Han. There were no significant differences in the levels of HDL-C and the ratio of ApoA1 to ApoB between the two ethnic groups. These differences in serum lipid profiles between the two ethnic groups may result from the combined action of genetic, environmental factors and their interactions [23]. Jing is the only Chinese minority for coastal fisheries, meanwhile is the only sea people in China. In this case, it has a very special lifestyle and dietary habits compared with the other landlocked nationalities. Their marriages were family-arranged in the old days when they sing antiphonal songs to look for the other half. After antiphonal singing, if the boy’s into the girl he would kick sand toward her while approaching her. If the girl feel the same she would kick back, which means engagement. While the formal engagement ceremony and wedding they need pork, cake, tea, wine, glutinous rice as gifts. Jing stays endogamy, intermarriage with Han or Zhuang people is seldom happened. Jing people don’t get married with someone sharing the same last name, also cross-cousin marriage is strictly forbidden. This kind of breeding with exclusive indicates that some hereditary characteristics and genotypes of lipid metabolism-related genes in this population may be different from those in Han people.
The frequency spectrum of ARL15 rs6450176 mutation varied significantly among different races/ethnicities. According to the Hap Map data, the minor allele G frequency of the SNP was 47.7% in Chinese, 54.1% in Japanese, 66.8% in Yoruba, 66.1% in Kenya, 66.1% in Mexican and 73.9% in European population, 73.3% in Italy. In the current study, we showed that the frequencies of AA, AG, GG genotypes were 37.88%, 41.60% and 19.15% in Han, and 41.32%, 42.42% and 19.01% in Jing (P > 0.05); respectively. The frequency of the ARL15 rs6450176G allele was 40.08% in Han, and 40.22% in Jing (P > 0.05), which was lower than that in the Beijing Chinese samples. This difference may result from different sample sizes and regions (Beijing vs. Guangxi). In the present study, however, we noted that the genotypic and allelic frequencies of the SNP in Jing but not in Han were different between males and females. The frequency of the ARL15 rs6450176G allele was higher in Jing females than in Jing males (43.43% vs. 37.23%, P < 0.05). These findings may also partly explain why the prevalence of CVD is lower in females than in males in some ethnic groups.
There were only a few previous studies presented the direct relationship between the ARL15 rs6450176 SNP and serum lipid levels in humans. The ARL15 rs6450176 SNP was significant associated with HDL-C (P = 5 × 10⁻⁸) [22] and T2DM (P = 5.8 × 10⁻⁸) in European Populations [24]. In the present study, we showed that the G allele carriers in Han had lower serum TC, LDL-C and ApoB levels, and higher ApoA1/ApoB ratio than the G allele non-carriers. The G allele carriers in Jing had lower serum TC, HDL-C, ApoA1, ApoB levels and higher ApoA1/ApoB ratio than the G allele non-carriers. Subgroup analyses showed that the G allele carriers had lower serum TC and LDL-C levels in Han males and LDL-C and ApoB levels in Han females than the G allele non-carriers. In contrast, the G allele carriers had lower serum ApoB levels and ApoA1/ApoB ratio in Jing males and LDL-C levels in Jing females than the G allele non-carriers. These findings indicated that the association of ARL15 rs6450176 SNP and serum lipid levels may have racial/ethnic and/or sex specificity. As far as we know, our study is the first replication of GWA study signals about the association of ARL15 rs6450176 SNP with serum lipid levels in the Chinese population. Therefore, further studies with larger sample size are still needed to confirm this association.
It is well realized that environmental factors such as dietary patterns, lifestyle and physical inactivity are all strongly correlated with serum lipid levels [25]. In the present study, multivariate linear regression analysis also showed that age, sex, BMI, waist circumference, alcohol consumption, cigarette smoking, and blood pressure were involved in determining serum lipid parameters in both ethnic groups. These data suggest that the environmental factors also play an important role in determining serum lipid levels in our study populations. When talking about diet pattern, rice is Jing people’s staple food supplemented with corn, sweet potato, taro and other grains. They prefer glutinous rice and seafood like fish, shrimp, crabs, shellfish and sandworm. Also pigs, chickens and ducks are the main sources of meat. Jing people prefer sweet food such as sweet glutinous rice porridge, mung bean syrup, because they believe sweet food is a symbol for happiness. This preference of sugariness may be related to the higher glucose level in Jing than in Han people. A kind of fish sauce called nuoc-mam is also popular on Jing people’s dinner table, which contains 17 amino acids (8 essential amino acids included of course) [26]. Diet alone could be responsible for up to 2.5% of the variability on serum lipid levels [27]. A meta-analysis stated that diet modification is a key strategy for prevention and regression of CAD, and for every 1% decrease in energy consumed as dietary saturated fatty acid, TC decreased by 0.056 mmol/L and LDL-C by 0.05 mmol/L [28]. It is well accepted that some specific dietary patterns, say the Mediterranean diet, are strongly related with favorable blood lipid profiles, also with the prevalence of dyslipidemia [29]. Jing nationality, as the only Chinese minority for coastal fisheries, has a diet pattern which is very similar with the Mediterranean diet. High intake of sea fish and other seafood indicates low content of saturated fatty acids and high content of composite carbohydrates and dietary fiber [30].
In addition, we found that the percentages of smokers were higher in Han than in Jing nationalities (P < 0.001). Over the years, the relationship between cigarette smoking and dyslipidemia has been gotten in focus by more and more investigators. A recent study in smoking males (ages from 25 to 35 years old) has found that a significant increase in TC and LDL-C in tobacco users [31,32]. Also another recent meta-analysis also reported that smoking increased TG by 0.15 mmol/L, and decreased HDL-C by 0.09 mmol/L with every 20 cigarettes smoked [33]. In the present study, we also noticed that the percentages of alcohol consumption were higher in Han than in Jing nationalities (P < 0.001). Many studies showed that moderate alcohol intake has been associated with reduced cardiovascular events, which is also an important component of Mediterranean diet [30,34]. The beneficial effects of alcohol on CVD have been ascribed to the increase in HDL-C and ApoA1 levels [35]. However, alcohol can be addictive, and high intake of alcohol can be associated with serious problems health including hypertension, hypertriglyceridemia, and liver damage [36]. Like any other source of carbohydrates, alcohol can increase plasma TG levels and can serve as a source of excess calories [37]. It was reported that the alcohol intake of 60 g/day increases the TG levels by about 0.19 mg/dL per 1 gram of alcohol consumed [38]. Onat et al. [39] also showed that alcohol consumption was robustly positively associated with TG, LDL-C, and ApoB in men and negatively correlated with TG and/or not correlated with LDL-C and ApoB in women. Nevertheless, another research indicated that the effects of alcohol consumption on LDL-C appear to vary by specific patient types or patterns of alcohol intake, and sex as well as genetic variants [40]. Consequently, the joint effects of different dietary habits, lifestyles, and environmental factors probably further modify the association of genetic variations and serum lipid levels in our study populations.
There are several potential limitations in our study. First, we were not able to alleviate the effect of diet during the statistical analysis since the diet intake was self-reported and difficult to classify. Second, we only measured serum TC, TG, HDL-C, LDL-C, ApoA1, ApoB levels, and the ratio of ApoA1 to ApoB and detected their associations with the ARL15 rs6450176 SNP without comprehensive measurements of the subclasses lipoproteins such as HDL2, HDL3, small dense LDL, and large buoyant LDL. However, serum TC, HDL-C, and LDL-C are the most important indicators for dyslipidemia and are also the phenotypes of clinical routine testing. We believed that the ARL15 rs6450176 SNP associated with these lipid parameters may add predictive information for the development of dyslipidemia and CVD. Third, although we observe significant association of the ARL15 rs6450176 SNP and serum lipid levels, there are still many unmeasured environmental and genetic factors that needed to be considered. The interactions of gene-gene, gene-environment, and environment-environment on serum lipid levels are remained to be determined. Moreover, we recognized the limited power to provide a more significant advance in understanding the full impact of the ARL15 rs6450176 SNP on lipoprotein metabolism. The association of the rs6450176 SNP, ARL15 expression in adipose tissue and plasma lipid levels should be detected in further investigations.
In conclusion, this study showed that the associations of the ARL15 rs6450176 SNP and serum lipid levels were different between the Jing and Han populations and between males and females in the both ethnic groups. There may be a racial/ethnic- and/or sex-specific association of the ARL15 rs6450176 SNP and serum lipid levels.
Acknowledgements
This study was supported by the National Natural Science Foundation of China (No: 81160111).
Disclosure of conflict of interest
None.
References
- 1.Shekelle RB, Shryock AM, Paul O, Lepper M, Stamler J, Liu S, Raynor WJ Jr. Diet, serum cholesterol, and death from coronary heart disease. The Western Electric study. N Engl J Med. 1981;304:65–70. doi: 10.1056/NEJM198101083040201. [DOI] [PubMed] [Google Scholar]
- 2.Criqui MH, Heiss G, Cohn R, Cowan LD, Suchindran CM, Bangdiwala S, Kritchevsky S, Jacobs DR Jr, O’Grady HK, Davis CE. Plasma triglyceride level and mortality from coronary heart disease. N Engl J Med. 1993;328:1220–1225. doi: 10.1056/NEJM199304293281702. [DOI] [PubMed] [Google Scholar]
- 3.Crouse JR, Parks JS, Schey HM, Kahl FR. Studies of low density lipoprotein molecular weight in human beings with coronary artery disease. J Lipid Res. 1985;26:566–574. [PubMed] [Google Scholar]
- 4.Kwiterovich PO Jr, Coresh J, Smith HH, Bachorik PS, Derby CA, Pearson TA. Comparison of the plasma levels of apolipoproteins B and A-1, and other risk factors in men and women with premature coronary artery disease. Am J Cardiol. 1992;69:1015–1021. doi: 10.1016/0002-9149(92)90856-t. [DOI] [PubMed] [Google Scholar]
- 5.Silbernagel G, Schottker B, Appelbaum S, Scharnagl H, Kleber ME, Grammer TB, Ritsch A, Mons U, Holleczek B, Goliasch G, Niessner A, Boehm BO, Schnabel RB, Brenner H, Blankenberg S, Landmesser U, Marz W. High-density lipoprotein cholesterol, coronary artery disease, and cardiovascular mortality. Eur Heart J. 2013;34:3563–3571. doi: 10.1093/eurheartj/eht343. [DOI] [PubMed] [Google Scholar]
- 6.Yip AG, Ma Q, Wilcox M, Panhuysen CI, Farrell J, Farrer LA, Wyszynski DF. Search for genetic factors predisposing to atherogenic dyslipidemia. BMC Genet. 2003;4:S100. doi: 10.1186/1471-2156-4-S1-S100. [DOI] [PMC free article] [PubMed] [Google Scholar]
- 7.Yin RX, Li YY, Liu WY, Zhang L, Wu JZ. Interactions of the apolipoprotein A5 gene polymorphisms and alcohol consumption on serum lipid levels. PLoS One. 2011;6:e17954. doi: 10.1371/journal.pone.0017954. [DOI] [PMC free article] [PubMed] [Google Scholar]
- 8.Heller DA, de Faire U, Pedersen NL, Dahlen G, McClearn GE. Genetic and environmental influences on serum lipid levels in twins. N Engl J Med. 1993;328:1150–1156. doi: 10.1056/NEJM199304223281603. [DOI] [PubMed] [Google Scholar]
- 9.Perusse L, Rice T, Despres JP, Bergeron J, Province MA, Gagnon J, Leon AS, Rao DC, Skinner JS, Wilmore JH, Bouchard C. Familial resemblance of plasma lipids, lipoproteins and postheparin lipoprotein and hepatic lipases in the HERITAGE Family Study. Arterioscler Thromb Vasc Biol. 1997;17:3263–3269. doi: 10.1161/01.atv.17.11.3263. [DOI] [PubMed] [Google Scholar]
- 10.Teslovich TM, Musunuru K, Smith AV, Edmondson AC, Stylianou IM, Koseki M, Pirruccello JP, Ripatti S, Chasman DI, Willer CJ, Johansen CT, Fouchier SW, Isaacs A, Peloso GM, Barbalic M, Ricketts SL, Bis JC, Aulchenko YS, Thorleifsson G, Feitosa MF, Chambers J, Orho-Melander M, Melander O, Johnson T, Li X, Guo X, Li M, Shin Cho Y, Jin Go M, Jin Kim Y, Lee JY, Park T, Kim K, Sim X, Twee-Hee Ong R, Croteau-Chonka DC, Lange LA, Smith JD, Song K, Hua Zhao J, Yuan X, Luan J, Lamina C, Ziegler A, Zhang W, Zee RY, Wright AF, Witteman JC, Wilson JF, Willemsen G, Wichmann HE, Whitfield JB, Waterworth DM, Wareham NJ, Waeber G, Vollenweider P, Voight BF, Vitart V, Uitterlinden AG, Uda M, Tuomilehto J, Thompson JR, Tanaka T, Surakka I, Stringham HM, Spector TD, Soranzo N, Smit JH, Sinisalo J, Silander K, Sijbrands EJ, Scuteri A, Scott J, Schlessinger D, Sanna S, Salomaa V, Saharinen J, Sabatti C, Ruokonen A, Rudan I, Rose LM, Roberts R, Rieder M, Psaty BM, Pramstaller PP, Pichler I, Perola M, Penninx BW, Pedersen NL, Pattaro C, Parker AN, Pare G, Oostra BA, O’Donnell CJ, Nieminen MS, Nickerson DA, Montgomery GW, Meitinger T, McPherson R, McCarthy MI, McArdle W, Masson D, Martin NG, Marroni F, Mangino M, Magnusson PK, Lucas G, Luben R, Loos RJ, Lokki ML, Lettre G, Langenberg C, Launer LJ, Lakatta EG, Laaksonen R, Kyvik KO, Kronenberg F, Konig IR, Khaw KT, Kaprio J, Kaplan LM, Johansson A, Jarvelin MR, Janssens AC, Ingelsson E, Igl W, Kees Hovingh G, Hottenga JJ, Hofman A, Hicks AA, Hengstenberg C, Heid IM, Hayward C, Havulinna AS, Hastie ND, Harris TB, Haritunians T, Hall AS, Gyllensten U, Guiducci C, Groop LC, Gonzalez E, Gieger C, Freimer NB, Ferrucci L, Erdmann J, Elliott P, Ejebe KG, Doring A, Dominiczak AF, Demissie S, Deloukas P, de Geus EJ, de Faire U, Crawford G, Collins FS, Chen YD, Caulfield MJ, Campbell H, Burtt NP, Bonnycastle LL, Boomsma DI, Boekholdt SM, Bergman RN, Barroso I, Bandinelli S, Ballantyne CM, Assimes TL, Quertermous T, Altshuler D, Seielstad M, Wong TY, Tai ES, Feranil AB, Kuzawa CW, Adair LS, Taylor HA Jr, Borecki IB, Gabriel SB, Wilson JG, Holm H, Thorsteinsdottir U, Gudnason V, Krauss RM, Mohlke KL, Ordovas JM, Munroe PB, Kooner JS, Tall AR, Hegele RA, Kastelein JJ, Schadt EE, Rotter JI, Boerwinkle E, Strachan DP, Mooser V, Stefansson K, Reilly MP, Samani NJ, Schunkert H, Cupples LA, Sandhu MS, Ridker PM, Rader DJ, van Duijn CM, Peltonen L, Abecasis GR, Boehnke M, Kathiresan S. Biological, clinical and population relevance of 95 loci for blood lipids. Nature. 2010;466:707–713. doi: 10.1038/nature09270. [DOI] [PMC free article] [PubMed] [Google Scholar]
- 11.Richards JB, Waterworth D, O'Rahilly S, Hivert MF, Loos RJ, Perry JR, Tanaka T, Timpson NJ, Semple RK, Soranzo N, Song K, Rocha N, Grundberg E, Dupuis J, Florez JC, Langenberg C, Prokopenko I, Saxena R, Sladek R, Aulchenko Y, Evans D, Waeber G, Erdmann J, Burnett MS, Sattar N, Devaney J, Willenborg C, Hingorani A, Witteman JC, Vollenweider P, Glaser B, Hengstenberg C, Ferrucci L, Melzer D, Stark K, Deanfield J, Winogradow J, Grassl M, Hall AS, Egan JM, Thompson JR, Ricketts SL, Konig IR, Reinhard W, Grundy S, Wichmann HE, Barter P, Mahley R, Kesaniemi YA, Rader DJ, Reilly MP, Epstein SE, Stewart AF, Van Duijn CM, Schunkert H, Burling K, Deloukas P, Pastinen T, Samani NJ, McPherson R, Davey Smith G, Frayling TM, Wareham NJ, Meigs JB, Mooser V, Spector TD, Consortium G. A genome-wide association study reveals variants in ARL15 that influence adiponectin levels. PLoS Genet. 2009;5:e1000768. doi: 10.1371/journal.pgen.1000768. [DOI] [PMC free article] [PubMed] [Google Scholar]
- 12.Paduch M, Jelen F, Otlewski J. Structure of small G proteins and their regulators. Acta Biochim Pol. 2001;48:829–850. [PubMed] [Google Scholar]
- 13.Lin JH, Liu ZH, Lv FJ, Fu YG, Fan XL, Li SY, Lu JM, Liu XY, Xu AL. Molecular analyses of HLA-DRB1, -DPB1, and -DQB1 in Jing ethnic minority of Southwest China. Human Immunol. 2003;64:830–834. doi: 10.1016/s0198-8859(03)00128-9. [DOI] [PubMed] [Google Scholar]
- 14.An epidemiological study of cardiovascular and cardiopulmonary disease risk factors in four populations in the People’s Republic of China. Baseline report from the P. R.C.-U.S.A. Collaborative Study. People’s Republic of China--United States Cardiovascular and Cardiopulmonary Epidemiology Research Group. Circulation. 1992;85:1083–1096. doi: 10.1161/01.cir.85.3.1083. [DOI] [PubMed] [Google Scholar]
- 15.Aung LH, Yin RX, Wu DF, Li Q, Yan TT, Wang YM, Li H, Wei DX, Shi YL, Yang DZ. Association of the TRIB1 tribbles homolog 1 gene rs17321515 A>G polymorphism and serum lipid levels in the Mulao and Han populations. Lipids Health Dis. 2011;10:230. doi: 10.1186/1476-511X-10-230. [DOI] [PMC free article] [PubMed] [Google Scholar]
- 16.Li Q, Yin RX, Wei XL, Yan TT, Aung LH, Wu DF, Wu JZ, Lin WX, Liu CW, Pan SL. ATP-binding cassette transporter G5 and G8 polymorphisms and several environmental factors with serum lipid levels. PLoS One. 2012;7:e37972. doi: 10.1371/journal.pone.0037972. [DOI] [PMC free article] [PubMed] [Google Scholar]
- 17.Aung LH, Yin RX, Wu DF, Cao XL, Hu XJ, Miao L. Proprotein convertase subtilisin/kexin type 9 gene E670G polymorphism interacts with alcohol consumption to modulate serum lipid levels. Int J Med Sci. 2013;10:124–132. doi: 10.7150/ijms.5296. [DOI] [PMC free article] [PubMed] [Google Scholar]
- 18.Ruixing Y, Yuming C, Shangling P, Fengping H, Tangwei L, Dezhai Y, Jinzhen W, Limei Y, Weixiong L, Rongshan L, Jiandong H. Effects of demographic, dietary and other lifestyle factors on the prevalence of hyperlipidemia in Guangxi Hei Yi Zhuang and Han populations. Eur J Cardiovasc Prev Rehabil. 2006;13:977–984. doi: 10.1097/01.hjr.0000239476.79428.25. [DOI] [PubMed] [Google Scholar]
- 19.Ishii M. The sixth report of the Joint National Committee on Prevention, Detection, Evaluation, and Treatment of High Blood Pressure, and 1999 World Health Organization-International Society of Hypertension Guidelines for the Management of Hypertension. Nihon Rinsho Jpn J Clin Med. 2000;58(Suppl 1):267–275. [PubMed] [Google Scholar]
- 20.Chalmers J, MacMahon S, Mancia G, Whitworth J, Beilin L, Hansson L, Neal B, Rodgers A, Ni Mhurchu C, Clark T. 1999 World Health Organization-International Society of Hypertension Guidelines for the management of hypertension. Guidelines sub-committee of the World Health Organization. Clin Exp Hypertens. 1999;21:1009–1060. doi: 10.3109/10641969909061028. [DOI] [PubMed] [Google Scholar]
- 21.Zhou BF Cooperative Meta-Analysis Group of the Working Group on Obesity in China. Predictive values of body mass index and waist circumference for risk factors of certain related diseases in Chinese adults--study on optimal cut-off points of body mass index and waist circumference in Chinese adults. Biomed Environ Sci. 2002;15:83–96. [PubMed] [Google Scholar]
- 22.Jeemon P, Pettigrew K, Sainsbury C, Prabhakaran D, Padmanabhan S. Implications of discoveries from genome-wide association studies in current cardiovascular practice. World J Cardiol. 2011;3:230–247. doi: 10.4330/wjc.v3.i7.230. [DOI] [PMC free article] [PubMed] [Google Scholar]
- 23.Bruce KD, Cagampang FR. Epigenetic priming of the metabolic syndrome. Toxicol Mech Method. 2011;21:353–361. doi: 10.3109/15376516.2011.559370. [DOI] [PubMed] [Google Scholar]
- 24.Dastani Z, Hivert MF, Timpson N, Perry JR, Yuan X, Scott RA, Henneman P, Heid IM, Kizer JR, Lyytikäinen LP, Fuchsberger C, Tanaka T, Morris AP, Small K, Isaacs A, Beekman M, Coassin S, Lohman K, Qi L, Kanoni S, Pankow JS, Uh HW, Wu Y, Bidulescu A, Rasmussen-Torvik LJ, Greenwood CM, Ladouceur M, Grimsby J, Manning AK, Liu CT, Kooner J, Mooser VE, Vollenweider P, Kapur KA, Chambers J, Wareham NJ, Langenberg C, Frants R, Willems-Vandijk K, Oostra BA, Willems SM, Lamina C, Winkler TW, Psaty BM, Tracy RP, Brody J, Chen I, Viikari J, Kähönen M, Pramstaller PP, Evans DM, St Pourcain B, Sattar N, Wood AR, Bandinelli S, Carlson OD, Egan JM, Böhringer S, van Heemst D, Kedenko L, Kristiansson K, Nuotio ML, Loo BM, Harris T, Garcia M, Kanaya A, Haun M, Klopp N, Wichmann HE, Deloukas P, Katsareli E, Couper DJ, Duncan BB, Kloppenburg M, Adair LS, Borja JB DIAGRAM+ Consortium; MAGIC Consortium; GLGC Investigators; MuTHER Consortium; Wilson JG, Musani S, Guo X, Johnson T, Semple R, Teslovich TM, Allison MA, Redline S, Buxbaum SG, Mohlke KL, Meulenbelt I, Ballantyne CM, Dedoussis GV, Hu FB, Liu Y, Paulweber B, Spector TD, Slagboom PE, Ferrucci L, Jula A, Perola M, Raitakari O, Florez JC, Salomaa V, Eriksson JG, Frayling TM, Hicks AA, Lehtimäki T, Smith GD, Siscovick DS, Kronenberg F, van Duijn C, Loos RJ, Waterworth DM, Meigs JB, Dupuis J, Richards JB, Voight BF, Scott LJ, Steinthorsdottir V, Dina C, Welch RP, Zeggini E, Huth C, Aulchenko YS, Thorleifsson G, McCulloch LJ, Ferreira T, Grallert H, Amin N, Wu G, Willer CJ, Raychaudhuri S, McCarroll SA, Hofmann OM, Segrè AV, van Hoek M, Navarro P, Ardlie K, Balkau B, Benediktsson R, Bennett AJ, Blagieva R, Boerwinkle E, Bonnycastle LL, Boström KB, Bravenboer B, Bumpstead S, Burtt NP, Charpentier G, Chines PS, Cornelis M, Crawford G, Doney AS, Elliott KS, Elliott AL, Erdos MR, Fox CS, Franklin CS, Ganser M, Gieger C, Grarup N, Green T, Griffin S, Groves CJ, Guiducci C, Hadjadj S, Hassanali N, Herder C, Isomaa B, Jackson AU, Johnson PR, Jørgensen T, Kao WH, Kong A, Kraft P, Kuusisto J, Lauritzen T, Li M, Lieverse A, Lindgren CM, Lyssenko V, Marre M, Meitinger T, Midthjell K, Morken MA, Narisu N, Nilsson P, Owen KR, Payne F, Petersen AK, Platou C, Proença C, Prokopenko I, Rathmann W, Rayner NW, Robertson NR, Rocheleau G, Roden M, Sampson MJ, Saxena R, Shields BM, Shrader P, Sigurdsson G, Sparsø T, Strassburger K, Stringham HM, Sun Q, Swift AJ, Thorand B, Tichet J, Tuomi T, van Dam RM, van Haeften TW, van Herpt T, van Vliet-Ostaptchouk JV, Walters GB, Weedon MN, Wijmenga C, Witteman J, Bergman RN, Cauchi S, Collins FS, Gloyn AL, Gyllensten U, Hansen T, Hide WA, Hitman GA, Hofman A, Hunter DJ, Hveem K, Laakso M, Morris AD, Palmer CN, Rudan I, Sijbrands E, Stein LD, Tuomilehto J, Uitterlinden A, Walker M, Watanabe RM, Abecasis GR, Boehm BO, Campbell H, Daly MJ, Hattersley AT, Pedersen O, Barroso I, Groop L, Sladek R, Thorsteinsdottir U, Wilson JF, Illig T, Froguel P, van Duijn CM, Stefansson K, Altshuler D, Boehnke M, McCarthy MI, Soranzo N, Wheeler E, Glazer NL, Bouatia-Naji N, Mägi R, Randall J, Elliott P, Rybin D, Dehghan A, Hottenga JJ, Song K, Goel A, Lajunen T, Doney A, Cavalcanti-Proença C, Kumari M, Timpson NJ, Zabena C, Ingelsson E, An P, O’Connell J, Luan J, Elliott A, McCarroll SA, Roccasecca RM, Pattou F, Sethupathy P, Ariyurek Y, Barter P, Beilby JP, Ben-Shlomo Y, Bergmann S, Bochud M, Bonnefond A, Borch-Johnsen K, Böttcher Y, Brunner E, Bumpstead SJ, Chen YD, Chines P, Clarke R, Coin LJ, Cooper MN, Crisponi L, Day IN, de Geus EJ, Delplanque J, Fedson AC, Fischer-Rosinsky A, Forouhi NG, Franzosi MG, Galan P, Goodarzi MO, Graessler J, Grundy S, Gwilliam R, Hallmans G, Hammond N, Han X, Hartikainen AL, Hayward C, Heath SC, Hercberg S, Hillman DR, Hingorani AD, Hui J, Hung J, Kaakinen M, Kaprio J, Kesaniemi YA, Kivimaki M, Knight B, Koskinen S, Kovacs P, Kyvik KO, Lathrop GM, Lawlor DA, Le Bacquer O, Lecoeur C, Li Y, Mahley R, Mangino M, Martínez-Larrad MT, McAteer JB, McPherson R, Meisinger C, Melzer D, Meyre D, Mitchell BD, Mukherjee S, Naitza S, Neville MJ, Orrù M, Pakyz R, Paolisso G, Pattaro C, Pearson D, Peden JF, Pedersen NL, Pfeiffer AF, Pichler I, Polasek O, Posthuma D, Potter SC, Pouta A, Province MA, Rayner NW, Rice K, Ripatti S, Rivadeneira F, Rolandsson O, Sandbaek A, Sandhu M, Sanna S, Sayer AA, Scheet P, Seedorf U, Sharp SJ, Shields B, Sigurðsson G, Sijbrands EJ, Silveira A, Simpson L, Singleton A, Smith NL, Sovio U, Swift A, Syddall H, Syvänen AC, Tönjes A, Uitterlinden AG, van Dijk KW, Varma D, Visvikis-Siest S, Vitart V, Vogelzangs N, Waeber G, Wagner PJ, Walley A, Ward KL, Watkins H, Wild SH, Willemsen G, Witteman JC, Yarnell JW, Zelenika D, Zethelius B, Zhai G, Zhao JH, Zillikens MC DIAGRAM Consortium; GIANT Consortium; Global B Pgen Consortium; Borecki IB, Meneton P, Magnusson PK, Nathan DM, Williams GH, Silander K, Bornstein SR, Schwarz P, Spranger J, Karpe F, Shuldiner AR, Cooper C, Serrano-Ríos M, Lind L, Palmer LJ, Hu FB 1st, Franks PW, Ebrahim S, Marmot M, Kao WH, Pramstaller PP, Wright AF, Stumvoll M, Hamsten A Procardis Consortium; Buchanan TA, Valle TT, Rotter JI, Penninx BW, Boomsma DI, Cao A, Scuteri A, Schlessinger D, Uda M, Ruokonen A, Jarvelin MR, Peltonen L, Mooser V, Sladek R MAGIC investigators; GLGC Consortium. Musunuru K, Smith AV, Edmondson AC, Stylianou IM, Koseki M, Pirruccello JP, Chasman DI, Johansen CT, Fouchier SW, Peloso GM, Barbalic M, Ricketts SL, Bis JC, Feitosa MF, Orho-Melander M, Melander O, Li X, Li M, Cho YS, Go MJ, Kim YJ, Lee JY, Park T, Kim K, Sim X, Ong RT, Croteau-Chonka DC, Lange LA, Smith JD, Ziegler A, Zhang W, Zee RY, Whitfield JB, Thompson JR, Surakka I, Spector TD, Smit JH, Sinisalo J, Scott J, Saharinen J, Sabatti C, Rose LM, Roberts R, Rieder M, Parker AN, Pare G, O’Donnell CJ, Nieminen MS, Nickerson DA, Montgomery GW, McArdle W, Masson D, Martin NG, Marroni F, Lucas G, Luben R, Lokki ML, Lettre G, Launer LJ, Lakatta EG, Laaksonen R, Kyvik KO, König IR, Khaw KT, Kaplan LM, Johansson Å, Janssens AC, Igl W, Hovingh GK, Hengstenberg C, Havulinna AS, Hastie ND, Harris TB, Haritunians T, Hall AS, Groop LC, Gonzalez E, Freimer NB, Erdmann J, Ejebe KG, Döring A, Dominiczak AF, Demissie S, Deloukas P, de Faire U, Crawford G, Chen YD, Caulfield MJ, Boekholdt SM, Assimes TL, Quertermous T, Seielstad M, Wong TY, Tai ES, Feranil AB, Kuzawa CW, Taylor HA Jr, Gabriel SB, Holm H, Gudnason V, Krauss RM, Ordovas JM, Munroe PB, Kooner JS, Tall AR, Hegele RA, Kastelein JJ, Schadt EE, Strachan DP, Reilly MP, Samani NJ, Schunkert H, Cupples LA, Sandhu MS, Ridker PM, Rader DJ, Kathiresan S. Novel loci for adiponectin levels and their influence on type 2 diabetes and metabolic traits: a multi-ethnic meta-analysis of 45,891 individuals. PLoS Genet. 2012;8:e1002607. doi: 10.1371/journal.pgen.1002607. [DOI] [PMC free article] [PubMed] [Google Scholar]
- 25.Ruixing Y, Qiming F, Dezhai Y, Shuquan L, Weixiong L, Shangling P, Hai W, Yongzhong Y, Feng H, Shuming Q. Comparison of demography, diet, lifestyle, and serum lipid levels between the Guangxi Bai Ku Yao and Han populations. J Lipid Res. 2007;48:2673–2681. doi: 10.1194/jlr.M700335-JLR200. [DOI] [PubMed] [Google Scholar]
- 26.Wang Z. Chinese Jing Nationality’s diet culture observation. Thailand, Bangkok: The Second Asian Food Forum (2012 Bangkok); 2012. p. 12. [Google Scholar]
- 27.Valente EA, Sheehy ME, Avila JJ, Gutierres JA, Delmonico MJ, Lofgren IE. The effect of the addition of resistance training to a dietary education intervention on apolipoproteins and diet quality in overweight and obese older adults. Clin Interv Aging. 2011;6:235–241. doi: 10.2147/CIA.S23583. [DOI] [PMC free article] [PubMed] [Google Scholar]
- 28.Howell WH, McNamara DJ, Tosca MA, Smith BT, Gaines JA. Plasma lipid and lipoprotein responses to dietary fat and cholesterol: a meta-analysis. Am J Clin Nutr. 1997;65:1747–1764. doi: 10.1093/ajcn/65.6.1747. [DOI] [PubMed] [Google Scholar]
- 29.Fung TT, Rexrode KM, Mantzoros CS, Manson JE, Willett WC, Hu FB. Mediterranean diet and incidence of and mortality from coronary heart disease and stroke in women. Circulation. 2009;119:1093–1100. doi: 10.1161/CIRCULATIONAHA.108.816736. [DOI] [PMC free article] [PubMed] [Google Scholar]
- 30.Esposito K, Giugliano D. Mediterranean diet and prevention of coronary heart disease. J Endocrinol Invest. 2002;25:296–299. doi: 10.1007/BF03344005. [DOI] [PubMed] [Google Scholar]
- 31.Yan-Ling Z, Dong-Qing Z, Chang-Quan H, Bi-Rong D. Cigarette smoking and its association with serum lipid/lipoprotein among Chinese nonagenarians/centenarians. Lipids Health Dis. 2012;11:94. doi: 10.1186/1476-511X-11-94. [DOI] [PMC free article] [PubMed] [Google Scholar]
- 32.Rao Ch S, Subash YE. The effect of chronic tobacco smoking and chewing on the lipid profile. J Clin Diagn Res. 2013;7:31–34. doi: 10.7860/JCDR/2012/5086.2663. [DOI] [PMC free article] [PubMed] [Google Scholar]
- 33.Hata Y, Nakajima K. Life-style and serum lipids and lipoproteins. J Atheroscler Thromb. 2000;7:177–197. doi: 10.5551/jat1994.7.177. [DOI] [PubMed] [Google Scholar]
- 34.Camargo CA Jr, Hennekens CH, Gaziano JM, Glynn RJ, Manson JE, Stampfer MJ. Prospective study of moderate alcohol consumption and mortality in US male physicians. Arch Intern Med. 1997;157:79–85. [PubMed] [Google Scholar]
- 35.Gaziano JM, Buring JE, Breslow JL, Goldhaber SZ, Rosner B, VanDenburgh M, Willett W, Hennekens CH. Moderate alcohol intake, increased levels of high-density lipoprotein and its subfractions, and decreased risk of myocardial infarction. N Engl J Med. 1993;329:1829–1834. doi: 10.1056/NEJM199312163292501. [DOI] [PubMed] [Google Scholar]
- 36.Pai JK, Mukamal KJ, Rimm EB. Long-term alcohol consumption in relation to all-cause and cardiovascular mortality among survivors of myocardial infarction: the Health Professionals Follow-up Study. Eur Heart J. 2012;33:1598–1605. doi: 10.1093/eurheartj/ehs047. [DOI] [PMC free article] [PubMed] [Google Scholar]
- 37.Goldberg IJ, Mosca L, Piano MR, Fisher EA Nutrition Committee CoE, Prevention, Council on Cardiovascular Nursing of the American Heart Association. AHA Science Advisory: Wine and your heart: a science advisory for healthcare professionals from the Nutrition Committee, Council on Epidemiology and Prevention, and Council on Cardiovascular Nursing of the American Heart Association. Circulation. 2001;103:472–475. doi: 10.1161/01.cir.103.3.472. [DOI] [PubMed] [Google Scholar]
- 38.Stampfer MJ, Krauss RM, Ma J, Blanche PJ, Holl LG, Sacks FM, Hennekens CH. A prospective study of triglyceride level, low-density lipoprotein particle diameter, and risk of myocardial infarction. JAMA. 1996;276:882–888. [PubMed] [Google Scholar]
- 39.Onat A, Hergenc G, Dursunoglu D, Ordu S, Can G, Bulur S, Yuksel H. Associations of alcohol consumption with blood pressure, lipoproteins, and subclinical inflammation among Turks. Alcohol. 2008;42:593–601. doi: 10.1016/j.alcohol.2008.06.007. [DOI] [PubMed] [Google Scholar]
- 40.Brinton EA. Effects of ethanol intake on lipoproteins and atherosclerosis. Curr Opin Lipidol. 2010;21:346–351. doi: 10.1097/MOL.0b013e32833c1f41. [DOI] [PubMed] [Google Scholar]