



Abstract
We investigated that if rTsP53 could be used to activate bone-marrow derived macrophage (BMDM) into M2 macrophage and stop M1 macrophage activation. After 72 h incubation in blank culture medium, cells with PE-CCR7 (-) and FITC-CD206 (-) was extracted and its mean proportion was 92.30 ± 0.22%. With the stimulation of 20 μg/ml IFN-γ for 72 h, cells with PE-CCR7 (+) was extracted and its mean proportion was 16.24 ± 0.82%. With the stimulation of IL-3/IL-14 (both 10 μg/ml) for 72 h, cells with FICT-CD206 (+) was extracted and its mean proportion was 87.32 ± 4.29%. Co-incubation with different dose of rTsP53 (0.001 μg/ml, 0.01 μg/ml, 0.1 μg/ml, 1 μg/ml, 2 μg/ml, 5 μg/ml, 10 μg/ml, respectively) for 72 h, FITC-CD206 (+) macrophage was extracted. The mean proportion in each group was 1.09 ± 0.22%, 2.13 ± 0.13%, 4.91 ± 0.07%, 5.48 ± 0.29%, 9.81 ± 0.06%, 12.83 ± 0.55%, 17.87 ± 0.02%, respectively. The dose of rTsP53 was significantly positive correlated to the proportion of FITC-CD206 (+) macrophage. Co-incubation with 20 μg/ml IFN-γ and 5 μg/ml rTsP53 for 72 h, cells with PE-CCR7 (+) was extracted and its mean proportion was 10.60 ± 0.19%. Compared to that of mere co-incubation with IFN-γ, there was significant difference between the two groups. ELISA showed that Th1 cytokines’ (IFN-γ, IL-6 and TNF-α) level decreased in the culture medium supernatant of BMDM co-incubated with rTsP53. There was negative correlation between the Th1 cytokines’ level and the dose of rTsP53. Both Th2 cytokines (IL-4 and IL-13) and regulatory cytokines in the culture medium increased. There was positive correlation between the Th2 cytokines’ level and the dose of rTsP53. There was also positive correlation between the regulatory cytokines’ level and the dose of rTsP53. Compared to that of BMDM co-incubated with IFN-γ, levels of TNF-α and IL-6 were significant lower than that of BMDM co-incubated with both IFN-γ and rTsP53 (both P < 0.05), while the levels of IL-4 and TGF-β were significant higher (both P < 0.05). There was no significant difference in the levels of IL-13 and IL-10 between the two groups.
Keywords: rTsP53, M1/M2, bone-marrow derived macrophage
Introduction
Sepsis is one of serious complications secondary to the strong attack from serious infection, trauma, burns, major surgery, etc., from which the derived severe sepsis and septic shock are the main causes for multiple organ dysfunction syndrome (MODS) and it is one common cause for the death of critical ill patients in emergency department and intensive care unit [1]. Hundreds of thousands of global death cases are caused by sepsis every year, and the cost of treatment is up to tens of billions of dollars [2]. However, as the causes of sepsis include many factors such as infection, trauma, burns, surgery and so on, and the development process itself also involves shock, disseminated intravascular coagulation (DIC), organ dysfunction, and other pathophysiologic processes, the clinician work is faced with great challenges, and it also becomes an important research hotspot in the fields of emergency medicine and critical care medicine [3,4].
Although the pathogenesis of sepsis is still not fully understood at present, the theory that immune system abnormalities lead to the excessive activation of inflammatory/inflammatory reaction and further caused theoretical tissue damage or immune paralysis has become an important philosophy in the research area of sepsis through the basic and clinical exploration over the years [5,6]. And therefore a new treatment concept, immunomodulation is proposed. The macrophage plays a role of antigen presenting (AP) in the body’s immune process, and meanwhile a series of cytokines generated by it will further regulate the immune response process [7]. So the study of macrophages and immune response will further reveal the underlying mechanism of sepsis development, and may offer a new treatment method.
Macrophage is an important part of the immune system, widely distributed in the body, which expresses various receptors, enzymes and bioactive substances [8]. In sepsis, macrophage can directly phagocytose pathogenic microorganisms, directly causing damage to a variety of pathogenic microorganisms by enzymes and bioactive substances generated itself, and can also change and promote the body immune responses by a variety of biologically active substances and their own AP effect [9]. Therefore macrophage can be called as is important immune cell in the body with “nexus” role.
The research study has also found from previous studies that liver fluke and schistosome-infected animals show obvious resistance to the sepsis caused by cecum-ligation-puncture (CLP) model and LPS-induced intraperitoneal injection, and animal survival rate is significantly higher than control group [10,11]. Further test indicates that obvious M2 macrophage activation phenomenon can be seen in the macrophages of animals, and cytokine profile shows obvious trend of Th2 immune activation [12]. The peritoneal macrophages in adoptive liver fluke rats or the macrophages activated by IL-3/IL-14 in vitro can both play a role in improving the prognosis of septic animals [13,14]. However, the result of another study shows that the pretreatment by the administration of recombinant trichinella spiralis-53 kDa protein (rTsP53), can promote Th2 type cytokine production by activating the M2 macrophages in animal gut mucosa, thereby improving the symptom induced by trinitro-benzene-sulfonic acid (TNBS) [15]. We explored that whether rTsP53 could be used to activate bone-marrow derived macrophage (BMDM) into M2 macrophage and stop M1 macrophage activation.
Materials and methods
Extract positive bacteria to clone and augment inducible expression of target proteins
PET-28a (+)-TsP53-E had been prepared in preliminary study. Glycerin bacteria coli BL21 were taken out from ultra low temperature refrigerator and were unfrozen. Inoculation of glycerin bacteria was conducted in solid medium of LB. After that, it was placed in water-Jacket thermostatic constant incubator at 37°C for one night. Subsequently, it was placed in 3 ml LB broth and 3 μl kanamycin solution was added. Bacteria distributed alone was picked from surface of LB solid medium using 10 μl liquid-moving machine. Then, it would be cultivated in cultivate oscillator of 37°C at 200 r/m for 12 h. Bacterium solution was taken. 30 μl kanamycin soluton and 0.3 ml bacterium solution were added into 30 ml LB broth. Cultivating in thermostat oscillator of 37°C at 200 r/m for 12 h. Remaining bacterial solution was sealed and was preserved at 4°C. After 12 h, 30 ml bacterium solution was obtained. 3 ml kanamycin solution and 30 ml bacterial solution were added into 3000 ml LB broth. Then it would be cultivated in cultivate oscillator of 37°C at 200 r/m for 2.5 h. Then 3 ml inductive agent of 1 M IPTG was added. Under the conditions of 1 mM IPTG, it would be cultivated for 5 h and 3000 ml bacterial solution after induced expressions was obtained. 7000 r/m of centrifuge at low temperature was conducted at 10°C. At the bottom of centrifuge tube, white residue was formed. All the supernatant was discarded and re-suspended by binding buffer. Milk-white suspension was formed and 50 ml centrifuge tube was placed to preserve at -20°C for one night.
Extract, purification, dialysis, endotoxin removal and concentration of protein rTsP53
Three cycles of ultrasonic degradation was administrated. And each cycle was performed for 10 min and interval for each cycle was 5 min. Degradation product was centrifuged for 15 min at 12000 r/m. Supernatant was discarded and subside remained. 15 ml preliminary purified A liquid was added into sediment to eliminate impure proteins. After re-suspending, centrifuge of 4°C was conducted for 15 min at 12000 r/m. Supernatant was discarded and subside remained. 30 ml urea solution liquid of 8 M was added into subside and resuspended. Then it would be placed on shaking tables and vibrated to clarify the liquid. After 4°C of centrifuge for 15 min at 13000 r/m, supernatant was obtained. After filtration with 0.45 μm microporous membrane, it was regarded as metal-chelatinmetal-chelatingchromatographic column of Ni-NTA-HIS. 3 ml deionized water, buffer solution of 5 ml 1 × nickel ionization, 1 ml 2 M urea-bind buffer, 1 ml urea-bind buffer and 1 ml 6 M Tris-NaCl basic liquid were added to accomplish pre-treatment of metal-chelatin chromatographic column. Metal-chelatin chromatographic column was added into supernatant samples processed by 8 M urea solution liquid to accomplish the combination of protein samples under action of gravity. After washing chromatographic column, 3 ml 1 × stripper with urea, 5 ml deionized water, 5 ml 1 × stripper without urea were preserved at 4°C. 8 μl 4 × SDS pre-dye solution and 2 μl DTT solution were added into 30 μl protein concentration and heated in boiling water for 8 minutes to complete pre-treatment of samples. 12% separation gel of SDS-PAGE and spacer gel were made and placed into electrophoresis tank. Electrophoretic buffer solution of 1 × SDS-PAGE was added. Subsequently, separation gel was taken out and dyed with Coomassie blue solution for 20 min. After stewing of semipermeable membrane in boiling water for 30 min, semipermeable membrane was clipped to bag-like shape. Eluant of target protein was added to manufacture eluant of 4 M urea-Tris-EDTA. Semipermeable membrane containing target protein eluant was placed in it. With dialysis of magnetic stirring apparatus at 4°C, adequate dialyzated liquid was poured out every 3 h and equivalent Tris-EDTA buffer solution without urea was added to decrease concentration of urea in dialyzated liquid. When concentration of urea in dialyzate was decreased to 0.5 M, all the dialyzate was replaced by PBS. By repeating this process for 12 h, Tris, EDTA, imidazole and urea were eliminated. Endotoxin of ToxinEraserTM was added into protein samples after dialysis to wipe out resin and chelated for 1 hour. Elution was conducted according to instruction book to get protein samples whose endotoxin had been eliminated. Limulus reagent method was used to test whether endotoxin had been removed. After removal of endotoxin, protein samples were added into centrifuge tube to centrifuge at 3800 r/m 10°C for 10 min. This process was repeated to concentrate the samples of protein rTsP53. Based on requirements on instruction books, standard protein samples of concentration gradient were made up. BCA was employed to measure concentration of proteins. Tested by spectrophotometer, concentration gradient curve and concentration of rTsP53 were counted. Purity of rTsP53 was again appraised by SDS-PAGE.
The preparation of anti-rTsP53 protein polyclonal antibody and tittering
After emulsification in Freund’s complete adjuvant, SD rats were injected subcutaneously. On the 3rd and 5th weeks, after emulsification of rTsP53 in Freund’s incomplete adjuvant, SD rats were subcutaneously injected. On 3rd and 5th weeks, tail blood collection was used to get peripheral blood. Samples were placed for 1 hour in normal temperature and then placed at 4°C for one night. On the next day, centrifuge of 4°C at 5000 r/m was conducted for 10 min to get serum specimen.
ELISA was employed to test titer of protein rTsP53
Antigen coating buffer was used to adjusted protein rTsP53 to be 5 μg/ml. 100 μl was added into each hole of 96 pore plates. 0.5% PBS-T solution was used for 5 times. After processing by oscillator, PBS-T containing 1% of skim milk powder was added and placed in constant temperature incubator at 37°C for 2 h. Board washing with 0.5% PBS-T solution for 5 times. Each hole was 200 μl and processed on the oscillator. After that, peripheral blood serum attenuated with 0.1% BSA-PBS-T was added to the first row of plates with 96 holes. Subsequently, each hole of each row was attenuated with dilutability of 1:800, 1:1600, 1:3200, 1:6400, 1:12800, 1:25600, 1:51200, 1:102400, 1:204800 and 1:409600. Each hole was 100 μl and placed in constant temperature incubator of 37°C for 2 h. 0.5% PBS-T solution was used to wash plates and processed on oscillator. Each time sustained for 1 min. After that, each hole was added by IgG second antibody attenuated by antibody dilution buffer of 1:2000. Each hole was 100 μl and placed in constant temperature incubator at 37°C for 1 h. Plates were washing with 0.5% PBS-T solution for 5 times and processed on oscillator. Each hole was added by 100 μl TMB substrate and placed at normal temperature avoiding light for 20 min. Then 2 M sulfuric acid terminated liquid was added to stop the reactions.
Cell cultivation
After processing of L929 cell, it was injected into 50 ml cell culture medium with fetal calf serum of 10% and P/S of 1% and cultivated in this solution for 7 days. On 7th day, all the culture mediums were filtrated with 0.2 μm microporous membrane and placed into other culture bottles to cryopreserve at temperature of -20°C. High concentration of Macrophage Clone Stimulating Factor (M-CSF) on supernatant of this culture medium was used to induce differentiation of macrophage lineage in future experiment.
Extraction and induced differentiation of bone marrow derived macrophage (BMDM)
10 mice were killed through cervical dislocation method and were placed into medicinal alcohol of 75% for 10 minutes to have surface sterilization. Subsequently, they were placed into ultra-clean environment. An annular notch was cut along hypogastrium and low limb skins were separated by blunt dissection. Knee joints were cut and joints of haunch bone and spine were searched. After careful separation, thigh bones and hip bones were unveiled. Remaining muscles and Achilles’s tendon tissues were wiped off and thigh bones and hip bones were reserved. Both ends of bones were cut open. 2.5 ml DMEM without sodium pyruvate were taken up by injection syringe of 2.5 ml to inject into one end of the bone. Subsequently, bone marrow was driven by medium liquid to centrifuge tubes of 15 ml. It continued until marrow cavity was white. Then the wash-out solution containing bone-marrow cells was cultivated in cell culture medium with fetal calf serum of 10%, DMEM with sodium pyruvate and P/S of 1%. Centrifuge 1000 r/min was conducted for 5 min. Supernatant was discarded. Then it was injected into DMEM with sodium pyruvate. This process was repeated twice. 30% L929 of supernatant was added into culture hole and cells were planted into it. Then it was placed in environment of 5% CO2 at 37°C for 96 h. Medium changes were conducted and growth ingredients which were not adherent to walls were discarded. Then BMDMs which was myeloid origin was obtained.
Induced macrophage differentiation, ELISA and FCM study and further statistical analysis
After filtration of rTsP53 protein samples by microporous membrane of 0.2 μm, it would be used in cellular trial. After repetitive scrubbing, IFN-γ of 20 ng/ml, IL-3/IL-14 of 10 ng/ml and 10 ng/ml, respectively were added into BMDMs to induce the differentiation. After subculture for 72 h, macrophage M0, M1 and M2 were obtained. FCM was employed to test the percentages of surface marker of PE-CCR7 and surface marker of FITC-CD206 in porocytes of cell cultured plate. Then it would be presented by percentage of the proportion ± standard deviation (x ± s)%. Above-mentioned data was used to do comparative study. After repetitive scrubbing of BMDMs by PBS, protein rTsP53 of 0.001 μg/ml, 0.01 μg/ml, 0.1 μg/ml, 1 μg/ml, 2 μg/ml, 5 μg/ml and 10 μg/ml were added. After cultivation for 72 h, proportions of surface markers of PE-CCR7 and FITC-CD206 were tested by FCM. Then it would be presented by percentage of the proportion ± standard deviation (x ± s)%. SPSS was employed to conduct linear-regression analysis and curve fitting between protein concentration of rTsP53 and proportional numbers of positive cells of FITC-206. After repetitive cleaning of BMDMs obtained from step 2, IFN-γ of 20 ng/ml and rTsP53 of 5 μg/ml were added to co-culture for 72 h. FCM was repeated to test the proportions of surface marker of PE-CCR7 of M1 and surface marker of positive cells of FITC-CD206 of M2. It would be presented by percentage of the proportion ± standard deviation (x ± s)%. Related proportions of cell percentages were documented. SPSS independent sample T test was employed to test differences. Differences were considered significant when P < 0.05. Related proportions of cell percentages were documented. Supernatant of cell culture were preserved. ELISA was used to test IFN-γ, IL-6, TNF-α, IL-4, IL-13 and IL-10.
Results
12% SDS-PAGE for urea-imidazole wash buffer with rTsP53 in different concentration
The rTsP53 protein concentrate containing urea-imidazole eluent of different concentrations was tested by 12% SDS-PAGE, and the results showed that rTsP53 protein presented the highest concentration in 50 mM and 100 mM eluent containing urea-imidazole (Figure 1).
Figure 1.
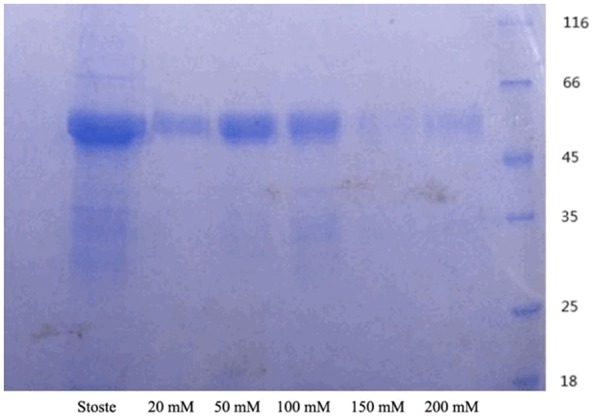
12% SDS-PAGE for Urea-Imidazole Wash Buffer with rTsP53 in Different Concentration.
12% SDS-PAGE for the evaluation of rTsP53 purity after purification
The rTsP53 protein solution after dialysis, removal of toxins and ultrafiltration to remove impurity protein was tested by BCA assay and the results showed the concentration fluctuates between 650 μg/ml and 1.2 mg/ml. 12% SDS-PAGE was applied again to assess the purity of the purified protein (Figure 2).
Figure 2.
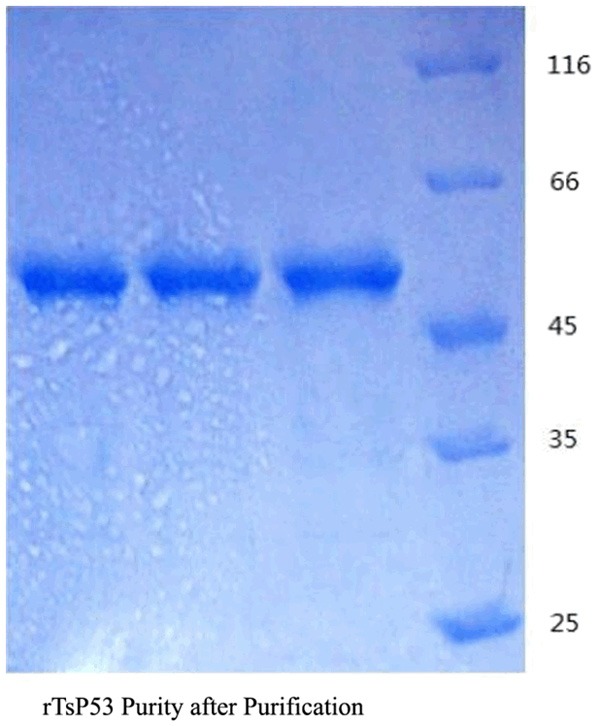
12% SDS-PAGE for the Evaluation of rTsP53 Purity after Purification.
Flow cytometry of BMDM with induced differentiation after 72 h
After the culture in blank culture medium for 72 h, PE-CCR7 (-) and FITC-CD206 (-) macrophages were obtained, with the mean proportion 92.30 ± 0.22% of the total cells. Through the stimulation by IFN-γ 20 ng/ml for 72 h, PE-CCR7 (+) macrophages were obtained, with the mean proportion 16.24 ± 0.82% of the total cells.After the stimulation for 72 h by 10 ng/ml IL-3 and 10 ng/ml IL-14 respectively, FITC-CD206 (+) macrophages were obtained, accounting for 87.32 ± 4.29% of the total cells on average (Figure 3).
Figure 3.
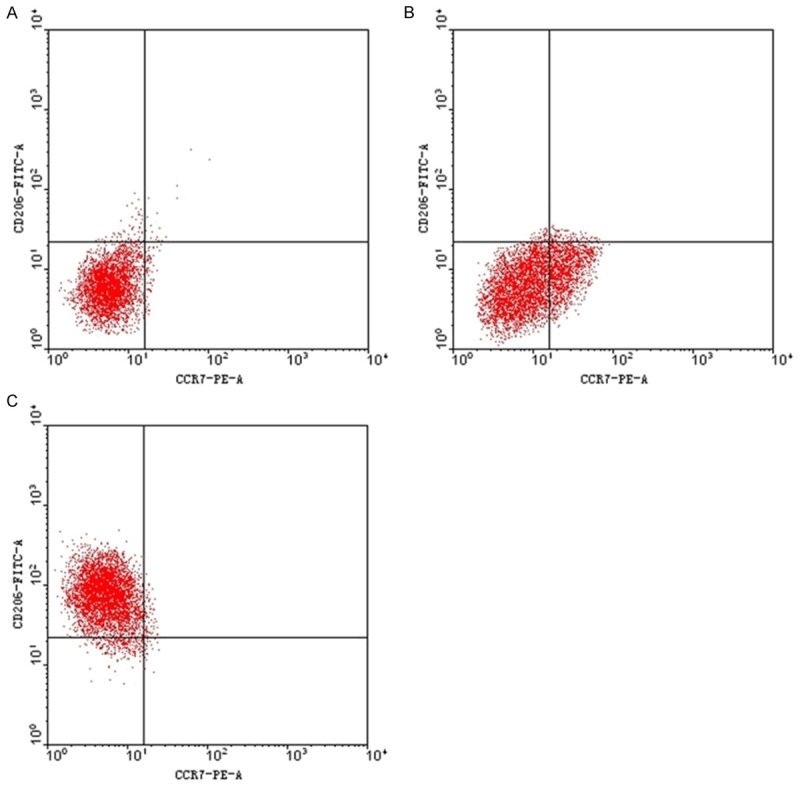
Flow cytometry of BMDM with Induced Differentiation after 72 h. Flow cytometry of BMDM with induced IFN-γ (A), IL-3 (B) and IL-14 (C) after 72 h.
Flow cytometry of BMDM with induced differentiation after 72 h
After the co-culture with different concentrations of rTsP53 protein (0.001 μg/ml, 0.01 μg/ml, 0.1 μg/ml, 1 μg/ml, 2 μg/ml, 5 μg/ml and 10 μg/ml) for 72 h, FITC-CD206 (+) macrophages were obtained, accounting for respectively 1.09 ± 0.22%, 2.13 ± 0.13%, 4.91 ± 0.07%, 5.48 ± 0.29%, 9.81 ± 0.06%, 12.83 ± 0.55% and 17.87 ± 0.02% of the total cells on average (Figure 4A-G). The ratios of rTsP53 protein and FITC-206 (+) macrophages were positively correlated with a correlation coefficient of 1.510, non-standardized regression equation FCM% = 3.997 + 1.510 rTsP53, and the correlation was statistically significant (Figure 4H).
Figure 4.
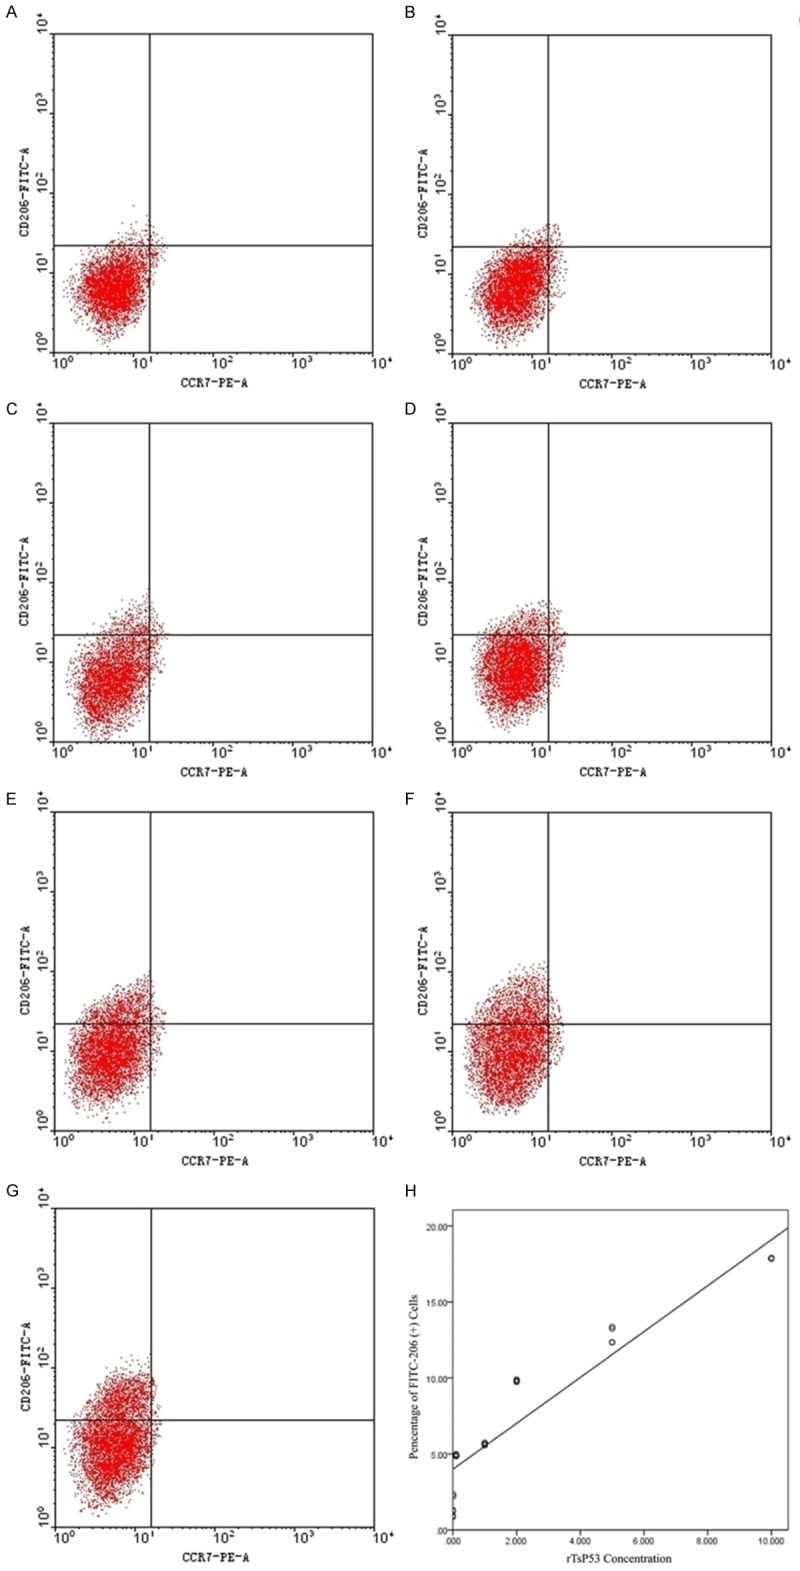
Flow cytometry of BMDM with Induced Differentiation after 72 h. Flow cytometry of BMDM with induced 0.001 μg/ml (A), 0.01 μg/ml (B), 0.1 μg/ml (C), 1 μg/ml (D), 2 μg/ml (E), 5 μg/ml (F) and 10 μg/ml (G) after 72 h. The ratios of rTsP53 protein and FITC-206 (+) macrophages (H).
Flow cytometry of BMDM coincubated with IFN-γ or IFN-γ + rTsP53 for 72 h
After the co-culture of 20 ng/ml IFN-γ and BMDM for 72 h, the obtained PE-CCR7 (+) cells accounted for 16.24 ± 0.82% of the total cells on average, and FITC-206 (+) cells accounted for 1.04 ± 0.05 % of the total cells on average. After the co-culture of 20 ng/ml IFN-γ and 5 μg/ml rTsP53 for 72 h, the obtained PE-CCR7 (+) cells accounted for 10.60 ± 0.19% of the total cells on average, and FITC-206 (+) cells accounted for 0.96 ± 0.09% of the total cells on average. Comparing the two conditions, the resulted difference in mean ratio of PE-CCR7 (+) cells was statistically significant (Figure 5).
Figure 5.
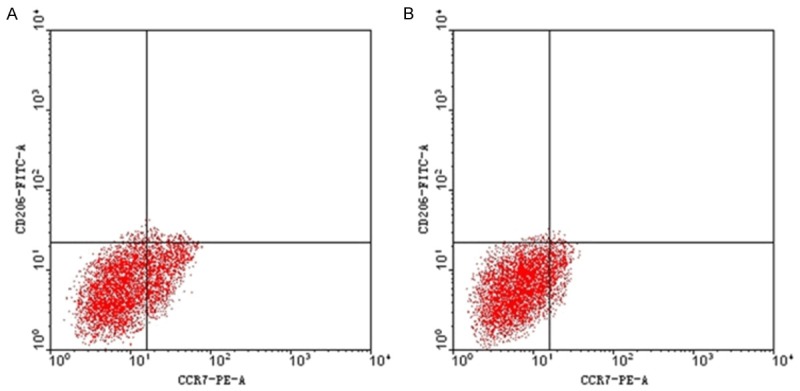
Flow cytometry of BMDM Coincubated with IFN-γ or IFN-γ + rTsP53 for 72 h. Flow cytometry of BMDM Coincubated with 20 ng/ml IFN-γ (A) and 20 ng/ml IFN-γ and 5 μg/ml rTsP53 (B) for 72 h.
Th1 cytokines from the medium supernatant of BMDM with different concentration of rTsP53
In the co-culture of different concentrations of rTsP53 protein, supernatant IFN-γ, IL-6 and TNF-α levels in BMDM culture medium were compared. The supernatant IFN-γ and IL-6 levels in culture medium in M0 + IL-4/IL-13 and the BMDM in which different concentrations of rTsP53 protein were added were significantly lower than those in M0 cells. TNF-α level in supernatant culture medium in which 0.001 μg/ml rTsP53 protein was co-cultured showed no significant difference from that in M0 cells.In the M0 + IL-4/IL-13 group and the BMDM groups with different concentrations (except at the concentration of 0.001 μg/ml) of rTsP53 protein, TNF-α level was significantly lower than that of M0 cells. Compared with M0 + IL-4/IL-13 group, supernatant IFN-γ, IL-6 and TNF-α levels were significantly reduced in the BMDM culture with the rTsP53 protein of 0.1 μg/ml and above. rTsP53 protein concentration and IFN-γ, IL-6 and TNF-α level curves were fit, of which the results showed that rTsP53 protein concentration and IFN-γ, IL-6 and TNF-α levels were significantly negatively correlated, and the coefficients were -0.783, -0.812 and -0.928 respectively (Figure 6).
Figure 6.

Th1 cytokines from the Medium Supernatant of BMDM with Different Concentration of rTsP53. The expression of IFN-γ (A), TNF-α (B) and IL-6 (C) from the Medium Supernatant of BMDM with Different Concentration of rTsP53; the coefficients of IFN-γ (D), TNF-α (E) and IL-6 (F) expressions.
Th2 cytokines from the medium supernatant of BMDM with different concentration of rTsP53
Supernatant IL-4 and IL-13 levels in BMDM culture under the co-culture of different concentrations of rTsP53 protein were compared, in which M0 + IL-4/IL-13 group is not included in the statistical analysis due to the induction by adding exogenous IL-4/IL-13. In the BMDM culture with the rTsP53 protein of 0.1 μg/ml and above, supernatant IL-4 and IL-13 levels were significantly higher than those of M0 cells. rTsP53 protein concentration and IL-4 and IL-13 level curves were fit, of which the results showed that rTsP53 protein concentration and IL-4 and IL13 levels were significantly positively correlated, and the coefficients were 0.865 and 0.872 (Figure 7).
Figure 7.

Th2 Cytokines from the Medium Supernatant of BMDM with Different Concentration of rTsP53. The expression of IL-4 (A) and IL-13 (B) from the Medium Supernatant of BMDM with Different Concentration of rTsP53; the coefficients of IL-4 (C) and IL-13 (D) expression.
Regulatory cytokines from the medium supernatant of BMDM with different concentration of rTsP53
In the co-culture of different concentrations of rTsP53 protein, supernatant IL-10 and TGF-β levels in BMDM culture medium were compared. The supernatant IL-10 and TGF-β levels in culture medium in M0 + IL-4/IL-13 and the BMDM in which different concentrations of rTsP53 protein were added were significantly higher than those in M0 cells; IL-10 level in supernatant culture medium in which 0.001 μg/ml rTsP53 protein was co-cultured was significantly lower than that in M0 + IL-4/IL-13; IL-10 level was significantly higher than that of M0 + IL-4/IL-13 in the BMDM groups with different concentrations of rTsP53 protein. IL-10 level was significantly higher in the BMDM culture with the rTsP53 protein of 0.01 μg/ml and above than that in M0 + IL-4/IL-13; TGF-β level was significantly lower in the BMDM culture with the rTsP53 protein of 0.001 μg/ml and above than that in M0 + IL-4/IL-13, and TGF-β level was significantly higher in the BMDM culture with the rTsP53 protein of 1 μg/ml and above than that in M0 + IL-4/IL-13. rTsP53 protein concentration and IL-10 and TGF-β level curves were fit, and the results showed that rTsP53 protein concentration and IL-10 and TGF-β levels were significantly positively correlated, and the coefficients were 0.871 and 0.899 respectively (Figure 8).
Figure 8.

Regulatory cytokines from the medium supernatant of BMDM with different concentration of rTsP53. The expression of IL-10 (A) and TGF-β (B) from the medium supernatant of BMDM with Different Concentration of rTsP53; the coefficients of IL-10 (A) and TGF-β (B) expression.
Comparison of medium supernatant’s cytokines between M0 + IFN-γ and M0 + IFN-γ + rTsP53 BMDM
Supernatant IL-6, TNF-α, IL-4, IL-13, IL-10 and TGF-β levels in M0 + IFN-γ group and M0 + IFN-γ + rTsP53 protein group were compared, and the results showed that IL-6 and TNF-α levels in M0 + IFN-γ + rTsP53 protein group were significantly lower than those in M0 + IFN-γ group, whereas IL-4 and TGF-β levels were significantly higher than those in M0 + IFN-γ group (Table 1).
Table 1.
The Comparison of Medium Supernatant’s Cytokines between M0 + IFN-γ and M0 + IFN-γ + rTsP53 BMDM
| Index | M0 + IFN-γ group | M0 + IFN-γ + rTsP53 BMDM group |
|---|---|---|
| IL-6 (pg/ml) | 62.45 ± 9.79 | 43.74 ± 3.24* |
| TNF-α (ng/L) | 302.08 ± 8.21 | 278.94 ± 6.84* |
| IL-4 (pg/ml) | 108.19 ± 2.53 | 117.31 ± 3.61* |
| IL-13 (ng/L) | 18.96 ± 1.21 | 21.67 ± 2.20 |
| IL-10 (pg/ml) | 233.59 ± 10.89 | 223.18 ± 7.07 |
| TGF-β (ng/L) | 82.43 ± 2.40 | 99.19 ± 2.87* |
P < 0.01 compared with M0 + IFN-γ group.
Discussion
A variety of risk factors can cause sepsis. Preliminary study shows several possible types of sepsis pathogenesis, including intestinal endotoxemia caused by intestinal mucosal barrier dysfunction, two-hit theory, etc. [3]. But one thing is relatively clear among various hypotheses, namely, it is found that a large number of inflammatory cytokines are released in the body of systemic inflammatory response syndrome (SIRS) patient according to the early research of sepsis, including tumor necrotic factor (TNF), various interleukin (IL), etc. [16]. Therefore, the immune system abnormality has become an important research direction of sepsis in the early stage. Our study prepared, purified and identified HIS·Tag fusion rTsP53 protein. Endotoxin was removed and the protein was finally concentrated. Rat’s polycolonal antibody of rTsP53 was also prepared for further immunological exploration.
In various inflammatory diseases of the body, M1/M2 macrophages often reflect the balance of the body inflammatory/anti-inflammatory response; M1 macrophage and inflammation response clear pathogenic microorganisms away by producing a variety of biologically active substances; M2 macrophage and anti-inflammatory response promote tissue repair and control the inflammation in a certain extent to avoid excessive damage, which might cause compensatory anti-inflammation response syndrome (CARS) if the process was out of control [17]. As the reaction of SIRS and CARS, the excessive activation of either side is not conducive to the prognosis of the host [18].
After 72 h incubation in blank culture medium, cells with PE-CCR7 (-) and FITC-CD206 (-) were extracted and its mean proportion was 92.30 ± 0.22%, which were considered as M0 macrophages. With the stimulation of 20 μg/ml IFN-γ for 72 h, cells with PE-CCR7 (+) were extracted and its mean proportion was 16.24 ± 0.82%, which were considered as M1 macrophages. With the stimulation of IL-3/IL-14 (both 10 μg/ml) for 72 h, cells with FICT-CD206 (+) were extracted and its mean proportion was 87.32 ± 4.29%, which were considered as M2 macrophages. The above characteristics were regarded as one of the classification methods for macrophages.
M1 macrophage is activated mainly by type I inflammatory cytokines such as Interferon-γ (IFN-γ) and TNF-α or the products of pathogenic microorganisms such as lipopolysaccharides (LPS), etc., to generate large amounts of cytokines promoting Th1 immune response such as IL-1/IL-6, IL-23 and other ones [19]. In this study, co-incubation with different dose of rTsP53 (0.001 μg/ml, 0.01 μg/ml, 0.1 μg/ml, 1 μg/ml, 2 μg/ml, 5 μg/ml, 10 μg/ml, respectively) for 72 h, FITC-CD206 (+) macrophage was extracted. The mean proportion in each group was 1.09 ± 0.22%, 2.13 ± 0.13%, 4.91 ± 0.07%, 5.48 ± 0.29%, 9.81 ± 0.06%, 12.83 ± 0.55%, 17.87 ± 0.02%, respectively. The dose of rTsP53 was significantly positive correlated to the proportion of FITC-CD206 (+) macrophage (P < 0.05). The dose-dependent increased proportion indicated that rTsP53 protein could promote the M2 macrophage activation.
M2 macrophages can be divided into a, b and c three types according to their function mechanism, in which M2a macrophage is primarily activated by IL-4 and IL-13, playing a role of facilitating tissue trauma healing by generating the extracellular matrix, and IL-4 and IL-13 are important characteristic cytokines of Th2 immune response [20]. The function of M2a macrophages in killing pathogens is significantly lower than that of M1 macrophages. The M2b macrophages have immune regulation function, which can inhibit the generation of inflammatory cytokines by generating IL-10; M2c macrophages can generate transforming growth factor-β (TGF-β) after the phagocytosis of apoptotic cells, also playing a role of inhibiting inflammatory factors [21]. Therefore, M2 macrophage is an important cell involved in the processes of anti-inflammatory reactions. At present, co-incubation with 20 μg/ml IFN-γ and 5 μg/ml rTsP53 for 72 h, cells with PE-CCR7 (+) were extracted and its mean proportion was 10.60 ± 0.19%. Compared to that of mere co-incubation with IFN-γ, there was significant difference between the two groups (P < 0.05), which suggested that rTsP53 protein could suppress the M1 activation effect induced by IFN-γ.
The activation of M2 macrophages in vivo is likely to play a role in the prevention and treatment of sepsis. However, the parasite infection has serious adverse effects for the host, so the parasitic infection model cannot be simply applied for subsequent studies [22]. As mentioned earlier, the animal model of Trichinella infection shows enhanced Th2 response, and the secreted proteins of Trichinella can have immunosuppression effect in vitro [23]. rTsP53 protein is one kind of secretory protein of Trichinella spiralis, and we have made it clear rTsP53 protein can promote Th2 response of the body by activating M2 macrophages inside the tissue so as to improve inflammatory bowel disease [21]. According to the above studies, we hypothesize rTsP53 protein can also improve the prognosis of sepsis by activating M2 macrophages in vivo, which needs support of further experimental results. And the subcutaneous injection of rTsP53 protein in advance adopted in the early study is not clinically practical, only suggesting the presence of prophylactic effect, and this intervention may lead to the generation of antibody in animals so that it may result in a decline in the intervention effect of protein. In addition, previous studies on rTsP53 protein only direct at animal bodies. Out study showed that Th1 cytokines’ (IFN-γ, IL-6 and TNF-α) level decreased in the culture medium supernatant of BMDM co-incubated with rTsP53. There was negative correlation between the Th1 cytokines’ level and the dose of rTsP53. Both Th2 cytokines (IL-4 and IL-13) and regulatory cytokines in the culture medium increased. There was positive correlation between the Th2 cytokines’ level and the dose of rTsP53. There was also positive correlation between the regulatory cytokines’ level and the dose of rTsP53. Compared to that of BMDM co-incubated with IFN-γ, levels of TNF-α and IL-6 were significant lower than that of BMDM co-incubated with both IFN-γ and rTsP53 (both P < 0.05), while the levels of IL-4 and TGF-β were significant higher (both P < 0.05). There was no significant difference in the levels of IL-13 and IL-10 between the two groups. The cytokines’ profile was consistent with the tendency showed in FCM study. Finally, it is expected that rTsP53 could be used to activate BMDM into M2 macrophage and stop M1 macrophage activation, and it is reasonable to infer that rTsP53 protein might be applied in the treatment for early stage sepsis.
Acknowledgements
This work was supported by scientific research projects, Bureau of science and Information Technology, Guangzhou (2013000001600) and Open-end fund, National key laboratory of trauma, burn and compound wounds, The 3rd Military Medical University (SKLKF201201).
Disclosure of conflict of interest
None.
References
- 1.Lavie D. The functional groupings of alpha-elaterin (cucurbitacin E) J Pharm Pharmacol. 1958;10:782. doi: 10.1111/j.2042-7158.1958.tb10375.x. [DOI] [PubMed] [Google Scholar]
- 2.Huang WW, Yang JS, Lin MW, Chen PY, Chiou SM, Chueh FS, Lan YH, Pai SJ, Tsuzuki M, Ho WJ, Chung JG. Cucurbitacin E Induces G(2)/M Phase Arrest through STAT3/p53/p21 Signaling and Provokes Apoptosis via Fas/CD95 and Mitochondria-Dependent Pathways in Human Bladder Cancer T24 Cells. Evid Based Complement Alternat Med. 2012;2012:952762. doi: 10.1155/2012/952762. [DOI] [PMC free article] [PubMed] [Google Scholar]
- 3.Hsu YC, Huang TY, Chen MJ. Therapeutic ROS targeting of GADD45gamma in the induction of G2/M arrest in primary human colorectal cancer cell lines by cucurbitacin E. Cell Death Dis. 2014;5:e1198. doi: 10.1038/cddis.2014.151. [DOI] [PMC free article] [PubMed] [Google Scholar]
- 4.Alkhalidi H, Kfoury H. Status of mismatch repair genes hMSH2 and hMSH6 in colorectal cancer in Saudi patients: an immunohistochemical analysis. East Mediterr Health J. 2012;18:1114–1117. doi: 10.26719/2012.18.11.1114. [DOI] [PubMed] [Google Scholar]
- 5.Yan M, Zhu L, Yang Q. Infection of porcine circovirus 2 (PCV2) in intestinal porcine epithelial cell line (IPEC-J2) and interaction between PCV2 and IPEC-J2 microfilaments. Virol J. 2014;11:193. doi: 10.1186/s12985-014-0193-0. [DOI] [PMC free article] [PubMed] [Google Scholar]
- 6.Mylona E, Zarogiannos A, Nomikos A, Giannopoulou I, Nikolaou I, Zervas A, Nakopoulou L. Prognostic value of microsatellite instability determined by immunohistochemical staining of hMSH2 and hMSH6 in urothelial carcinoma of the bladder. APMIS. 2008;116:59–65. doi: 10.1111/j.1600-0463.2008.00760.x. [DOI] [PubMed] [Google Scholar]
- 7.Zhu B, Li X, Zhang Y, Ye C, Wang Y, Cai S, Huang H, Cai Y, Yeh S, Huang Z, Chen R, Tao Y, Wen X. Cross-talk of alpha tocopherol-associated protein and JNK controls the oxidative stress-induced apoptosis in prostate cancer cells. Int J Cancer. 2013;132:2270–2282. doi: 10.1002/ijc.27927. [DOI] [PubMed] [Google Scholar]
- 8.Platz EA, Tangen CM, Goodman PJ, Till C, Parnes HL, Figg WD, Albanes D, Neuhouser ML, Klein EA, Lucia MS, Thompson IM Jr, Kristal AR. Statin drug use is not associated with prostate cancer risk in men who are regularly screened. J Urol. 2014;192:379–384. doi: 10.1016/j.juro.2014.01.095. [DOI] [PMC free article] [PubMed] [Google Scholar]
- 9.Roach M 3rd, Thomas K. Overview of randomized controlled treatment trials for clinically localized prostate cancer: implications for active surveillance and the United States preventative task force report on screening? J Natl Cancer Inst Monogr. 2012;2012:221–229. doi: 10.1093/jncimonographs/lgs039. [DOI] [PMC free article] [PubMed] [Google Scholar]
- 10.Sridhar SS, Hotte SJ, Chin JL, Hudes GR, Gregg R, Trachtenberg J, Wang L, Tran-Thanh D, Pham NA, Tsao MS, Hedley D, Dancey JE, Moore MJ. A multicenter phase II clinical trial of lapatinib (GW572016) in hormonally untreated advanced prostate cancer. Am J Clin Oncol. 2010;33:609–613. doi: 10.1097/COC.0b013e3181beac33. [DOI] [PubMed] [Google Scholar]
- 11.Vageli DP, Giannopoulos S, Doukas SG, Kalaitzis C, Giannakopoulos S, Giatromanolaki A, Koukoulis GK, Touloupidis S. Mismatch repair hMSH2, hMLH1, hMSH6 and hPMS2 mRNA expression profiles in precancerous and cancerous urothelium. Oncol Lett. 2013;5:283–294. doi: 10.3892/ol.2012.979. [DOI] [PMC free article] [PubMed] [Google Scholar]
- 12.Zu K, Martin NE, Fiorentino M, Flavin R, Lis RT, Sinnott JA, Finn S, Penney KL, Ma J, Fazli L, Gleave ME, Bismar TA, Stampfer MJ, Pollak MN, Loda M, Mucci LA, Giovannucci E. Protein expression of PTEN, insulin-like growth factor I receptor (IGF-IR), and lethal prostate cancer: A prospective study. Cancer Epidemiol Biomarkers Prev. 2013;22:1984–1993. doi: 10.1158/1055-9965.EPI-13-0349. [DOI] [PMC free article] [PubMed] [Google Scholar]
- 13.Kondo Y, Hollingsworth EF, Kondo S. Molecular targeting for malignant gliomas (Review) Int J Oncol. 2004;24:1101–1109. [PubMed] [Google Scholar]
- 14.Fisman EZ, Adler Y, Tenenbaum A. Biomarkers in cardiovascular diabetology: interleukins and matrixins. Adv Cardiol. 2008;45:44–64. doi: 10.1159/000115187. [DOI] [PubMed] [Google Scholar]
- 15.Du L, Wei H, Li L, Shan H, Yu Y, Wang Y, Zhang G. Regulation of recombinant Trichinella spiralis 53-kDa protein (rTsP53) on alternatively activated macrophages via STAT6 but not IL-4Ralpha in vitro. Cell Immunol. 2014;288:1–7. doi: 10.1016/j.cellimm.2014.01.010. [DOI] [PubMed] [Google Scholar]
- 16.Wu SL, Jones E, Gulley JL, Arlen PM, Chen CC, Figg WD, Dahut WL. Routine interval computed tomography to detect new soft-tissue disease might be unnecessary in patients with androgen-independent prostate cancer and metastasis only to bone. BJU Int. 2007;99:525–528. doi: 10.1111/j.1464-410X.2006.06654.x. [DOI] [PubMed] [Google Scholar]
- 17.Theyer G, Ulsperger E, Baumgartner G, Raderer M, Hamilton G. Prolonged response to a single androgen suppression phase in a subpopulation of prostate cancer patients. Ann Oncol. 2000;11:877–881. doi: 10.1023/a:1008347801886. [DOI] [PubMed] [Google Scholar]
- 18.Xu G, Feng L, Yao M, Wu J, Guo L, Yao X, Zhao L, Xu H, Wu R. A new 5-grading score in the diagnosis of prostate cancer with real-time elastography. Int J Clin Exp Pathol. 2014;7:4128–4135. [PMC free article] [PubMed] [Google Scholar]
- 19.Werahera PN, Sullivan K, La Rosa FG, Kim FJ, Lucia MS, O’Donnell C, Sidhu RS, Sullivan HT, Schulte B, Crawford ED. Optimization of prostate cancer diagnosis by increasing the number of core biopsies based on gland volume. Int J Clin Exp Pathol. 2012;5:892–899. [PMC free article] [PubMed] [Google Scholar]
- 20.Hoeks CM, Somford DM, van Oort IM, Vergunst H, Oddens JR, Smits GA, Roobol MJ, Bul M, Hambrock T, Witjes JA, Futterer JJ, Hulsbergen-van de Kaa CA, Barentsz JO. Value of 3-T multiparametric magnetic resonance imaging and magnetic resonance-guided biopsy for early risk restratification in active surveillance of low-risk prostate cancer: A prospective multicenter cohort study. Invest Radiol. 2014;49:165–172. doi: 10.1097/RLI.0000000000000008. [DOI] [PubMed] [Google Scholar]
- 21.Xie SW, Li HL, Du J, Xia JG, Guo YF, Xin M, Li FH. Contrast-enhanced ultrasonography with contrast-tuned imaging technology for the detection of prostate cancer: comparison with conventional ultrasonography. BJU Int. 2012;109:1620–1626. doi: 10.1111/j.1464-410X.2011.10577.x. [DOI] [PubMed] [Google Scholar]
- 22.Polesel J, Gini A, Dal Maso L, Stocco C, Birri S, Taborelli M, Serraino D, Zucchetto A. The negative impact of tobacco smoking on survival after prostate cancer diagnosis. Cancer Causes Control. 2015;26:1299–305. doi: 10.1007/s10552-015-0624-2. [DOI] [PubMed] [Google Scholar]
- 23.Kenfield SA, Stampfer MJ, Giovannucci E, Chan JM. Physical activity and survival after prostate cancer diagnosis in the health professionals follow-up study. J. Clin. Oncol. 2011;29:726–732. doi: 10.1200/JCO.2010.31.5226. [DOI] [PMC free article] [PubMed] [Google Scholar]