

Abstract:
The purpose of this study was to compare the variation in hemoglobin (Hgb) values among various point-of-care (POC) analyzers available on the market. Eight analyzers (Gem 3000, ABL 720, ABL 77, Rapidpoint 405, IL 682, GemOPL, Hb 201+, and manual/centrifugation) were compared with the Hgb values from the Beckman Coulter LH750. A total of 72 patient samples were analyzed on each test instrument. The samples were obtained after intubation, after heparinization, during cardiopulmonary bypass, and after protamine administration. Four of the samples were excluded from the study because of delayed sample analysis. The calculated mean differences of reference test method Hgb (mean ± SD) for all samples (n = 68) were Gem 3000 = 1.431 ± 0.396 g/dL; ABL 720 = −0.224 ± 0.240 g/dL; ABL 77 = 0.341 ± 0.578 g/dL; Rapidpoint 405 = 0.001 ± 0.205 g/dL; IL 682 = −0.137 ± 0.232 g/dL; GemOPL = 0.774 ± 0.427 g/dL; Hb 201+ = 0.110 ± 0.524 g/dL; and manual/centrifugation = 0.547 ± 0.499 g/dL. Cumulative results indicated that the bias in Hgb values from the Gem 3000, ABL720, ABL 77, IL 682, GemOPL, and the manual method were statistically significant (p < .05), compared with the Coulter LH750. Additionally, only the Rapidpoint 405 and Hb 201+ most closely matched the values from the Coulter LH750 (p > .05). Some of the methodologies have previously been shown to be affected during hemodilution, hypoproteinemia, and/or after blood transfusion. There is variability among methodologies, which can give rise to statistically different Hgb values, and one should consider the “ideal” instrument based on this and many other factors. Based on our results, the rank order of closest approximation to the Coulter LH750 measurement was Rapidpoint 405, Hb 201+, IL 682, ABL 720, ABL 77, manual/centrifugation, GemOPL, and Gem 3000.
Keywords: point-of-care, hemoglobin, hematocrit, conductivity, adjusted-conductivity, photometric, hemodilution, cardiopulmonary bypass, transfusion, blood conservation
In the last 20 years, novel technologies have allowed the invention of miniaturized sensors and development of analyzers designed for point-of-care testing (POCT). They have provided portability and ease-of-use needed by point-of-care (POC) with the accuracy and precision of traditional instrumentations (1). The cost associated with POCT is greater than traditional systems, but the increased cost may be offset by improvements in the management of patient care, improvement in patient outcomes, and decreased use of the health care system (2–5). Additionally, studies have shown a positive clinical impact of using POCT consistently associated with positive economic impact (6–8). Today, POCT devices are increasingly used in the delivery of care and therapeutic decision making in critical areas such as cardiac arenas for its rapid turnaround time (2–4,9–13). However, a faster result is not necessarily an equivalent to a traditional laboratory result. There are preanalytic, analytic, and postanalytic factors that can influence the quality of POCT result, which may lead to misinterpretation (7).
In the cardiac surgery arena, POCT for blood hemoglobin and hematocrit (H/H) parameters provides clinicians rapid patient assessment including the need for transfusion. Studies have shown that conductivity-based methods of blood H/H determinations are influenced by plasma protein concentration (14–17), which are otherwise accurate under normal conditions (18–21). Studies have also shown that H/H assessment by different test methods, such as centrifugation, may be significantly affected during hemodilution, red cell damage caused by cardiopulmonary bypass (CPB), and after blood transfusion (15,22). Photometry and adjusted-conductivity are additional methods used to quantify hemoglobin (Hgb) content of whole blood (22).
One of the most discussed issues in almost all surgeries is blood transfusion. Among all the surgical areas, cardiac surgeries are the ones most often associated with coagulopathy, blood loss, and the need for transfusions (23–25). Regardless of recent advances in blood conservation techniques, up to 30%–80% of patients undergoing cardiac operation need allogeneic blood transfusions, resulting in two- to four-donor exposure per patient (26,27). In fact, 10% of all blood transfusions in the United States are associated with coronary artery bypass grafting (CABG) (28,29). The resultant transfusions are not only a major burden on blood banking organizations but also constitute a risk for each patient receiving allogeneic blood products (23,30). Risks associated with blood transfusions have been well documented (23,30–33). Evidence-based medicine dictates all health care workers to avoid unnecessary use of blood and the associated complications (31). Inaccuracies in H/H values in POCT devices can lead to inappropriate red cell transfusion. Clinically unnecessary transfusions can expose patients to an increase in morbidity. This increase in morbidity can have a tremendous impact on patient outcomes and greatly increase financial liability.
The aim of this study was to compare the variation in Hgb values among various POC analyzers, including our current blood gas/Hgb analyzer, the Gem Premier 3000, and to compare the per-test cost between them. The accuracy of conductivity, adjusted conductivity, and photometric and centrifugation methods of measuring Hgb were evaluated with Hgb values from the Beckman Coulter LH750. The Coulter LH750 uses the cyanmethemoglobin method, which is considered the reference method for measuring Hgb by the International Committee for Standardization in Hematology (ICSH) (34,35). It is the method that ICSH recommends against which all new Hgb methods are judged and standardized. We evaluated the relative accuracy of different methods of assessing Hgb among eight of most common analyzers/methods used in POCT. Hemoglobin was assessed intraoperatively under clinical conditions that included euvolemia, hemodilution, and red cell transfusion.
MATERIALS AND METHODS
Design
A prospective patient series design was chosen for this particular study so that the study could be performed within a stricter and tighter controlled environment. The analyzers were chosen based on how common they were in the marketplace and the feasibility of obtaining them from the manufacturer for an evaluation at no cost. The sample analysis on the Gem 3000 and the Beckman Coulter LH750 were the only in-house analyzers and direct cost for this study. There were no monetary compensation and/or incentives from any manufacturer to perform this study.
Patient Selection
The study was conducted at Memorial Hermann Baptist Hospital, a 411-bed hospital with a 26-bed medical/surgical intensive care unit covering treatment that includes, but is not limited to, cardiovascular, neurosurgical and trauma subspecialty care. All patients undergoing heart surgery during the period between July 27, 2005 and August 19, 2005 were included. After obtaining institutional review board approval from our institution, H/H analysis of 72 blood samples from six open heart surgery patients was performed. Any patient, regardless of age, sex, and type of procedure requiring open heart surgery and undergoing CPB, was considered to be eligible to participate in this study. Four samples were excluded because of laboratory analysis delays. All sample results were kept confidential, and the 1996 Health Insurance Portability and Accountability Act (HIPPA) regulations were followed.
Perfusion Technique
The pump prime was composed of 2000 mL of Plasmalyte balanced salt solution (Baxter Healthcare, Deerfield, IL), which was mostly removed with the use of antegrade/retrograde autologous priming techniques upon initiation. Net priming volume resulted in 600 mL of Plasmalyte, to which 12.5 g of mannitol and 10,000 units of heparin were added. Additional pharmacologic agents/fluids were used at the discretion of the perfusionist. Sucker blood from the operative field was diverted to the C.A.T.S. cell saver unit (Terumo Cardiovascular Systems, Ann Arbor, MI) and subsequently returned to the circuit.
Data Collection and Sampling Technique
Each sample was drawn using a Portex dry lithium heparinized syringe (Smiths Medical, St. Paul, MN), which was analyzed on eight instruments (Table 1) and compared to the Beckman Coulter LH750 (Beckman Coulter, Fullerton, CA) as a reference. The test analysis were performed on each of the instruments randomly from the same sample, and appropriate sampling methods and techniques were practiced to obtain the most accurate results to avoid bias in order of sampling.
Table 1.
Instrumentation and methodology.
| Instrument | Name | Manufacturer | Hemoglobin Methodology |
|---|---|---|---|
| Reference | Coulter LH750 | Beckman Coulter (Fullerton, CA) | Photometry |
| 1 | Gem Premier 3000 | Instrumentation Laboratory (Lexington, MA) | Adjusted conductivity |
| 2 | ABL 720 | Radiometer America (Westlake, OH) | Photometry |
| 3 | ABL 77 | Radiometer America (Westlake, OH) | Adjusted conductivity |
| 4 | Rapidpoint 405 | Bayer Healthcare LLC Diagnostics (Tarrytown, NY) | Photometry |
| 5 | IL 682 | Instrumentation Laboratory (Lexington, MA) | Photometry |
| 6 | GemOPL | Instrumentation Laboratory (Lexington, MA) | Photometry |
| 7 | Hb 201+ | HemoCue (Lake Forest, CA) | Photometry |
| 8 | Manual | N/A | Centrifugation |
N/A, not applicable.
Samples were drawn before each patient was heparinized, before initiation of CPB, after heparinization, during CPB, and after protamine. Both arterial and venous samples were drawn during CPB. Depending on the instrument, one of the parameters, either Hgb or hematocrit (Hct), was calculated using the manufacturer factor or the “rule of 3.” Conductivity, adjusted conductivity, photometric, and centrifugation were the four test methodologies that were evaluated. The centrifugation Hct/manual spun Hct was performed in duplicate, and the average value was divided by three to convert to Hgb. This calculation corresponds similarly to methods incorporated into conductivity and adjusted conductivity devices. For purposes of this study, the manual/centrifugation method will be referred to as an analyzer and/or an instrument. The analyzers in the tables and figures were listed in a random fashion.
Fifteen milliliters of a blood sample was obtained after prepping the patient and post-heparinization (time A), during CPB (time B), and post-protamine/post-pump (time C). Times B and C included addition of banked blood products, crystalloid fluids, and/or cell-salvaged blood from the cell saver. Sample analyses were performed immediately after obtaining the samples. The samples were continuously mixed until analysis was completed on all instruments. The order for sampling for the test instruments was random. There was no particular pattern that was followed to analyze the samples on the test instruments. Samples for the Coulter LH750 were injected into a purple Vacutainer tubes with EDTA (Becton Dickinson, Franklin Lakes, NJ) and sent to the hospital’s central laboratory. These samples were analyzed on the Coulter LH750 within the recommended time of 4 hours. The site of sample collection for times A and C was from an indwelling radial arterial line. These samples were drawn after wasting an initial 10 mL of blood to avoid any dilutional bias. The site of sample collection for time B was from a manifold, which was directly connected to a continuous arterial filter purge line. These samples were drawn after withdrawing and reintroducing 5 mL of blood. Appropriate quality control materials were used for each of the devices according to the manufacturer’s recommendations and were confirmed to be operating within manufacturer’s established calibration and maintenance protocols. All study samples were performed within 6 hours of quality control testing. The Coulter LH750 was calibrated against the manufacturer’s reference standard. All instruments were set-up in the perfusion pump room, which is directly connected to the cardiovascular operating room, in a linear fashion. Sample analysis was initiated within seconds from the time the sample was obtained, and the time needed for each sample to be performed on all analyzers was <5 minutes.
Per-test cost for each individual analyzer was calculated based on the cost of the analyzer and all disposables at the time of study. For the purpose of this analysis, per-test cost was based on 400 tests for all instruments, except the Gem 3000 because of the availability of a test cartridge from the manufacturer (450 tests).
The original test strips from each of the instruments were saved with unique identifiers and later documented on an Excel spreadsheet (Microsoft, Redmond, WA). Two individuals verified each of the test results to avoid any errors in data management. Of the total 72 samples that were analyzed, only 68 were considered for this study. Four of the Coulter samples were accidentally left out past the 4-hour turnover requirement and were deemed inappropriate for the analysis.
Statistical Analysis
Bias was calculated for each test method by reference Hgb–test method Hgb. Percentage differences from the Coulter Hgb was calculated by [(Coulter Hgb – test method Hgb)/Coulter Hgb] × 100. The mean, SD, SE, and 95% confidence interval (CI) for each of the analyzers were performed. In addition, the mean difference, SD, SE, and 95% CI were also performed for each comparison (test analyzer vs. reference analyzer). The bias values for all instruments were compared using a factorial analysis of variance (ANOVA for repeated measures). Betweeninstrument differences were subsequently determined using paired t test analysis (test analyzer vs. reference analyzer). These differences were further stratified by prepump, on-pump, and post-pump to determine whether time of event was a factor.
Coulter Hgb served as reference standard in each of the scatter plots. All statistical analyses were performed using the STATA 9 statistical software (StataCorp LP, College Station, TX). A p < .05 was considered to be statistically significant.
RESULTS
A total of 612 analyses were performed on 68 patient samples. The range of Hgb for all samples was 6.8–15.3 g/dL, whereas the range of Hgb for the reference analyzer was 8.1–13.9 g/dL. The Hgb mean values for each of the analyzers are shown in Table 2, and the Hgb mean difference (bias) values for each of the test analyzers are shown in Table 3 and Figures 1 and 2. A bias scatter-plot for the reference analyzer to each of the test analyzer is depicted in Figures 310. All these values were statistically significant compared with the reference analyzer except for the Rapidpoint 405 and Hb 201+ (p < 0.05, ANOVA, paired t test). The mean difference (bias) values, when stratified by time of sample (Figure 11), resulted in a statistical difference (Table 4) in all analyzers except for Rapidpoint 405, Hb 201+, and ABL 77 (pre-pump, n = 10); Rapidpoint 405 and Hb 201+ (on-pump, n = 52); and Rapidpoint 405, Hb 201+, ABL 77, and IL 682 (post-pump, n = 6).
Table 2.
Summary of mean hemoglobin (g/dL), SE, SD, and 95% CI for each of the instruments, including the reference (Coulter LH750) for all 68 samples.
| Instrument | Mean | SE | SD | 95% CI |
|---|---|---|---|---|
| Coulter LH750 | 10.1 | 0.154363 | 1.272909 | 9.791890–10.40811 |
| Gem 3000 | 8.669118 | 0.1849739 | 1.525334 | 8.299908–9.038327 |
| ABL 720 | 10.32353 | 0.1541797 | 1.271398 | 10.01579–10.63127 |
| ABL 77 | 9.758824 | 0.2007693 | 1.655586 | 9.358086–10.15956 |
| Rapidpoint 405 | 10.09853 | 0.1558135 | 1.284871 | 9.787524–10.40953 |
| IL 682 | 10.23676 | 0.1659953 | 1.368833 | 9.905437–10.56809 |
| GemOPL | 9.326471 | 0.1408088 | 1.161139 | 9.045415–9.607526 |
| Hb 201+ | 9.989706 | 0.161834 | 1.334518 | 9.666684–10.31273 |
| Manual | 9.552941 | 0.1662539 | 1.370964 | 9.221097–9.884785 |
Table 3.
Summary of mean hemoglobin difference (g/dL), SE, SD, and 95% CI for each of the instruments, against the reference (Coulter LH750) for all 68 samples.
| Instrument | Mean Difference | SE | SD | 95% CI |
|---|---|---|---|---|
| Gem 3000 | 1.430882 | 0.0480186 | 0.3959712 | 1.335037–1.526728 |
| ABL 720 | −0.223529 | 0.0291162 | 0.240098 | −0.2816455 to −0.1654133 |
| ABL 77 | 0.341177 | 0.0701258 | 0.5782722 | 0.2012048–0.4811482 |
| Rapidpoint 405 | 0.001471 | 0.0248342 | 0.2047879 | −0.0480986–0.0510399 |
| IL 682 | −0.136765 | 0.0281804 | 0.2323818 | −0.1930131 to 0.0805163 |
| GemOPL | 0.773529 | 0.0517311 | 0.4265858 | 0.6702737–0.8767852 |
| Hb 201+ | 0.110294 | 0.0635205 | 0.5238035 | −0.0164933–0.2370817 |
| Manual | 0.547059 | 0.0605241 | 0.4990949 | 0.4262521–0.6678655 |
Figure 1.
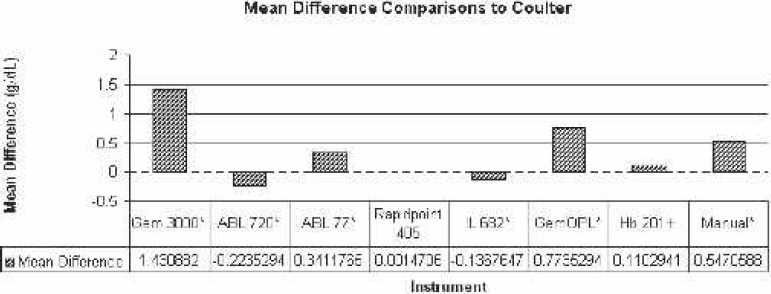
Comparison of mean difference to Coulter LH750 (reference). *Statistically significant difference.
Figure 2.
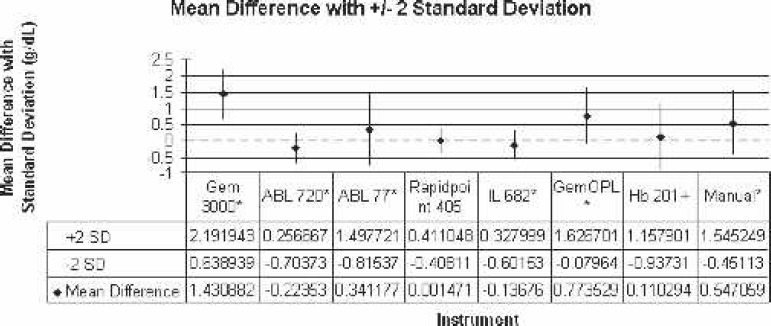
Comparison of mean difference to Coulter LH750 (reference) with ±2 SD. *Statistically significant difference.
Figure 3.
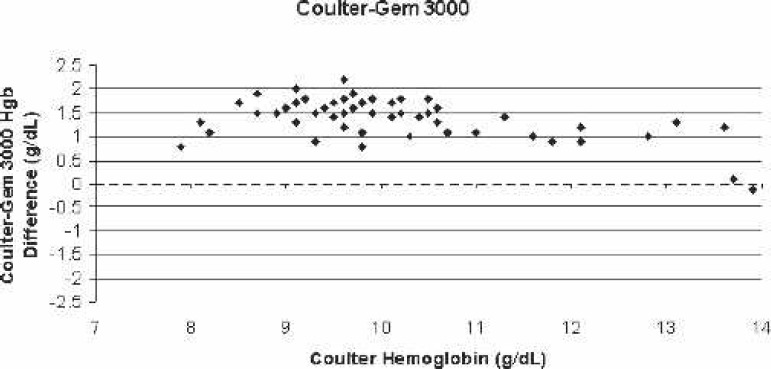
Scatter-plot of Coulter LH750 (reference)–Gem 3000 bias for all blood samples vs. the corresponding Coulter hemoglobin.
Figure 4.
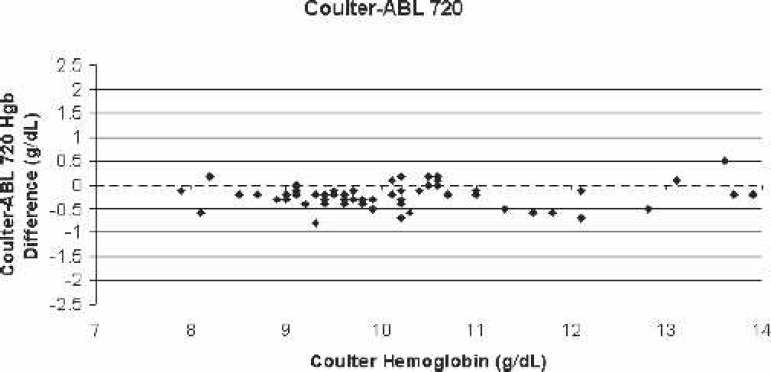
Scatter-plot of Coulter LH750 (reference)–ABL 720 bias for all blood samples vs. the corresponding Coulter hemoglobin.
Figure 5.
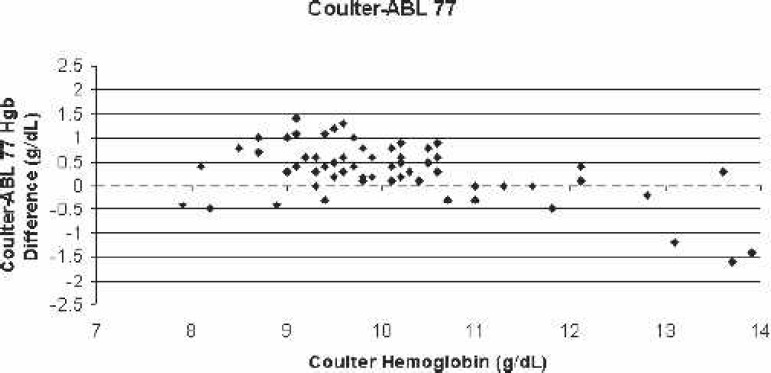
Scatter-plot of Coulter LH750 (reference)–ABL 77 bias for all blood samples vs. the corresponding Coulter hemoglobin.
Figure 6.
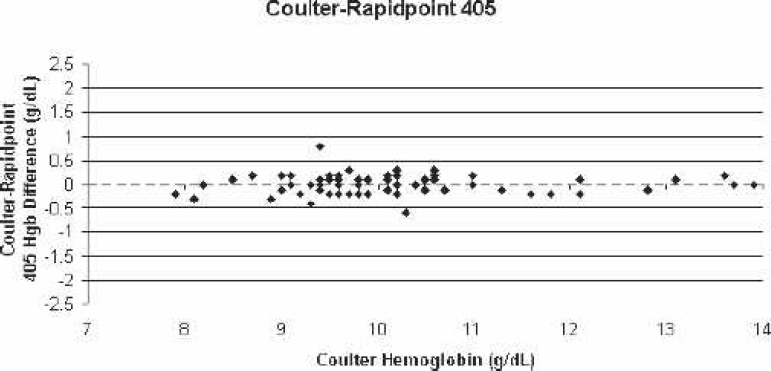
Scatter-plot of Coulter LH750 (reference)–Rapidpoint 405 bias for all blood samples vs. the corresponding Coulter hemoglobin.
Figure 7.
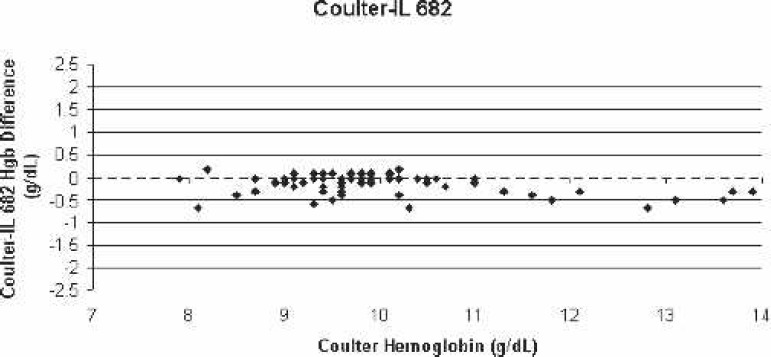
Scatter-plot of Coulter LH750 (reference)–IL 682 bias for all blood samples vs. the corresponding Coulter hemoglobin.
Figure 8.
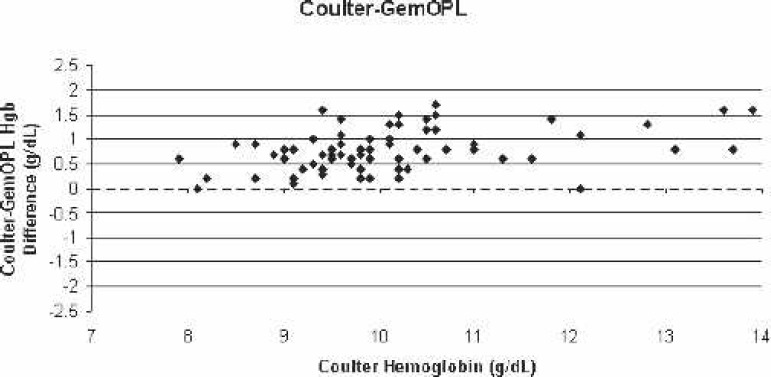
Scatter-plot of Coulter LH750 (reference)–GemOPL bias for all blood samples vs. the corresponding Coulter hemoglobin.
Figure 9.
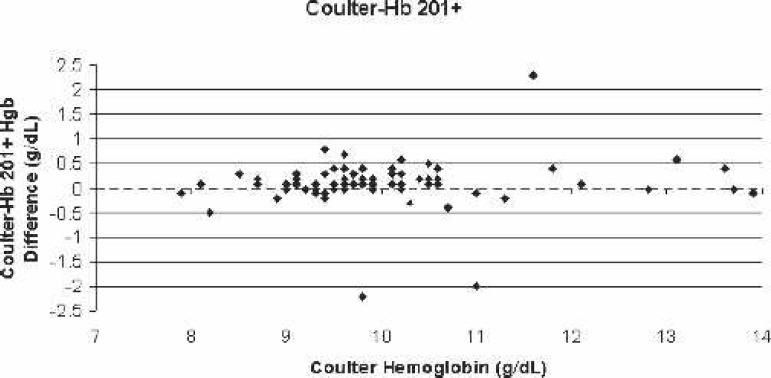
Scatter-plot of Coulter LH750 (reference)–Hb 201+ bias for all blood samples vs. the corresponding Coulter hemoglobin.
Figure 10.
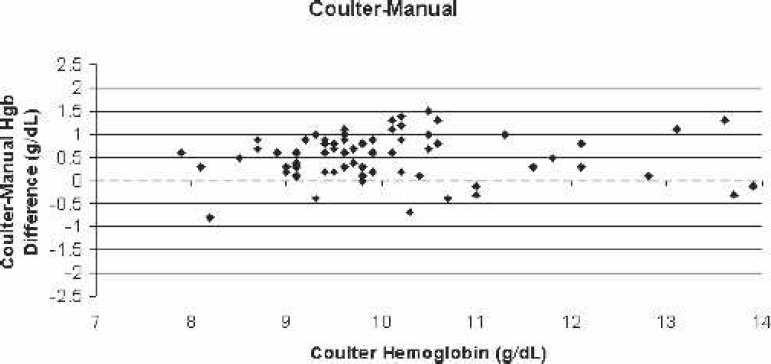
Scatter-plot of Coulter LH750 (reference)–manual centrifugation bias for all blood samples vs. the corresponding Coulter hemoglobin.
Figure 11.
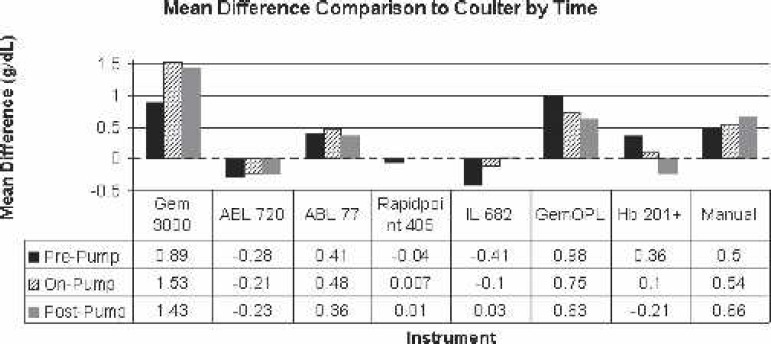
Comparison of mean difference to Coulter LH750 (reference) by time (pre-pump, on-pump, and post-pump).
Table 4.
p value comparisons for overall sample and stratified by time to the reference instrument (Coulter LH750).
| Instrument | Pre-Pump (n = 10) | On-Pump (n = 52) | Post-Pump (n = 6) | Cumulative (n = 68) |
|---|---|---|---|---|
| Gem 3000 | 0.0003 | 0.0000 | 0.0001 | 0.0000 |
| ABL 720 | 0.0432 | 0.0000 | 0.0250 | 0.0000 |
| ABL 77 | 0.1105 | 0.0000 | 0.1077 | 0.0000 |
| Rapidpoint 405 | 0.3994 | 0.8015 | 0.8220 | 0.9530 |
| IL 682 | 0.0000 | 0.0012 | 0.4650 | 0.0000 |
| GemOPL | 0.0002 | 0.0000 | 0.0014 | 0.0000 |
| Hb 201+ | 0.1513 | 0.0665 | 0.6123 | 0.0871 |
| Manual | 0.0161 | 0.0000 | 0.0063 | 0.0000 |
p < .05 was considered to be statistically significant (paired t test analysis); n: sample size for each stratified time.
To simplify matters, the percentage difference from the reference Hgb was determined for each analyzer. The actual value percentage difference for each analyzer was Gem 3000 = 14.57% ± 4.51%; ABL 720 = −2.26% ± 2.33%; ABL 77 = 3.73% ± 5.56%; Rapidpoint 405 = 0.01% ± 2.11%; IL 682 = −1.30% ± 2.31%; GemOPL = 7.56% ± 3.92%; Hb 201+ = 1.05% ± 4.98%; and manual/centrifugation = 5.48% ± 4.94%. According to the magnitude of mean Hgb variance of each of the analyzer to the reference, the following is the overall ranking from the least to the greatest: Rapidpoint 405, Hb 201+, IL 682, ABL 720, ABL 77, manual/centrifugation, GemOPL, and Gem 3000 (Figure 12).
Figure 12.
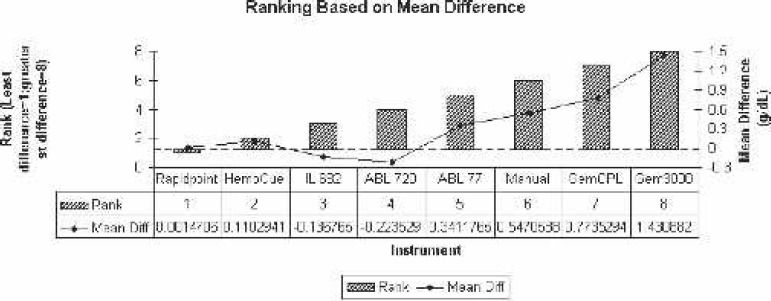
Ranking based on mean difference comparison to Coulter LH750 (reference). Diff., difference.
Our cumulative results indicated that the bias in Hgb values from the Gem 3000, ABL720, ABL 77, IL 682, GemOPL, and the manual method were statistically significant (p < .05) compared with the Coulter LH750. Of the eight analyzers evaluated, only the Rapidpoint 405 and Hb 201+ most closely matched (statistically non-significant differences) the values from the Coulter LH750 (p > .05). This led us to study the per-test and analyzer cost for each of the test instruments (Figure 13). The per-test and analyzer cost ranged from $0.02 to $3.67 and $800 to $15,040, respectively. The average per-test and analyzer cost was $1.65 and $10,688, respectively, for all instruments, whereas the average per-test and analyzer cost was $2.00 and $13,738, respectively, excluding the centrifugation and Hb201+ and $2.43 and $14,633, respectively, for the Gem 3000, ABL720, ABL 77, and Rapidpoint 405.
Figure 13.
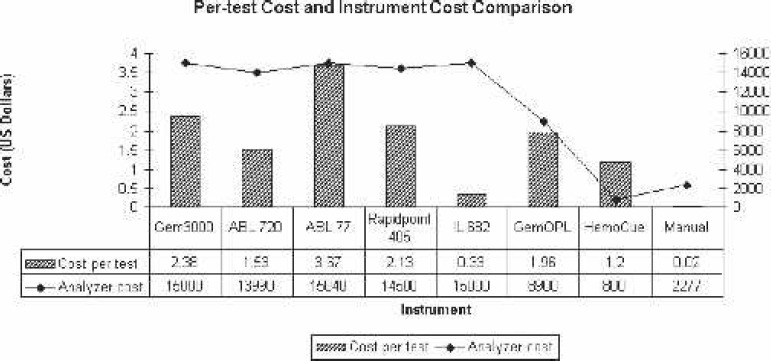
Per-test cost and analyzer cost comparisons. Gem 3000 comes with a 5-year warranty, whereas most of the others listed come with 0–2 years; Gem 3000s cost is based on 450 tests, whereas all other throughput-dependent analyzers are based on 400 tests/mo; GemOPL, HemoCue, and manual methods are non–throughput-dependent; ABL 720 analyzer costs are based on refurbished units (new unit no longer available).
DISCUSSION
One of the most rapid and significant transformations in the clinical setting that has evolved from physiologic research is the development of integrated blood analyzers, and even further so, the development of POC or bedside testing analyzers. As clinicians, we take for granted the ability to measure many of the parameters that are necessary in the cardiac arena with not only high accuracy and precision, but also quickly (36). Today, POCT has evolved from the demand of rapid turnaround time for analytical information (9). A recent study reported that laboratory analysis comprised ∼43% of the data used by critical care clinicians to make clinical decisions (3). Gutierres and Welty (2) recently showed the positive impact of POCT, by itself, on patient care and outcomes. It has been clearly shown that POCT has a positive benefit on morbidity and mortality. The cost of POCT is greater than traditional testing; however, the increased cost is often offset by decrease in overall cost of health care (2,5).
We compared various Hgb analyzers with the use of the laboratory’s traditional Coulter Counter, the LH750, for the evaluation of Hgb concentration among our open heart patients. Although we expected some variability in the results we obtained, we were greatly surprised to see such a strong statistical difference. It is very important to note that there are variations in methodology and the measuring capacity of each of the instruments, especially in the case of the Hb 201+ and centrifugation. The latter two analyzers are specific for only measuring H/H, whereas the other instruments have the capacity of resulting various other parameters. The GemOPL and IL682 are also very similar in that they only have the capacity of CO-Oximetry measurements, whereas the Gem 3000, ABL 720, ABL 77, and Rapidpoint 405 have the capability of Hgb values and a complete blood gas profile, including electrolyte measurements. Another important factor to consider, especially in cardiac arena setting, is that the Gem 3000, ABL 720, and Rapidpoint 405 were the only analyzers capable of measuring blood glucose levels. The latter three instruments give the user many different configurations to choose from. Only the ABL 720 and Rapidpoint 405 have automated quality control capabilities. Noteworthy is that the per-test cost is throughput dependent for all of the test analyzers except for the Hb201+, GemOPL, and centrifugation. Analysis of cost-benefit ratio on a per-test basis in a generalized manner is difficult because it is important for each hospital to evaluate this based on its individual circumstance (8). There are many factors to consider when basing a decision on per-test costs, such as number of samples (volume), length of warranty (Gem 3000 comes with a 5-year warranty, whereas others are 1–2 years), cost of controls, quality control automation, maintenance interventions, downtime needed for internal checks and start-up, and ease of use.
One of the areas where there may have been some uncontrolled error is in the technique used for sample mixing. Extreme caution was taken to mix the sample before it was analyzed on each of the instruments; however, because we did not use an automated mixer, there remains a question of error regarding this issue. An additional limitation of this study is that we did not separately address the effects of hemodilution, transfusions, and/or hypoproteinemia on different test methodologies; however, many studies have shown that certain methodologies in POC analyzers have sensitivity to changes in serum proteins and electrolytes caused by hemodilution (14,16,17). Photometric method of Hgb assessment has been shown to be more accurate than either corrected or uncorrected conductivity Hgb determination (16). However, Hgb determinations by photometric methods have also shown to be affected by leukocytosis and lipemic samples (37). Additionally, conductivity-based Hct determinations have been shown to report falsely low readings in situations where plasma has been replaced by crystalloid, such as inpatients who have received large transfusions of processed autologous blood (17). Therefore, based on our results and suggestions from previous studies, H/H measurements in patients with suspected hypoproteinemia or considerable hemodilution should be tested with non–conductivity-derived analyzers. Because the LH750 and the test analyzer specimens were collected at the same time, dynamic fluid or whole blood shifts should not have biased our results. The limitation of manual centrifugation method was three-fold in that we used the “rule of 3” to convert the Hct result to Hgb, the potential of parallax error caused by reading at various angles, and the fact that studies have shown that spun Hct gives values that are ∼1.5%–3.0% higher because of the plasma that is trapped in the red blood cell (RBC) layer; if abnormal RBCs are present, this bias is even larger (37). Another possible limitation was the patient sample size. We preferred to have had ∼25 patients; however, because of the difficulty in retaining all the test analyzers over 3 weeks coupled with great variability in case load during the study period, we were unsuccessful in meeting our goal. This limitation caused us to obtain a small sample size when stratified by time. These issues need to be addressed to a greater extent, and a large multi-center study, which incorporates the effects of hemodilution/serum protein changes, is necessary.
One of the detractions of CPB is hemodilution and subsequent necessity of blood component replacement (14). As a perfusionist, these detractions are of great importance, especially with the role in the cardiac arena. The type of analyzer that is chosen is of utmost importance, especially when this and other studies have shown that there are significant differences among various analyzers available on the market today. Because the majority of the test analyzers seem to underestimate the “true” Hgb concentration, there are major safety concerns regarding the higher probability of an unnecessary RBC transfusion. The significant difference in Hgb values may have a major impact on transfusion rate, which has the potential of increasing the risk of infection, cost, ventilator times, length of stay, morbidity, and mortality (23,30). While all clinicians will evaluate multiple clinical factors before transfusing a patient, a biased sample result could result in an increased propensity for treatment. Unquestionably, any of these analyzers are useful in clinical settings, especially in emergency situations. It is important to keep in mind that statistically significant differences do not necessarily yield clinically significant results. In the cardiac arena, these statistical differences could clinically impact a patient, but this may not be necessarily the case in other areas of the hospital.
The Rapidpoint 405 uses the photometric principle, comes with various configuration panels for cardiac surgery settings, has fully automated quality control features, and is competitively priced for both analyzer and per-test cost. Based on this analysis and the various factors discussed, we conclude that the Rapidpoint 405 most closely resembles the reference Hgb values and is an ideal instrument for use in the cardiac arena. The rank order of closest approximation to the Coulter LH750 measurement was Rapidpoint 405, Hb 201+, IL 682, ABL 720, ABL 77, manual/centrifugation, GemOPL, and Gem 3000.
ACKNOWLEDGMENTS
We thank all the manufacturers for providing study instrumentation and all disposables at no cost to us for this evaluation.
REFERENCES
- 1.Beneteau-Burnat B, Bocque MC, Lorin A, Martin C, Vaubourdolle M.. Evaluation of the blood gas analyzer Gem PREMIER 3000. Clin Chem Lab Med. 2004;42:96–101. [DOI] [PubMed] [Google Scholar]
- 2.Gutierres SL, Welty TC.. Point-of-care testing: an introduction. Ann Pharmacother. 2004;38:119–25. [DOI] [PubMed] [Google Scholar]
- 3.Giuliano KK, Grant ME.. Blood analysis at the point of care: issues in application for use in critically ill patients. AACN Clin Issues. 2002;13:204–20. [DOI] [PubMed] [Google Scholar]
- 4.Price CP.. Medical and economic outcomes of point-of-care testing. Clin Chem Lab Med. 2002;40:246–51. [DOI] [PubMed] [Google Scholar]
- 5.Price CP.. Point-of-care testing. Impact on medical outcomes. Clin Lab Med. 2001;21:285–303. [PubMed] [Google Scholar]
- 6.Halpern MT, Palmer CS, Simpson KN, et al. . The economic and clinical efficiency of point-of-care testing for critically ill patients: a decision-analysis model. Am J Med Qual. 1998;13:3–12. [DOI] [PubMed] [Google Scholar]
- 7.Nichols JH.. Quality of point-of-care testing. Expert Rev Mol Diagn. 2003;3:563–72. [DOI] [PubMed] [Google Scholar]
- 8.Foster K, Despotis G, Scott MG.. Point-of-care testing. Cost issues and impact on hospital operations. Clin Lab Med. 2001;21:269–84. [PubMed] [Google Scholar]
- 9.St-Louis P.. Status of point-of-care testing: promise, realities, and possibilities. Clin Biochem. 2000;33:427–40. [DOI] [PubMed] [Google Scholar]
- 10.Kost GJ.. Knowledge optimization theory and application to point-of-care testing. Stud Health Technol Inform. 1999;62:189–90. [PubMed] [Google Scholar]
- 11.Kost GJ.. Guidelines for point-of-care testing. Improving patient outcomes. Am J Clin Pathol. 1995;104:111–27. [PubMed] [Google Scholar]
- 12.Cox CJ.. Acute care testing. Blood gases and electrolytes at the point of care. Clin Lab Med. 2001;21:321–35. [PubMed] [Google Scholar]
- 13.Nosanchuk JS, Keefner R.. Cost analysis of point-of-care laboratory testing in a community hospital. Am J Clin Pathol. 1995;103:240–3. [DOI] [PubMed] [Google Scholar]
- 14.Hopfer SM, Nadeau FL, Sundra M, Makowski GS.. Effect of protein on hemoglobin and hematocrit assays with a conductivity-based point-of-care testing device: comparison with optical methods. Ann Clin Lab Sci. 2004;34:75–82. [PubMed] [Google Scholar]
- 15.McNulty SE, Sharkey SJ, Asam B, Lee JH.. Evaluation of STATCRIT hematocrit determination in comparison to Coulter and centrifuge: the effects of isotonic hemodilution and albumin administration. Anesth Analg. 1993;76:830–4. [DOI] [PubMed] [Google Scholar]
- 16.McNulty SE, Sharkey SJ, Schieren H.. Bedside hemoglobin measurements: sensitivity to changes in serum protein and electrolytes. J Clin Monit. 1994;10:377–81. [DOI] [PubMed] [Google Scholar]
- 17.McMahon DJ, Carpenter RL.. A comparison of conductivity-based hematocrit determinations with conventional laboratory methods in autologous blood transfusions. Anesth Analg. 1990;71:541–4. [DOI] [PubMed] [Google Scholar]
- 18.Rosenthal RL, Tobia CW.. Measurement of the electrical resistance of human blood; use in coagulation studies and cell volume determinations. J Lab Clin Med. 1948;33:1110–22. [PubMed] [Google Scholar]
- 19.Hirsch FG, Texter EC, Wood LA, et al. . The electrical conductivity of blood. I: Relationship to erythrocyte concentration. Blood. 1950;5:1017–35. [PubMed] [Google Scholar]
- 20.Kernen JA, Wurzel H, Okada R.. New electronic method for measuring hematocrit: clinical evaluation. J Lab Clin Med. 1961;57:635–41. [PubMed] [Google Scholar]
- 21.Baris RR, Israel AL.. Clinical evaluation of the Stat-Crit monitor. Proc Am Acad Cardiovasc Perfusion. 1988;9:37–42. [Google Scholar]
- 22.McNulty SE, Torjman M, Grodecki W, Marr A, Schieren H.. A comparison of four bedside methods of hemoglobin assessment during cardiac surgery. Anesth Analg. 1995;81:1197–202. [DOI] [PubMed] [Google Scholar]
- 23.Ruel MA, Rubens FD.. Non-pharmacological strategies for blood conservation in cardiac surgery. Can J Anaesth. 2001;48:S13–23. [PubMed] [Google Scholar]
- 24.Moskowitz DM, Klein JJ, Shander A, et al. . Predictors of transfusion requirements for cardiac surgical procedures at a blood conservation center. Ann Thorac Surg. 2004;77:626–34. [DOI] [PubMed] [Google Scholar]
- 25.Yazicioglu L, Eryilmaz S, Sirlak M, et al. . Recombinant human erythropoietin administration in cardiac surgery. J Thorac Cardiovasc Surg. 2001;122:741–5. [DOI] [PubMed] [Google Scholar]
- 26.Parr KG, Patel MA, Dekker R, et al. . Multivariate predictors of blood product use in cardiac surgery. J Cardiothorac Vasc Anesth. 2003;17:176–81. [DOI] [PubMed] [Google Scholar]
- 27.Shapira OM, Aldea GS, Treanor PR, et al. . Reduction of allogeneic blood transfusions after open heart operations by lowering cardiopulmonary bypass prime volume. Ann Thorac Surg. 1998;65:724–30. [DOI] [PubMed] [Google Scholar]
- 28.Rosengart TK, DeBois W, O’Hara M, et al. . Retrograde autologous priming for cardiopulmonary bypass: a safe and effective means of decreasing hemodilution and transfusion requirements. J Thorac Cardiovasc Surg. 1998;115:426–38. [DOI] [PubMed] [Google Scholar]
- 29.Surgenor DM, Wallace EL, Churchill WH, et al. . Red cell transfusions in coronary artery bypass surgery (DRGs 106 and 107). Transfusion. 1992;32:458–64. [DOI] [PubMed] [Google Scholar]
- 30.Hillyer CD, Josephson CD, Blajchman MA, et al. . Bacterial contamination of blood components: risks strategies, and regulation: joint ASH and AABB Educational Session in Transfusion Medicine. Hematology (Am Soc Hematol Educ Program). 2003;1:575–89. [DOI] [PubMed] [Google Scholar]
- 31.Shander A.. Surgery without blood. Crit Care Med. 2003;31:708–14. [DOI] [PubMed] [Google Scholar]
- 32.Uhl L.. Infectious risks of blood transfusion. Curr Hematol Rep. 2002;1:156–62. [PubMed] [Google Scholar]
- 33.Biggerstaff BJ, Petersen LR.. Estimated risk of transmission of the West Nile virus through blood transfusion in the US, 2002. Transfusion. 2003;43:1007–17. [DOI] [PubMed] [Google Scholar]
- 34.Higgins C.. Hemoglobin and its measurements. Available at www.bloodgas.org 2005. Accessed March 15, 2006.
- 35.Gehring H, Hornberger C, Dibbelt L, et al. . Accuracy of point-of-care-testing (POCT) for determining hemoglobin concentrations. Acta Anaesthesiol Scand. 2002;46:980–6. [DOI] [PubMed] [Google Scholar]
- 36.Raff H.. The significance of the blood gas analyzer. J Appl Physiol. 2004;97:1597–8. [DOI] [PubMed] [Google Scholar]
- 37.Wennecke G.. Hematocrit-A review of different analytical methods. Available at www.bloodgas.org 2004. Accessed March 15, 2006.