Abstract:
Autologous blood transfusion is the safest and most successful way to decrease transfusion-related risks such as post-operative infections, allo-immunization, and short- and long-term immunosuppression. In addition, these fibrin sealants are known to provide coagulation support at the surgical site and act as an adjunct to the control of postoperative bleeding. The physical formation of autologous platelet fibrin gel clot is dependent on both the common pathway of the coagulation cascade and platelet activation. Platelet gel can help provide control of intraoperative and postoperative bleeding. The Thrombelastograph Hemostasis Analyzer (TEG®) measures the viscoelastic properties of a clot as it forms. Based on the information that the TEG provides, it promises to be a good choice for point of care measurement of the integrity of thrombus formed by platelet gels. Bovine blood from a single donor was sequestered into platelet-rich plasma and was made into platelet gel using calcium and three different concentrations of thrombin. The platelet gel samples were then analyzed with the TEG analyzer. The results for MA, tMA, CI, and angle were recorded and statistical analysis was performed to accept or reject the null hypothesis, which is: There is no difference between TEG parameters when analyzing platelet gels formed with calcium chloride, platelet-rich plasma and three different concentrations of thrombin A one-way analysis of variance test was performed between thrombin concentrations for MA (p = 0.19), tMA (p = 0.443), CI (p = 0.257), and angle (p = 0.323). The results showed that thrombin concentration did not affect the MA, tMA, CI, or angle as measured by the TEG analyzer. The null hypothesis was accepted. Based on a one-way analysis of variance test for MA, tMA, CI, and angle there was no significant statistical difference for the TEG samples in this experiment as reported with a 95% confidence interval.
Keywords: platelet gel, thrombelastograph, platelet-rich plasma
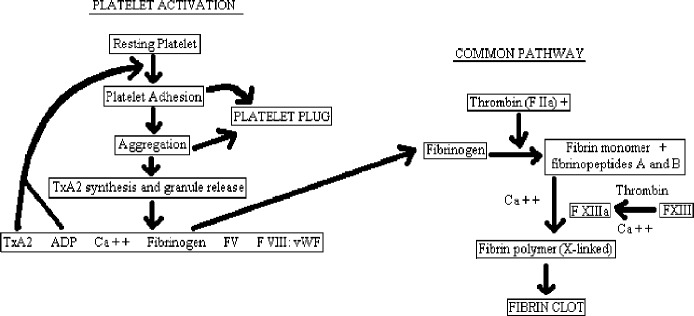
Autologous blood transfusion is the safest and most successful way to decrease transfusion-related risks such as postoperative infections, allo-immunization, and short- and long-term immunosuppression (1). Autologous blood products are used in the formation of platelet fibrin gel. Fibrin sealants, in general, are known to provide coagulation support at the surgical site and act as an adjunct to the control of post-operative bleeding (2). The physical formation of autologous platelet fibrin gel is dependent on both the common pathway of the coagulation cascade and platelet activation (Figure 1). In the common pathway, thrombin aids in the conversion of fibrinogen to fibrin in the presence of calcium to form a fibrin clot. Thrombin is the most important enzyme in the clotting pathway because in addition to activating fibrinogen it also provides positive feedback by activating cofactors V and VIII, it accelerates crosslinking of fibrinogen, and it strongly stimulates platelet adhesion and aggregation, as well as facilitating clot resorption and providing negative feedback via protein C activation that inactivates factors Va and VIIIa (3).
Figure 1.
Platelet gel clotting cascade.
Calcium also plays a vital role in the formation of clot. It has been determined that optimal covalent fibrin crosslinking is achieved at a calcium chloride concentration between 5 and 20 mM at an ionic strength of 0.15 M (2). With the application of platelet gel, using autologous platelet-rich plasma (PRP), there is an activation of platelets. One of the end products of platelet activation is the derivation of fibrinogen, allowing it to be in greater supply to supplement the actions of fibrin in the common pathway. In this way, platelet gel can help provide control of intraoperative and postoperative bleeding. It has been shown that higher fibrin concentrations produce more adhesive force and better sealing properties (4). One of the main problems associated with platelet gel usage intraoperatively is the lack of scientific evidence relative to the total effectiveness of both the treatment and the product prior to use. For platelet gel therapy to become a mainstream medical treatment, there must be a quantifiable way of determining the structural integrity of the resulting formed platelet gel thrombus at the point of care.
In the area of perioperative blood management clinicians use a device designed to predictably monitor structural integrity of thrombi in whole blood (5,6). The Thrombelastograph Hemostasis Analyzer (TEG®; Haemoscope Corporation, Niles, IL) measures the viscoelastic properties of a clot as it forms and subsequently degrades naturally. This technology is already widely used to study the formation of whole blood clot and is currently being used for clinical coagulation management of cardiovascular surgical patients both pre- and postoperatively (5,6). The TEG also is considered to be the best overall test for hypercoagulable states (6,7). On the basis of the information that the TEG provides, it promises to be a good choice for point of care measurement of the integrity of thrombus formed by platelet gels. Point of care analysis of platelet gel with the TEG could allow for more consistent platelet gel formation and patient care.
The objective of this study was to use the TEG to analyze the quality of platelet gel as determined by the TEG signature during formation of the platelet gel clot with three different concentrations of thrombin. A more complete understanding of the efficacy of platelet gel and the physical formation of the thrombus created by the platelet gel in a bovine model will provide a means to eventual extension into human trials.
MATERIALS AND METHODS
Sequestration
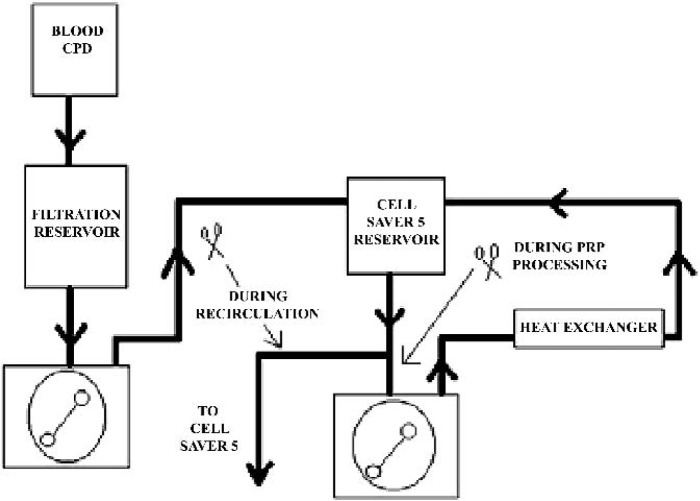
One bovine donor provided all of the blood products for this study. The collected bovine blood was anticoagulated with citrate phosphate dextrose (CPD) at the point of collection. The blood was then passed once through a cardiotomy reservoir with an integral blood filter (Haemonetics Corporation; Braintree, MA) for gross filtration of the blood prior to introduction into the circuit. The blood was pumped through a COBE roller pump (COBE Cardiovascular, Arvada, CO) to a second reservoir (Haemonetics Corporation) and processed through a Haemonetics Cell Saver 5 (Haemonetics Corporation). A recirculating loop with a flow of 2 L/min was set up from the outlet of the Cell Saver 5 reservoir (Haemonetics Corporation) through an Avecor heat exchanger (Avecor Cardiovascular, Inc.; Minneapolis, MN) using a Sarns Heater/Cooler (Terumo Cardiovascular Systems; Ann Arbor, MI) to maintain the blood temperature at 37°C (Figure 2). This was done to keep the platelets normothermic. Temperature was monitored before and after the heat exchanger. The Haemonetics Cell Saver 5 was set up using standard plasma sequestration disposables and protocols (8), using normal saline as a wash solution. The resulting platelet rich plasma was stored in a sequestration bag in a water bath to maintain the sequestered PRP temperature at 37°C because it was not possible to create all platelet gel samples immediately as the experiment was conducted throughout the course of an entire day.
Figure 2.
Circuit diagram.
Platelet Gel Formation
Sequestered bovine PRP was made into platelet gel by combining equal parts of PRP with a calcium-thrombin mixture. A total of 25 mg of calcium was combined with each of three different concentrations of reconstituted topical thrombin solutions to make a calcium-thrombin mixture of three different thrombin concentrations (Table 1). Platelet gel was formed using micropipettes to aspirate equal parts of PRP and the calcium–thrombin mixture inside of the TEG sample well. The TEG analyzer was started immediately and allowed to continue until the test was completed (approximately 1 hour). A randomized sample order was created using Microsoft Excel and analysis was performed using the TEG analyzer for 15 platelet gel samples. Randomized sample analysis was performed to eliminate the Hawthorne effect in this experiment.
Table 1.
Calcium-thrombin mixture.
Statistical Analysis
The TEG analysis was repeated five times for each thrombin concentration and results were compared between concentrations using a one-way analysis of variance (ANOVA) test to accept or reject the null hypothesis that there is no difference between TEG parameters when analyzing platelet gels formed with calcium chloride, platelet rich plasma and three different concentrations of thrombin. Analyzed TEG parameters include maximum amplitude (MA), time to maximum amplitude (tMA), plot upslope angle, and clotting index (CI) and are defined in Table 2.
Table 2.
Definition of measured parameters.
| Maximum amplitude (MA) | Represents the maximum clot strength |
| Time to maximum amplitude (tMA) | Time needed to reach MA once clotting has begun |
| Clotting index (CI) | General quantification of the total clotting process integrating all TEG® variables |
| Plot upslope angle (angle) | Represents the overall speed at which the clot is forming |
RESULTS
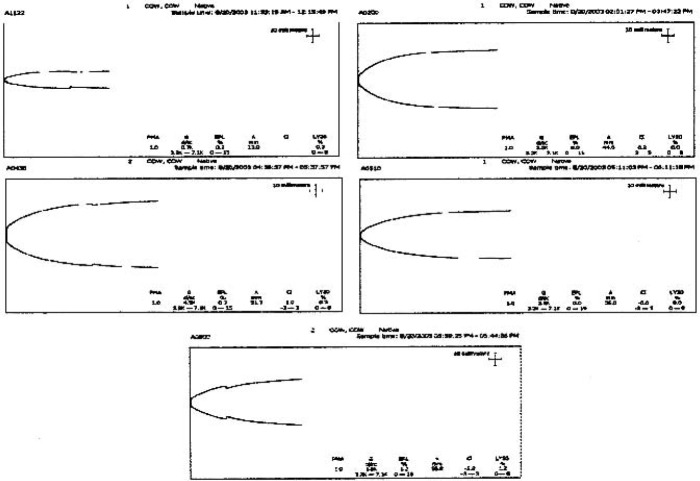
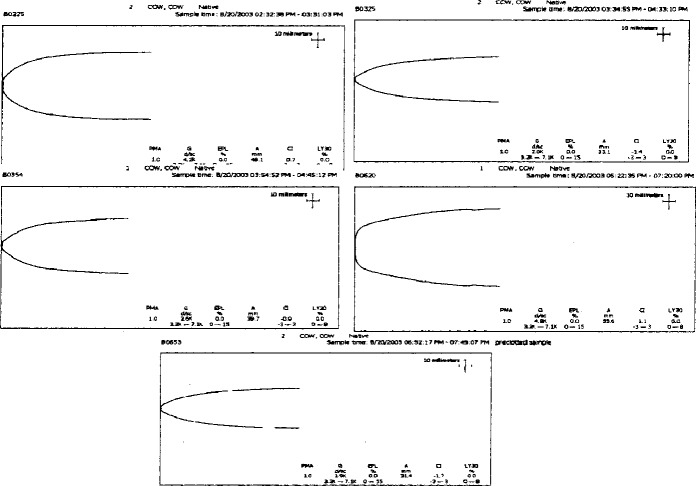
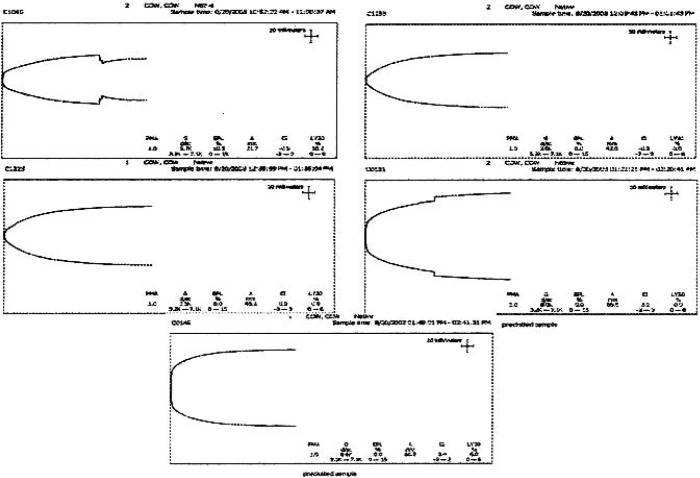
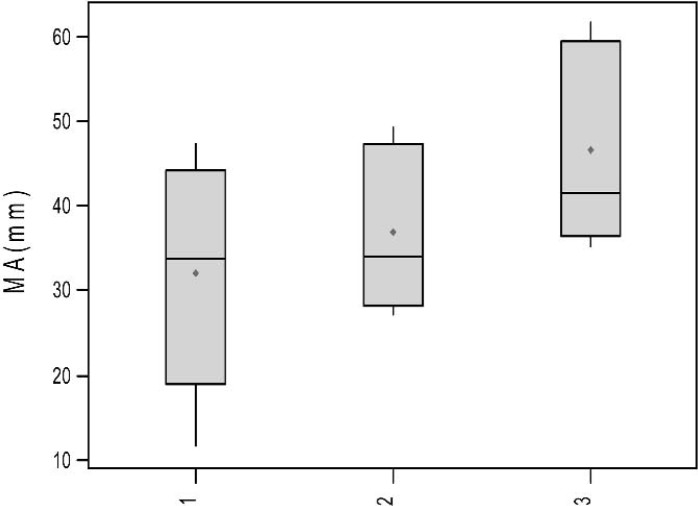
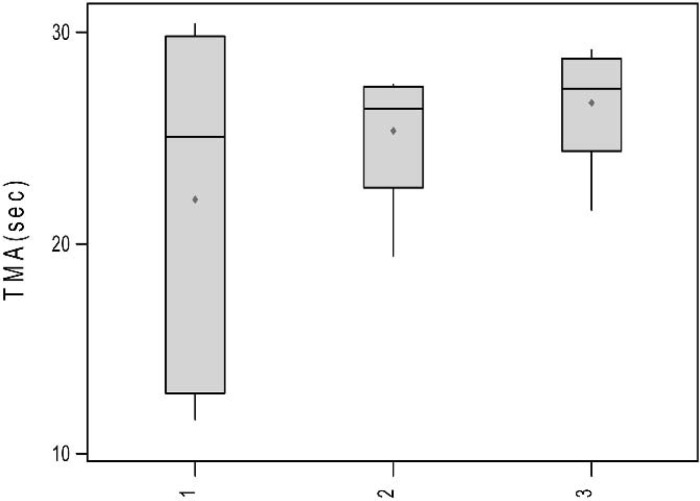
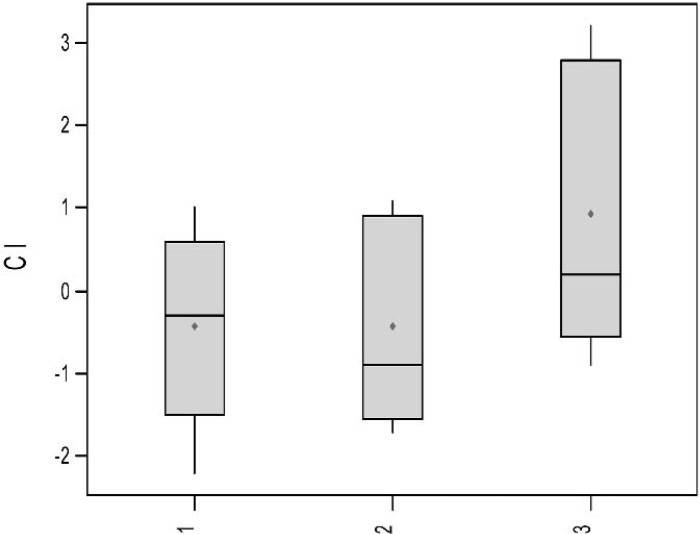
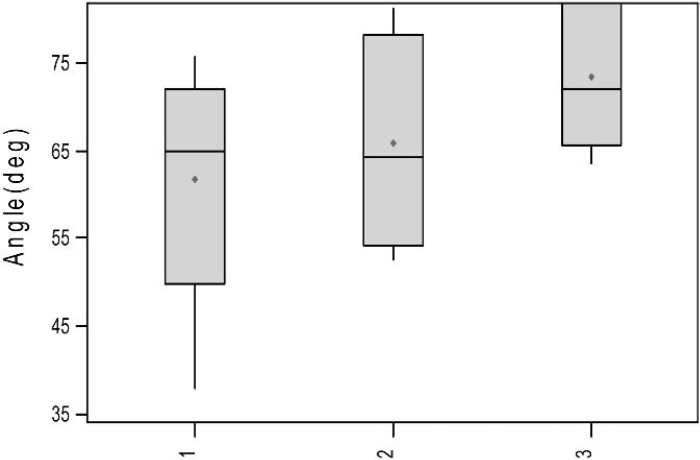
TEG signatures were collected for each of the 15 trials. The TEG signatures appear similar regardless of thrombin concentration (Figures 3–5). One-way ANOVA tests showed that there were no significant differences in any of the TEG parameters MA (p = 0.19), tMA (p = 0.443), CI (p = 0.257), and TEG angle (p = 0.323) (Figures 6–9); however, there was a general trend upwards in each of the analyzed TEG variables as compared between the different thrombin concentrations.
Figure 3.
TEG® tracings: low-thrombin concentration.
Figure 4.
TEG® tracings: medium thrombin concentration.
Figure 5.
TEG® tracings: high thrombin concentration.
Figure 6.
Boxplots of MA (mm) by thrombin concentration.
Figure 7.
Boxplots of tMA (sec) by thrombin concentration.
Figure 8.
Boxplots of Cl by thrombin concentration.
Figure 9.
Boxplots of angle (deg) by thrombin concentration (p = 0.433).
DISCUSSION
The statistical analysis showed that there was not a significant correlation between TEG parameters when compared between different thrombin concentrations. The p values associated with this analysis were large. One possible explanation for this is the small sample sizes used for the study. Although it is common to seek a statistical power of 80 for analysis purposes the power for this trail was only 15 because of the small sample sizes and the deviation within the sample groups. Because of the inconsistency of biological systems it was not possible to control for the deviation within the groups with anything other than randomized sample analysis. The experiment was designed as a pilot study to control for a multiple donor variable. It is probable that larger sample sizes would decrease the p values associated with the different thrombin concentration.
Although there was not a statistical difference between thrombin concentrations for the analyzed TEG parameters, it should be noted that there was a general trend upwards in all of the parameters based on the data collected. With an increase in sample size it is possible that a statistical difference would be discovered.
When platelet gel is formed there is an abundance of clotting factors to allow for immediate coagulation. Another theory for the lack of differences in TEG parameters is that there may have been an excessive amount of thrombin and calcium for coagulation even in the lowest thrombin concentration group. It may be possible to decrease the amount of thrombin added to the gel and still achieve the same hemostatic outcome.
CONCLUSION
On the basis of the results of this experiment, a similar study involving multiple donors and a larger sample size, even extending into human populations, would better define the functionality of the TEG analyzer as a point of care device used in the analysis of platelet gels.
REFERENCES
- 1.Perseghin P, Rocco G, Pona CD, et al. Impact of autologous blood transfusion on blood support in general thoracic surgery: Analysis of 969 patients over a 5-year period. Transfusion Sci. 1995;16:65–70. [DOI] [PubMed] [Google Scholar]
- 2.Silver FH, Wang MC, Pins GD.. Preparation and use of fibrin glue in surgery. Biomaterials. 1995;16:891–903. [DOI] [PubMed] [Google Scholar]
- 3.Gravlee GP, Davis RF, Kurusz M, et al. Cardiopulmonary Bypass Principles and Practice. Philadelphia: Lippincott Williams and Wilkins; 2000:491–2. [Google Scholar]
- 4.Kaetsu H, Uchida T, Shinya N.. Increased effectiveness of fibrin sealant with a higher fibrin concentration. Int J Adhesion Adhesives. 2000;20:27–31. [Google Scholar]
- 5.Forst C, Chapin J, Forst S, et al. Thromboelastograph analysis after heparin neutralization with protamine and heparinase during cardiopulmonary bypass. J Extra Corp Technol. 1994;26:129–34. [Google Scholar]
- 6.Spiess BD, Counts RB, Gould SA.. Perioperative Transfusion Medicine. Baltimore: Williams and Wilkins; 1998;250–7, 399–416. [Google Scholar]
- 7.Zuckerman L, Cohen E, Vagher JP, et al. Comparison of thromboelastography with common coagulation tests. Thromb Haemost. 1981;46:752–6. [PubMed] [Google Scholar]
- 8.Haemonetics Corporation. Clinical Education Series, Surgical; Haemonetics Cell Saver 5 user Manual. Tucson: HBSTI Publications Department; 1997;10:1–2. [Google Scholar]


