Abstract:
Neurologic impairment is a common complication of adult cardiac surgery. Cerebral gaseous microemboli (GME) detected during cardiopulmonary bypass has been associated with cognitive impairment after adult cardiac surgery. Several previous studies have shown that components comprising the extra-corporeal circuit (ECC) can affect the ability of the ECC to eliminate air. The differences in the air separation ability of four manufacturer’s commonly used ECCs were studied. The air-separating ability of Cobe Cardiovascular, Gish Biomedical, Medtronic, and Terumo Cardiovascular Systems Corp. ECCs were studied in vitro under clinically relevant conditions. Bolus and continuous venous air were introduced and output GME patterns by size, time, and count were measured (using an embolus detection device) and statistically analyzed. Graphic representations depicting elapsed time, GME size, and bubble count helped to visually rank the air-handling performance of the ECCs. There are significant air-handling differences between the ECCs tested. Overall, the blinded results reveal that ECC A and ECC C removed significantly (p < 0.001) more suspended GME than ECC B and ECC D. In the 50-mL venous room-air bolus and the 100 mL/min pulsed air challenges, ECC B and ECC D allowed significantly more GME to pass (p < 0.001) compared with ECC A and ECC C. For example, in a 2-hour pump run ECC C would deliver 480 potential high-intensity transient signals (HITS) compared with the 9600 from the ECC B during venous room air entrainment at 100 mL/min. There are substantial and significant air-handling differences between the ECCs from the four different manufacturers. The results from this work allow for objective characterization of ECCs air-separating ability. This additional information provides an opportunity for clinicians to potentially minimize the risks of arterial air embolization and its associated deleterious neurologic effects, while allowing clinicians to make better-informed consumer decisions.
Keywords: gaseous microemboli, high-intensity transient signals, extracorporeal circuit, in vitro study
Despite improvements in surgical, anesthetic, and per-fusion techniques, the incidence of neurologic injury and in particular neurocognitive impairment is a common complication for patients undergoing cardiac surgery. Several studies have shown that 50%–70% of patients undergoing coronary artery bypass grafting (CABG) surgery show signs of neurocognitive impairment 1 week after surgery and approximately 30%–40% of patients show signs of neurocognitive impairment 3 months after surgery (1–4).
The etiology of postoperative neurocognitive impairment is probably multifactorial; however, there is substantive evidence that the principal cause of neurocognitive impairment is cerebral microemboli during cardiopulmonary bypass (CPB) (5–8). While the exact composition of cerebral microemboli is not clearly understood, Borger et al. have shown that the majority of emboli probably consist of air (9,10). Furthermore, Borger et al. (11) has shown that the majority of cerebral microemboli that occur during CABG surgery are caused by “perfusionist interventions” and an increase in perfusionist interventions is associated with an increase in postoperative neurocognitive impairment. Rodriquez et al. (12–13) showed the importance of perfusionist techniques (interventions), including not purging (flushing) the sampling manifold, using continuous infusions instead of bolus injections, and maintaining venous reservoir blood volumes (>800 mL) to minimize cerebral microemboli. Both Stump et al. (14) and Pugsley et al. (15) have shown a relationship between the number of microemboli detected during CPB and the incidence of postoperative brain injury.
The way gaseous microemboli (GME) will behave within an extracorporeal circuit (ECC) is multifactorial and includes the complex interrelationship between flow, gaseous partial pressures, volume, solubility, buoyancy, perfusate, temperature, fluid viscosity, and ECC design (17). Thus, the components comprising the ECC can affect the ability of the ECC to eliminate GME. Previous studies have evaluated the ability of CPB components to handle or remove entrained venous air (17–21). Results from this work have shown wide variations in GME removal rates between the ECC tested. The purpose of this in vitro study was to build on the earlier work of Jones et al. (19) and rank the air separation ability of four commonly used cardiovascular manufacturer ECC designs.
METHODS
Circuit Design
Figure 1 depicts the recirculating in vitro test circuit featuring the use of a bubble oxygenator (Model Bio 5; Baxter Healthcare, Irvine, CA) that served as the continuous source of GME.
FIGURE 1.
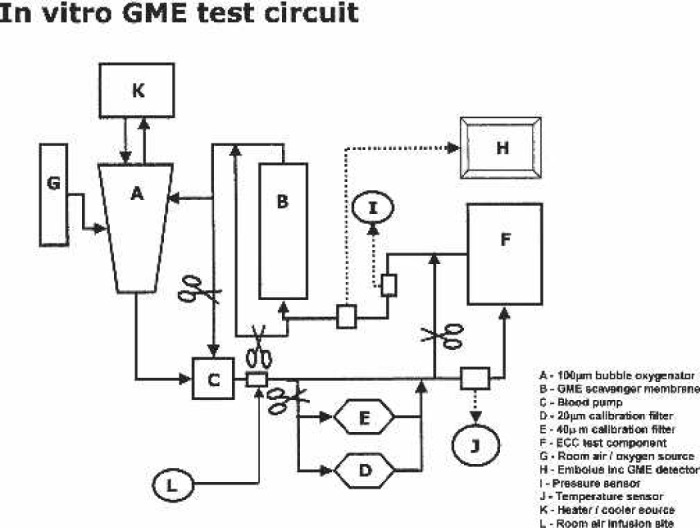
In vitro GME test circuit.
A silicon membrane oxygenator was used as a degassing device (Model 2500; Medtronic Cardiopulmonary, Minneapolis, MN) by applying vacuum (−300 mmHg) to the inlet and outlet gas ports as similarly described by Rudolph et al (22). The degassing ability of the test circuit to prevent error from GME recirculation and avoid use of large “patient” reservoirs was confirmed.
Table 1 lists the de-identified components and configurations of the four manufacturer tested ECCs (Cobe Cardiovascular, Arvada, CO; Gish Bioimedical, Rancho Santa Margarita, CA; Medtronic, Minneapolis, MN; Terumo Cardiovascular Systems Corp., Elkton, MD). Roller pump flow was generated using a properly occluded and calibrated roller pump (Cobe Cardiovascular).
Table 1.
Test circuit components.
| Test ECC/manufacturer | Venous reservoir | Oxygenator/heat exchanger | Blood pump | Arterial line filter |
|---|---|---|---|---|
| A | Hardshell venous reservoir with biopassive surface coating | Hollow fiber membrane oxygenator, integrated heat exchanger and biopassive surface coating | Centrifugal | Approximately 40 μm with biopassive surface coating |
| B | Hardshell venous reservoir with biopassive surface coating | Hollow fiber membrane oxygenator, integrated heat exchanger and biopassive surface coating | Roller Pump | Approximately 40 μm with biopassive surface coating |
| C | Hardshell venous reservoir with biopassive surface coating | Hollow fiber membrane oxygenator, integrated heat exchanger and biopassive surface coating | Centrifugal | Approximately 40 μm with biopassive surface coating |
| D | Hardshell venous reservoir with biopassive surface coating | Hollow fiber membrane oxygenator, integrated heat exchanger and biopassive surface coating | Centrifugal | Approximately 40 μm with biopassive surface coating |
An external cooler-heater device (Model TCM II; Terumo Cardiovascular Systems Corp.) was connected in series to both the bubble oxygenator heat exchanger and the tested oxygenator heat exchanger. Perfusate temperature was monitored at the venous inlet of both the bubble oxygenator and test oxygenator.
The circuits were primed with a 28% glycerin solution with a Plasma-Lyte-A (Baxter Healthcare-IV Systems, Deerfield, IL) base. This synthetic blood analog was extensively tested and found to be closely equivalent in GME performance characteristics to that of 23% porcine blood (see Appendix for further information on the methods and results). The total prime volume of the test circuit was 2500 ± 200 mL.
New and sterile tested ECC components were used for each experiment. All tested ECCs were first flushed with CO2 gas for 3 minutes before priming, and debubbling the ECC components were performed according to manufacturer instructions for use.
Air Introduction
The micro-air source was the bubble oxygenator. From pilot testing, it was discovered that a room air gas flow of 500 mL/min with a bubble oxygenator reservoir volume of 800 ± 100 mL produced a consistent count and size GME distribution. This distribution was verified before testing of each ECC.
A luer-lock connector with a four-way stopcock was inserted proximal to the venous reservoir. From this site, both 50 mL boli and a 100 mL/min pulsed air stream were introduced into the test devices. The 50 mL room-air bolus was standardized by using the simple pressure chamber device in Figure 2 (Terumo Cardiovascular Systems Corp.). A Cobe roller pump utilizing ¼-in ID tubing was used to provide 100 mL/min of pulsed entrained air over a 2-minute period into the inlet of the test ECC.
FIGURE 2.
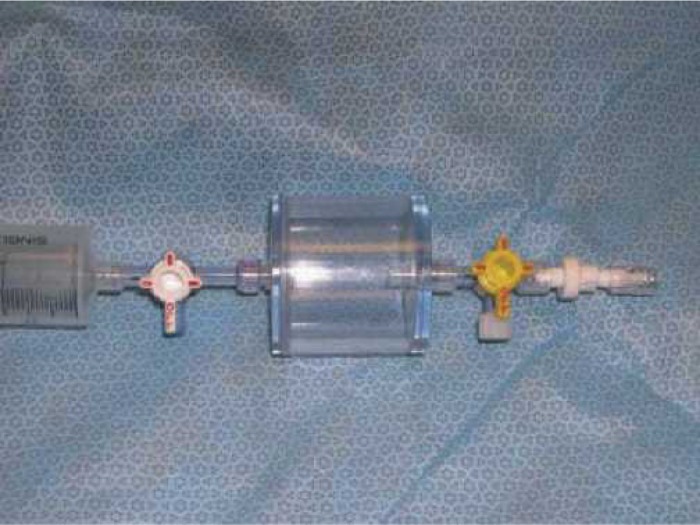
50 mL room-air bolus device.
Experimental Conditions
The perfusate in all circuits were maintained at 32 ± 0.5°C. The test circuit venous reservoir level was maintained at 200 ± 50 mL. Perfusate flow was maintained at 4 ± 50 mL/min. Line pressure was measured distal to the test circuit arterial line filter and maintained at 150 ± 10 mmHg through the use of a hose clamp.
Room air gas flow through the test oxygenator device was maintained constant 1.5 L/min. Room air gas flow through the bubble oxygenator was continuous at 500 mL/ min of room air. The test circuit PaO2 varied between 140 and 155 mmHg.
In all tested ECCs, the sampling manifold and arterial filter purge was left in an open configuration. The arterial filter purge was connected directly to the venous line in all tested ECCs except the Cobe circuit, where the arterial filter purge line was returned to a the filtered portion of the cardiotomy reservoir because of the absence of a venous line luer port. Oxygenator recirculation lines were kept in the closed position during testing.
Embolus Detection
The EDAC (Embolus Detection and Classification; Embolus LLC, Durham, NC) device was used to monitor and measure GME activity. A new version of the EDAC system, which features some algorithmic refinements to the EDAC system described here, will be commercially distributed through Luna Innovations (Blacksburg, VA). The EDAC transducer was attached to a Bentley OxySat Optical Transmission Cell (Model OTC 380–3/8” or OTC 500–1/2”; Baxter Healthcare) following manufacturer’s instructions. Optical cells were placed into the circuit proximal to the tested ECC reservoir and distal to its arterial line filter. The system consists of a 5-mHz “active sonar” transducer connected to a Pentium personal computer operating a Windows-based system (Microsoft, Redmond, WA). Signal analysis and process enables rejection of motion artifacts, radio frequency interference, and other such causes of false signals (20). The EDAC was provided in a precalibrated condition; however, before use, the system was validated using a previously described technique to ensure system reliability (23).
Conduct of Study
Two identical ECC configurations from each of the four manufacturers (Table 1) were randomized and then tested for air-handling ability. Each ECC was tested under three different venous inlet GME challenges: 1) micro-air from the bubble oxygenator, 2) 50 mL bolus, and 3) 100 mL/min pulsed air stream.
In the bubble oxygenator trials, total emboli count and size were measured and counted for three 30-second intervals for two each of the four test ECCs. The percent removal (inlet – outlet counts) of the GME at various size limits were calculated, analyzed, and plotted.
In the bolus and steady stream trials, emboli count, and size were measured and calculated, respectively, in 15second intervals before and after air introduction for a 2-minute period. Each trail was repeated three times for two each of the four ECCs. Between air challenge trials, a steady state where little or no GME were observed in the test circuits was established.
Graphic and Statistical Analysis
For the bubble oxygenator GME challenge, the percent removal versus GME size limits was compared by ANOVA and plotted. For the bolus and continuous air stream challenges, the mean GME counts were plotted vs. elapsed time and GME size in three-dimension surface. Repeated-measures analysis of variance (ANOVA) was used to rank the air-handling ability of the ECCs. Specific contrast analyses and paired comparisons were performed with Bonferroni adjustments to rank specific ECCs at specific test conditions. All analyses were performed using SPSS software (SPSS, Chicago, IL). Statistical significance was set at p = 0.05.
RESULTS
There were statistically significant differences in air-handling ability between all four ECC configurations. The following results are blinded with respect to manufacturer name.
Micro-Air Challenge From Bubble Oxygenator
Table 2 presents the ANOVA results of the effects of the ECCs in the percent removal of flowing GME. Figure 3 shows the difference in the ability of the ECCs to separate continuously suspended GME entering the venous inlet. ECC B allowed significantly more suspended venous GME to pass compared with ECC D (p < 0.001) up to 34 μm. There was no significant difference between ECC A and ECC C configurations at 19 μm and above. Both ECC A and C were significantly more efficient at removing suspended venous GME than ECC B or ECC D (p < 0.011) at GME sizes < 49 μm.
Table 2.
ANOVA tests between ECC configurations effects and the analysis of bubble oxygenator GME percent removal.
| Source | Type 3 SS | df | MS | F | Significance |
|---|---|---|---|---|---|
| ECC Config | 2,997.516 | 3 | 999.172 | 52.578 | < 0.001 |
| GME Size | 13,194.059 | 8 | 1,649.257 | 86.783 | < 0.001 |
| ECC*GME | 15,881.963 | 24 | 661.748 | 34.821 | < 0.001 |
| Error | 3,420.780 | 180 | 19.004 | ||
| Total | 35,494.218 | 215 |
ECC Config, ECC Configuration; ECC*GME, the interaction between ECC Configuration and GME Size limits.
FIGURE 3.
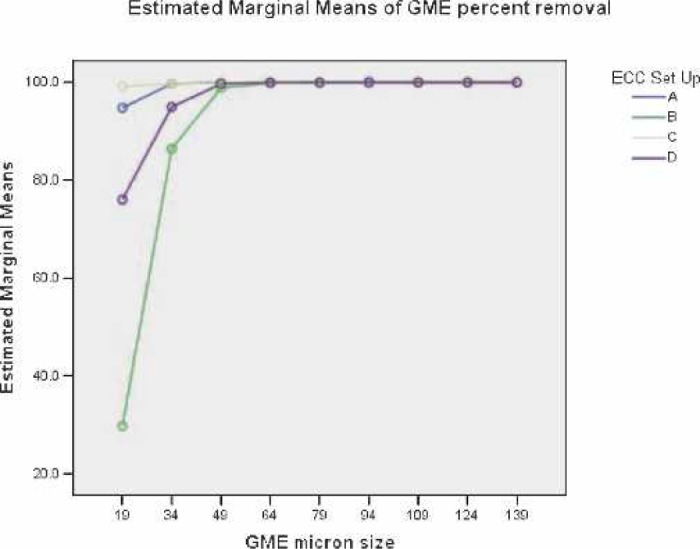
Main effects of GME percent removal versus GME sizes.
Because the distribution of the GME counts is typically skewed to the right (higher counts at lower sizes or at earlier elapsed times), ANOVA assumptions may not be valid and there may be a greater chance of statistical error. The Kruskal-Wallis (K-W) non-parametric test for multiple independent groups was used to test for difference between mean GME counts or percent removal.
The SPSS K-W non-parametric test for differences in median GME percent removal between the four ECC configurations at the GME size of approximately 34 μm resulted in χ2 (3, n = 10) = 19.491, p < .000. The non-parametric K-W test results suggest that the four ECC combination median percent GME removals come from different populations.
Venous Line 50 mL Room-Air Bolus Challenge
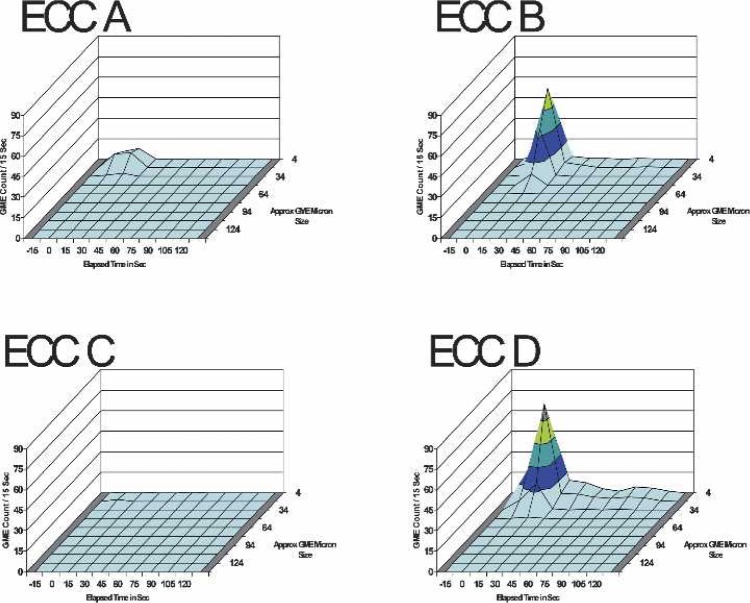
Table 3 presents the three-factor ANOVA test results for the effects between ECC set-up, elapsed time, and GME size limits on the GME counts per 15-second intervals for 15 seconds before and 2 minutes after the venous 50 mL room air bolus. Figure 4 presents the three-dimensional surface charts for the GME outlet counts for the four ECC configurations after the 50 mL room-air bolus.
Table 3.
ANOVA tests of between ECC configurations effects and the analysis of GME counts vs elapsed time and GME size limits on GME counts per 15 seconds for 2 minutes after a venous 50 mL room-air bolus.
| Source | Type 3 SS | df | MS | F | Significance |
|---|---|---|---|---|---|
| ECC Config | 2,121.585 | 3 | 707.195 | 47.893 | < 0.001 |
| ET | 10,366.784 | 9 | 1,151.865 | 78.007 | < 0.001 |
| GME size | 7,619.075 | 9 | 846.564 | 57.331 | < 0.001 |
| ECC*ET | 7,745.928 | 27 | 286.886 | 19.429 | < 0.001 |
| ECC*size | 6,240.903 | 27 | 231.145 | 15.654 | < 0.001 |
| ET*size | 26,911.295 | 81 | 332.238 | 22.500 | < 0.001 |
| ECC*ET*size | 21,610.210 | 243 | 88.931 | 6.023 | < 0.001 |
| Error | 29,532.500 | 2000 | 14.766 | ||
| Total | 112,148.280 | 2399 |
Note: ECC Config, ECC configuration; ET, elapsed time; GME Size, micron limits; ECC*ET, ECC*Size, ET*Size, and ECC*ET*Size, the interactions between factors.
FIGURE 4.
The GME counts at all sizes and elapsed times up to 2 minutes post-venous 50 mL room-air bolus at 4 L/min pump flow, 28% glycerin flow, and 34°C perfusate temperature.
The SPSS K-W non-parametric test for differences in median total GME counts at all sizes between the four ECC configurations at 30 seconds elapsed time after the air bolus resulted in χ2 (3, n = 30) = 27.075, p < .000. The non-parametric K-W test results suggest that the four ECC combination median total GME counts at an elapsed time of 30 seconds after the bolus come from different populations.
Overall, at all elapsed times, there was no significant difference between ECC A and ECC C systems. ECC A and ECC C systems exhibited significantly less GME counts during the measurement periods compared with ECC B and ECC D systems (p < 0.012). The GME counts from ECC B and ECC D systems were significantly different (p < 0.001). The main effects of GME counts at all sizes vs. elapsed time are presented in Figure 5.
FIGURE 5.
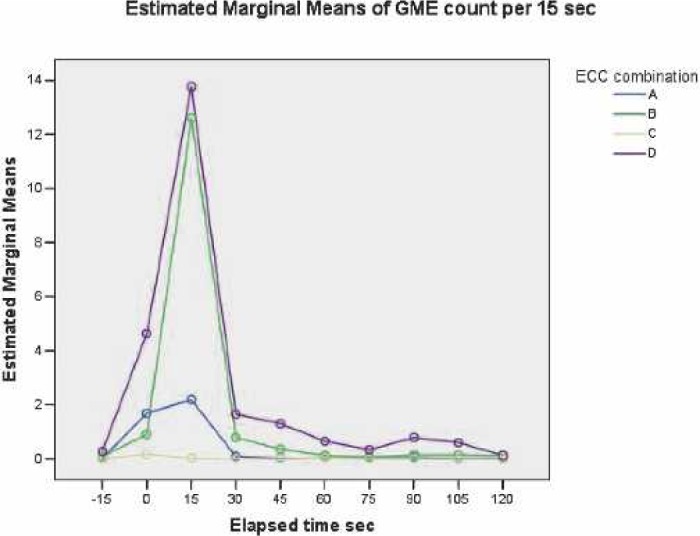
Main effects of GME counts at all GME sizes versus elapsed time.
Venous Continuous Pulsed-Air 100 mL/min Stream Challenge
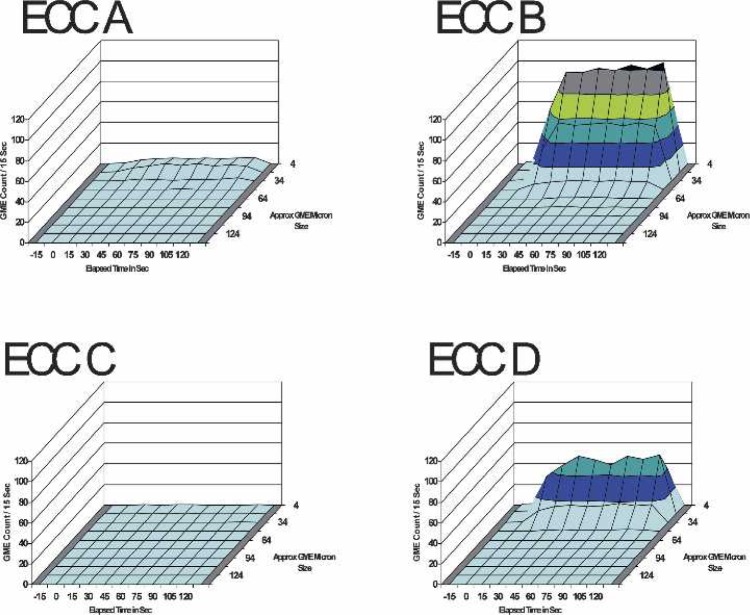
Table 4 presents the three-factor ANOVA test results for the effects between ECC set-up, elapsed time, and GME size limits on the GME counts per 15-second intervals for 15 seconds before and 2 minutes after the 100mL/min venous pulsed air stream was initiated. Figure 6 depicts the continuous stream of GME at the outlet of the four ECC set-ups during the venous pulsed room air stream.
Table 4.
ANOVA tests of between ECC configurations effects and the analysis of GME counts vs elapsed time and GME size limits on GME counts per 15 seconds for 15 seconds before and 2 minutes after the initiation of the 100 mL/min venous pulsed air stream.
| Source | Type 3 SS | df | MS | F | Significance | Partial η2 | Obs power |
|---|---|---|---|---|---|---|---|
| ECC Config | 96,333.051 | 3 | 32,111.017 | 1,679.029 | < 0.001 | 0.716 | 1.0 |
| ET | 23,486.302 | 9 | 2,609.589 | 136.451 | < 0.001 | 0.380 | 1.0 |
| GME size | 241,195.877 | 9 | 26,799.542 | 1,401.302 | < 0.001 | 0.869 | 1.0 |
| ECC*ET | 24,982.470 | 27 | 925.277 | 48.381 | < 0.001 | 0.395 | 1.0 |
| ECC*size | 248,835.528 | 27 | 9,216.131 | 481.895 | < 0.001 | 0.867 | 1.0 |
| ET*size | 60,834.935 | 81 | 751.049 | 39.271 | < 0.001 | 0.614 | 1.0 |
| ECC*ET*size | 65,323.576 | 243 | 268.821 | 14.056 | < 0.001 | 0.631 | 1.0 |
| Error | 38,249.5 | 2000 | 19.125 | ||||
| Total | 799,241.240 | 2399 |
ECC Config, ECC configuration; ET elapsed time; GME size, micron limits; ECC*ET, ECC*Size, ET*Size, and ECC*ET*Size, the interactions between factors; partial η2, the effect size where 0.15 to 0.65 is moderate; Obs power, the observed power or probability of avoiding a type 2 statistical error.
FIGURE 6.
The GME counts at all sizes and elapsed times up to 2 minutes post-venous room-air 100 mL/min pulse air stream at 4 L/min pump flow, 28% glycerin flow, and 34°C perfusate temperature.
Considering all elapsed times and all GME sizes, ECC C released significantly fewer GME than ECC A (p < 0.001). Both ECC A and ECC C test circuits passed significantly fewer GME overall than ECC B and ECC D systems (p < 0.001) during the PAS. ECC D allowed significantly less GME to pass than ECC B (p < 0.001) during the pulsed air stream. The main effects of GME counts at all sizes vs. elapsed time are displayed in Figure 7.
FIGURE 7.
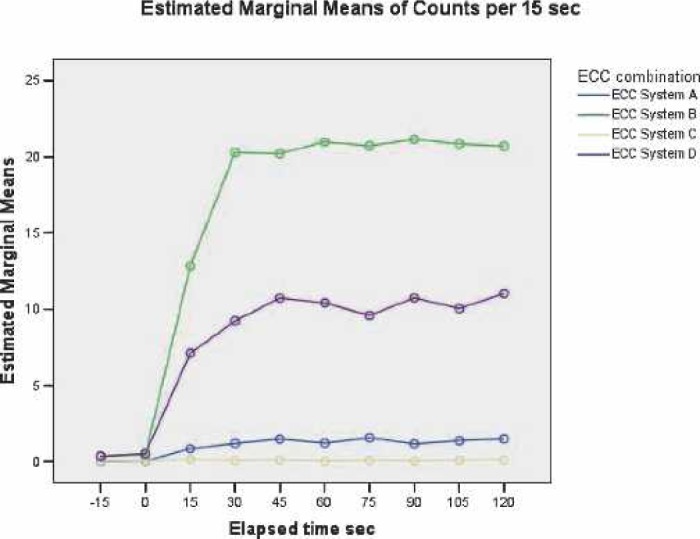
Main effects of GME counts at all sizes versus elapsed time.
DISCUSSION
Standard for In Vitro ECC Testing
There is a lack of standards on how to best measure and present GME information. Doppler ultrasound devices such as the Hatteland (Hatteland Instrumentering, Royken, Norway) are arguably the de facto standard for measuring ECC GME in the United States; however, Eitscherger et al. (24) showed significant inaccuracies with the Hatteland device.
Our study represents the first published commercial use of the EDAC sonographic emboli detection system designed specifically to measure and analyze ECC GME. In a side-by-side comparison of two emboli detection systems, the EDAC system was been proven to be remarkably more sensitive than the Hatteland device in both blood and water-filled ECCs (25).
To create both an improved and clinically relevant standard for in vitro GME detection and analysis, we designed and implemented several key elements into our test circuit. We modeled our methodology after the US Food and Drug Administration (FDA) recommended guidance for cardiopulmonary bypass arterial line blood filter 510(k) submission (http://www.fda.gov/cdrh/ode/guidance/1622.html). The bubble oxygenator proved to be a very simple GME source that produced a consistent number and size range of GME.
To further ensure that our test circuit was clinically relevant, FMCEA’s Quality Indicator (QI) database repre some 30,000 + adult CPB procedures per year was used to standardize important experimental conditions (26). For example, the targeted perfusate flow (41/min) and temperature (32°C) were directly derived from the clinical indicator database. We found that a 28% glycerin solution performed favorably to a 23% HCT which incidentally is the average nadir HCT found in FMCEA QI database.
Clinical Relevance
The purpose of this study was to rank air-handling ability of several ECCs; however, the results of this study beg the question whether these measured differences are clinically significant. While the possibility of measuring GME volume in patients undergoing CPB is feasible (21), to date the GME load required to produce neurologic impairment in humans is difficult to establish (27). Several observational studies and one randomized control trial have successfully correlated negative neurological outcomes with increased high intensity signals from transcranial Doppler measurement systems (9,14,27,28).
It seems that the design of the ECC component(s) does influence the air-handling ability of the circuit (19). We agree with authors Weitkemper et al. (21) and Jones et al. (21) that more research should be done to improve ECC components and clinical practice to eliminate GME. Today, more research is required to characterize the new “miniature” ECCs that may be inferior in air-handling ability (29).
Sources of Error
The success in this method was caused in part by the consistent performance of the EDAC system. The EDAC system was originally developed jointly by Orincon Corporation (San Diego, CA; purchased by Lockheed Martin, Bethesda, MD in 2003) and Embolus (Durham, NC) and funded by National Institutes of Health and National Medical Technology Testbed. Other than previous work by Jones and colleagues (19,20) additional data on EDAC reliability is missing. Correlation results between traditionally used GME measurement systems and the EDAC are not available. A potential weakness in this study design was the measurement of only two each for the test ECC configurations; however, the SE in this method was small.
In summary, we were successful in measuring and statistically ranking the GME separation by ECC configurations from four different manufacturers. Our method confirmed earlier work and improved the study design (18) that show that there are significant differences in the air-handling ability of various ECC designs. Despite improvements in ECC technology and clinical cardiac surgery practice over the past 30 years, many investigators have revealed the untoward impact of microemboli on neurological and cognitive impairment after cardiac surgery (30). Further clinical study is necessary to determine the relationship of the air-handling characteristics of ECCs and their association to neurological outcomes.
ACKNOWLEDGMENTS
We gratefully acknowledge the technical advice and support provided by Ron Hileman. We thank the four cardiovascular manufacturers (Cobe Cardiovascular, Gish Biomedical, Medtronic, and Terumo Cardiovascular Systems, Corp.) for their support and generous donation of ECC components. Jeffrey B. Riley is a consultant to Luna Innovations (Blacksburg, VA) and Fresenius Medical Care Extracorporeal Alliance (San Diego, CA).
APPENDIX
A test circuit similar to the one described in the Materials and Methods section (also Figure 1) was used to compare and contrast GME counts of both glycerin and blood ECC primes. GME outlet counts produced from a bubble oxygenator were measured distal to the arterial filter under varying concentrations of glycerin-saline solution and compared to a 23% porcine hematocrit (Table A1).
The section table in Table A2 shows the results of unfiltered GME counts at approximate micron size ranges of five different glycerine or blood ECC prime concentrations.
The second section shows the results of GME filter counts (38 μm cut-off) at approximate micron size ranges of five different glycerine or blood ECC prime concentrations.
Table A1.
Bubble oxygenator outlet GME count linear regression statistics for different glycerin solutions compared to 23% hematocrit blood.
| Glycerin solution | Slope | Intercept | R2 (10) |
|---|---|---|---|
| 15% | 1.3882 | 15.417 | 0.742* |
| 20% | 1.8375 | 94.915 | 0.700* |
| 25% | 1.3474 | −14.459 | 0.779* |
| 28% | 1.18 | 48.12 | 0.176 |
| 30% | 1.076 | −21.964 | 0.481* |
| 32% | .8754 | 52.361 | 0.256* |
Significant at P < 0.05.
GME counts in 23% hematocrit blood were regressed against similar size counts in several glycerin solutions for size ranges (n = 10) between 12 to 100 μm. The best blood GME count correlation with glycerine solution was at about 28% glycerine.
Table A2.
Bubble oxygenator GME outlet counts at approximate micron size ranges for five different test solutions filtered and not filtered.
| Solution | 0–15 μm | 16–30 μm | 31–45 μm | 46–60 μm | 61–75 μm | 76–90 μm |
|---|---|---|---|---|---|---|
| GME counts at approximate | ||||||
| micron size up to 90 μm | ||||||
| 20% glycerin | 131* | 237* | 106* | 18* | 1* | 0 |
| 28% glycerin | 206 | 519 | 473 | 266 | 63 | 13 |
| 23% hematocrit | 235 | 607 | 469 | 191 | 39 | 5 |
| 32% glycerin | 53* | 355* | 407* | 380* | 274* | 117* |
| 37% hematocrit | 98* | 547 | 527* | 435* | 204* | 48* |
| GME counts at approximate | ||||||
| micron size up to 38 μm | ||||||
| 20% glycerin | 69 | 136* | 48* | 6* | 1 | 0 |
| 28% glycerin | 150 | 467 | 399 | 99 | 9 | 1 |
| 23% hematocrit | 290 | 520 | 166 | 14 | 1 | 0 |
| 32% glycerin | 105 | 469 | 460* | 322* | 93* | 20* |
| 37% hematocrit | 167 | 581* | 359* | 19 | 3 | 0 |
N = 3–10 observations per cell.
Compared with 23% hematocrit P < 0.05.
GME counts in 23% and 37% hematocrit blood were compared with counts in three glycerin solutions for size ranges between ∼0–90 μm. The best blood GME count agreement in the most GME size ranges with glycerin solution was at 28% glycerin.
REFERENCES
- 1.Wong BI, McLean RF, Naylor CD, et al. . Central nervous system dysfunction after warm or hypothermic cardiopulmonary bypass. Lancet. 1992;339:I383–4. [DOI] [PubMed] [Google Scholar]
- 2.Shaw PJ, Bates D, Cartlidge NE, Heaviside D, Julian DG, Shaw DA.. Early neurological complications of coronary artery bypass surgery. BMJ. 1985;291:1384–7. [DOI] [PMC free article] [PubMed] [Google Scholar]
- 3.Shaw PJ, Bates D, Cartlidge NE, et al. . Neurologic and neuropsychological morbidity following major surgery. Comparison of coronary artery bypass and peripheral vascular surgery. Stroke. 1987;18:700–7. [DOI] [PubMed] [Google Scholar]
- 4.Roach GW, Kanchuger M, Mora M, et al. . Adverse cerebral outcomes after coronary bypass surgery. N Engl J Med. 1996;335:1857–63. [DOI] [PubMed] [Google Scholar]
- 5.Pugsley W, Klinger L, Paschalis C, et al. . Microemboli and cerebral impairment during cardiac surgery. Vasc Surg. 1990;24:34–43. [Google Scholar]
- 6.Blauth CI, Arnold HV, Schulenberg WE, McKhann GM, Taylor KM.. Cerebral microembolism during cardiopulmonary bypass: Retinal microvascular studies in vivo with fluorescein angiography. J Thorac Cardiovasc Surg. 1998;95:668–76. [PubMed] [Google Scholar]
- 7.Hammon JW, Stump DA, Kon ND, et al. . Risk factors and solutions for the development of neurobehavioral changes after coronary artery bypass grafting. Ann Thorac Surg. 1997;63:1613–8. [DOI] [PubMed] [Google Scholar]
- 8.Blauth CI.. Macroemboli and microemboli during cardiopulmonary bypass. Ann Thorac Surg. 1995;59:1300–3. [DOI] [PubMed] [Google Scholar]
- 9.Borger MA, Taylor RL, Weisel RD, et al. . Decreased cerebral emboli during distal aortic arch cannulation: a randomized trial. J Thorac Cardiovasc Surg. 1999;118:740–5. [DOI] [PubMed] [Google Scholar]
- 10.Taylor RL, Borger MA, Wesel RD, Fedorko L, Feindel CM.. Cerebral microemboli during cardiopulmonary bypass: increased emboli during perfusionist interventions. Ann Thorac Surg. 1999;68:89–93. [DOI] [PubMed] [Google Scholar]
- 11.Borger MA, Peniston CM, Weisel RD, Vasiliou M, Green RE, Feindel CM.. Neuropsychologic impairment after coronary artery bypass surgery. Effect of gaseous microemboli during perfusionist interventions. J Thorac Cardiovasc Surg. 2001;121:743–9. [DOI] [PubMed] [Google Scholar]
- 12.Rodriguez RA, Williams KA, Babaev A, Rubens F, Nathan HJ.. Effect of perfusionist technique on cerebral embolization during cardiopulmonary bypass. Perfusion. 2005;20:3–10. [DOI] [PubMed] [Google Scholar]
- 13.Rodriguez RA, Rubens F, Bellway D, Nathan HJ.. Residual air in the venous cannula increases cerebral embolization at the onset of cardiopulmonary bypass. Eur J Cardiothorac Surg. 2006;29:175–80. [DOI] [PubMed] [Google Scholar]
- 14.Stump DA, Rogers AT, Hammon JW, Newman SP.. Cerebral emboli and cognitive outcome after cardiac surgery. J Cardiothorac Vasc Surg. 1996;10:113–8. [DOI] [PubMed] [Google Scholar]
- 15.Pugsley W, Klinger L, Paschalis C, Treasure T, Harrison M, Newman S.. The impact of microemboli during cardiopulmonary bypass on neuropsychological functioning. Stroke. 1994;25:1393–9. [DOI] [PubMed] [Google Scholar]
- 16.Kurusz M, Butler BD.. Embolic events and cardiopulmonary bypass. Gravlee GP, Davis RF, Utley JR, eds. Cardiopulmonary Bypass Principles and Practice. Williams and Wilkins, 1993:267–90. [Google Scholar]
- 17.Mitchell SJ, Willcox T, McDougal C, Gorman DF.. Emboli generation by the Medtronic Maxima hard-shell adult venous reservoir in cardiopulmonary bypass circuits: a preliminary report. Perfusion. 1996;11:145–55. [DOI] [PubMed] [Google Scholar]
- 18.Mitchell SJ, Willcox T, Gorman DF.. Bubble generation and venous air filtration by hard-shell venous reservoirs: a comparative study. Perfusion. 1997;12:325–33. [DOI] [PubMed] [Google Scholar]
- 19.Jones TJ, Deal DD, Vernon JC, Blackburn N, Stump DA.. How effective are cardiopulmonary bypass circuits at removing gaseous microemboli. J Extra Corpor Technol. 2002;34:34–9. [PubMed] [Google Scholar]
- 20.Jones TJ, Deal DD, Vernon JC, Blackburn N, Stump DA.. Does vacuum assisted venous drainage increase gaseous microemboli during cardiopulmonary bypass? Ann Thorac Surg. 2002;74:2132–7. [DOI] [PubMed] [Google Scholar]
- 21.Weitkemper HH, Oppermann B, Spilker A, Knobl HJ, Körfer R.. Gaseous microemboli and the influence of microporous membrane oxygenators. J Extra Corpor Technol. 2005;37:256–64. [PMC free article] [PubMed] [Google Scholar]
- 22.Rudolph JL, Tilahun D, Treanor PR, et al. . Use of a large bore syringe creates significantly fewer high intensity transient signals (HITS) into a cardiopulmonary bypass system than a small bore syringe. Perfusion. 2006;21:67–71. [DOI] [PubMed] [Google Scholar]
- 23.Riley JB, Fitch RW.. A technique for computerized monitoring and analysis of a pulsed Doppler system to count ECC gaseous micro-emboli. J Extra Corpor Technol. 1986;18:151–55. [Google Scholar]
- 24.Eitschberger S, Henseler A, Krasenbrink B, Oedekoven B, Mottaghy K.. Investigation of the ability of an ultrasound bubble detector to deliver size measurements of gaseous bubble in fluid lines by using a glass bead model. ASAIO J. 2004;47:18–24. [DOI] [PubMed] [Google Scholar]
- 25.Stump DA, Vernon JC, Deal DD.. A comparison of the Hatteland CMD-10 versus the Embolus Detection and Classification system. Heart Surg Forum. 2004;7:E617. [Google Scholar]
- 26.Dickinson TA, Riley JB, Zabetakis PM.. External validation of compliance to quality indicators. Perfusion. 2004;19:295–9. [DOI] [PubMed] [Google Scholar]
- 27.Barbut D, Yao FS, Lo YW, et al. . Determination of size of aortic emboli and embolic load during coronary artery bypass grafting. Ann Thorac Surg. 1997;63:1262–67. [PubMed] [Google Scholar]
- 28.Clark RE, Brillman J, Davis DA, Lovell MR, Price TRP, McGovern GJ.. Microemboli during coronary artery bypass grafting: Genesis and effect on outcomes. J Thorac Cardiovasc Surg. 1995;109:249–58. [DOI] [PubMed] [Google Scholar]
- 29.Liebold A, Khosravi A, Westphal B, et al. . Effect of closed minimized cardiopulmonary bypass on cerebral tissue oxygenation and microembolization. J Thorac Cardiovasc Surg. 2006;131:268–76. [DOI] [PubMed] [Google Scholar]
- 30.Loop FD, Szabo J, Rowlinson RD, Urbanek K.. Events related to microembolism during extracorporeal perfusion in man: effectiveness on in-line filtration recorded by ultrasound. Ann Thorac Surg. 1976;21:412–20. [DOI] [PubMed] [Google Scholar]


